Estimated zip code population in 2022: 18,962 Zip code population in 2010: 17,054 Zip code population in 2000: 16,078
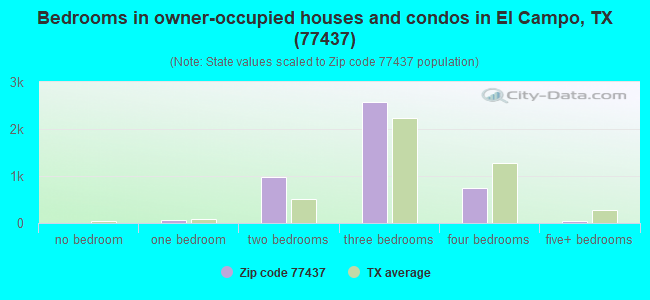
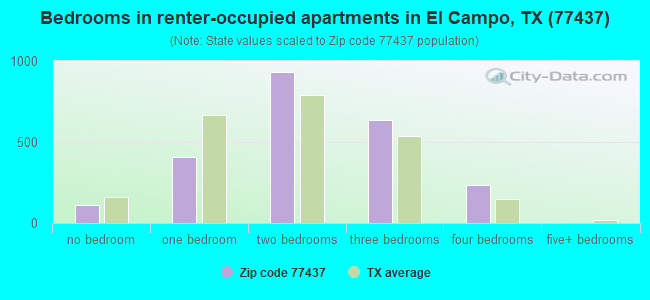
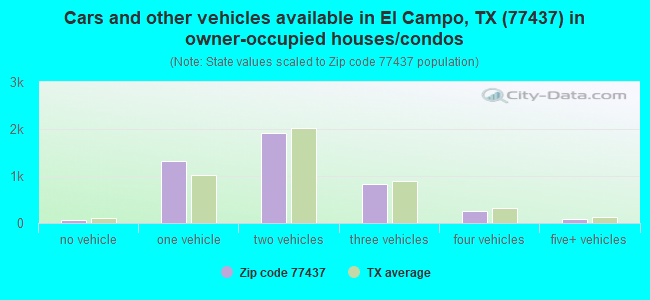
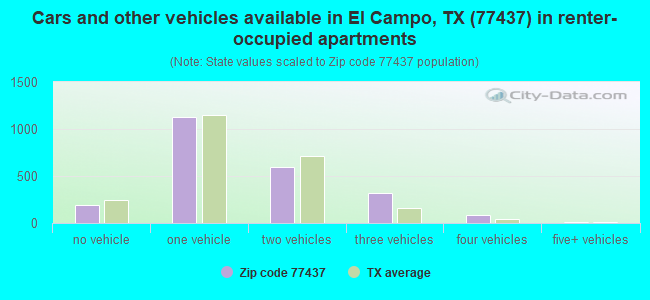
Houses and condos: 7,339 Renter-occupied apartments: 2,334
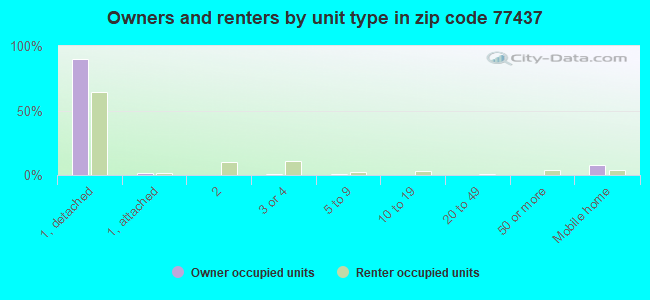
% of renters here:
34%
State:
38%
March 2022 cost of living index in zip code 77437: 79.1 (low, U.S. average is 100)
Land area: 321.9 sq. mi. Water area: 1.9 sq. mi.
Population density: 59 people per square mile
(very low).
OSM Map
General Map
Google Map
MSN Map
OSM Map
General Map
Google Map
MSN Map
OSM Map
General Map
Google Map
MSN Map
OSM Map
General Map
Google Map
MSN Map
Please wait while loading the map...
Real estate property taxes paid for housing units in 2022:
This zip code:
1.7% ($3,191)
Texas:
1.5% ($4,050)
Median real estate property taxes paid for housing units with mortgages in 2022: $3,615 (1.6%) Median real estate property taxes paid for housing units with no mortgage in 2022: $2,807 (1.7%)
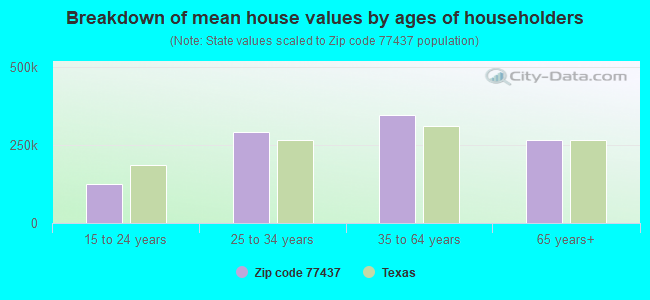
Estimated median house/condo value in 2022: $193,011
77437:
$193,011
Texas:
$275,400
According to our research of Texas and other state lists, there were 47 registered sex offenders living in 77437 zip code as of April 24, 2024. The ratio of all residents to sex offenders in zip code 77437 is 364 to 1. The ratio of registered sex offenders to all residents in this zip code is near the state average.
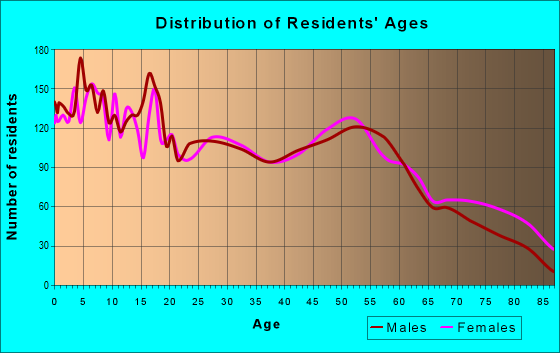
Median resident age:
This zip code:
37.5 years
Texas median age:
35.6 years
Average household size:
This zip code:
2.8 people
Texas:
2.6 people
Averages for the 2020 tax year for zip code 77437, filed in 2021:
Average Adjusted Gross Income (AGI) in 2020: $59,706 (Individual Income Tax Returns)
Here:
$59,706
State:
$77,054
Salary/wage: $45,756 (reported on 84.1% of returns)
Here:
$45,756
State:
$62,766
(% of AGI for various income ranges: 1346.2% for AGIs below $25k, 3824.2% for AGIs $25k-50k, 6706.3% for AGIs $50k-75k, 10296.8% for AGIs $75k-100k, 17887.1% for AGIs $100k-200k, 69925.0% for AGIs over 200k)
Taxable interest for individuals: $2,138 (reported on 30.0% of returns)
This zip code:
$2,138
Texas:
$2,665
(% of AGI for various income ranges: 15.3% for AGIs below $25k, 23.2% for AGIs $25k-50k, 52.2% for AGIs $50k-75k, 102.9% for AGIs $75k-100k, 256.7% for AGIs $100k-200k, 4145.0% for AGIs over 200k)
Ordinary dividends: $9,774 (reported on 12.1% of returns)
Here:
$9,774
State:
$10,044
(% of AGI for various income ranges: 12.1% for AGIs below $25k, 23.3% for AGIs $25k-50k, 68.1% for AGIs $50k-75k, 138.9% for AGIs $75k-100k, 369.8% for AGIs $100k-200k, 10413.3% for AGIs over 200k)
Net capital gain/loss in AGI: +$27,075 (reported on 11.7% of returns)
Here:
+$27,075
State:
+$39,590
(% of AGI for various income ranges: 7.8% for AGIs below $25k, 18.1% for AGIs $25k-50k, 59.5% for AGIs $50k-75k, 263.9% for AGIs $75k-100k, 889.8% for AGIs $100k-200k, 32921.7% for AGIs over 200k)
Profit/loss from business: +$12,559 (reported on 18.2% of returns)
Here:
+$12,559
State:
+$10,888
(% of AGI for various income ranges: 135.8% for AGIs below $25k, 103.6% for AGIs $25k-50k, 217.1% for AGIs $50k-75k, 190.8% for AGIs $75k-100k, 985.2% for AGIs $100k-200k, 11155.0% for AGIs over 200k)
Taxable individual retirement arrangement distribution: $21,471 (reported on 7.2% of returns)
77437:
$21,471
Texas:
$24,740
(% of AGI for various income ranges: 31.9% for AGIs below $25k, 67.4% for AGIs $25k-50k, 191.0% for AGIs $50k-75k, 466.8% for AGIs $75k-100k, 814.4% for AGIs $100k-200k, 5950.0% for AGIs over 200k)
Self-employed (Keogh) retirement plans: $20,500 (reported on 0.4% of returns)
77437:
$20,500
Texas:
$29,298
(% of AGI for various income ranges: 128.1% for AGIs $100k-200k)
Total itemized deductions: $41,622 (reported on 3.9% of returns)
Here:
$41,622
State:
$40,428
(% of AGI for various income ranges: 114.9% for AGIs $25k-50k, 264.3% for AGIs $50k-75k, 337.1% for AGIs $75k-100k, 582.5% for AGIs $100k-200k, 8650.0% for AGIs over 200k)
Charity contributions: $9,723 (reported on 3.2% of returns)
Here:
$9,723
State:
$18,201
(% of AGI for various income ranges: 13.8% for AGIs $25k-50k, 38.2% for AGIs $50k-75k, 57.4% for AGIs $75k-100k, 161.7% for AGIs $100k-200k, 1660.0% for AGIs over 200k)
Taxes paid: $7,053 (reported on 3.6% of returns)
77437:
$7,053
State:
$7,821
(% of AGI for various income ranges: 17.5% for AGIs $25k-50k, 49.9% for AGIs $50k-75k, 43.4% for AGIs $75k-100k, 131.5% for AGIs $100k-200k, 1045.0% for AGIs over 200k)
Earned income credit: $2,783 (reported on 25.1% of returns)
Here:
$2,783
State:
$2,584
(% of AGI for various income ranges: 168.2% for AGIs below $25k, 103.7% for AGIs $25k-50k, 2.3% for AGIs $50k-75k)
Percentage of individuals using paid preparers for their 2020 taxes: 92.5%
Here:
92%
State:
92%
(% for various income ranges: 91.3% for AGIs below $25k, 92.2% for AGIs $25k-50k, 93.6% for AGIs $50k-75k, 93.3% for AGIs $75k-100k, 93.2% for AGIs $100k-200k, 100.0% for AGIs over 200k)
Averages for the 2012 tax year for zip code 77437, filed in 2013:
Average Adjusted Gross Income (AGI) in 2012: $59,108 (Individual Income Tax Returns)
Here:
$59,108
State:
$65,384
Salary/wage: $41,096 (reported on 86.7% of returns)
Here:
$41,096
State:
$52,524
(% of AGI for various income ranges: 81.5% for AGIs below $25k, 85.4% for AGIs $25k-50k, 81.7% for AGIs $50k-75k, 78.4% for AGIs $75k-100k, 69.5% for AGIs $100k-200k, 19.2% for AGIs over 200k)
Taxable interest for individuals: $1,423 (reported on 29.7% of returns)
This zip code:
$1,423
Texas:
$2,372
(% of AGI for various income ranges: 0.7% for AGIs below $25k, 0.5% for AGIs $25k-50k, 0.5% for AGIs $50k-75k, 0.6% for AGIs $75k-100k, 0.8% for AGIs $100k-200k, 0.9% for AGIs over 200k)
Ordinary dividends: $6,673 (reported on 13.0% of returns)
Here:
$6,673
State:
$9,721
(% of AGI for various income ranges: 0.9% for AGIs below $25k, 0.4% for AGIs $25k-50k, 0.8% for AGIs $50k-75k, 1.0% for AGIs $75k-100k, 1.3% for AGIs $100k-200k, 2.7% for AGIs over 200k)
Net capital gain/loss in AGI: +$10,559 (reported on 10.8% of returns)
Here:
+$10,559
State:
+$35,319
(% of AGI for various income ranges: 0.4% for AGIs $25k-50k, 0.4% for AGIs $50k-75k, 1.3% for AGIs $75k-100k, 2.2% for AGIs $100k-200k, 3.9% for AGIs over 200k)
Profit/loss from business: +$18,899 (reported on 18.3% of returns)
Here:
+$18,899
State:
+$13,732
(% of AGI for various income ranges: 8.0% for AGIs below $25k, 4.8% for AGIs $25k-50k, 3.9% for AGIs $50k-75k, 3.1% for AGIs $75k-100k, 5.8% for AGIs $100k-200k, 7.6% for AGIs over 200k)
Taxable individual retirement arrangement distribution: $14,665 (reported on 6.8% of returns)
77437:
$14,665
Texas:
$19,511
(% of AGI for various income ranges: 1.7% for AGIs below $25k, 1.2% for AGIs $25k-50k, 1.7% for AGIs $50k-75k, 2.8% for AGIs $75k-100k, 3.0% for AGIs $100k-200k, 0.6% for AGIs over 200k)
Self-employment retirement plans: $19,033 (reported on 0.8% of returns)
77437:
$19,033
Texas:
$23,938
Total itemized deductions: $23,148 (13% of AGI, reported on 15.8% of returns)
Here:
$23,148
State:
$24,724
Here:
13.4% of AGI
State:
15.9% of AGI
(% of AGI for various income ranges: 3.7% for AGIs below $25k, 5.4% for AGIs $25k-50k, 6.3% for AGIs $50k-75k, 7.2% for AGIs $75k-100k, 8.3% for AGIs $100k-200k, 5.4% for AGIs over 200k)
Charity contributions: $5,473 (reported on 12.4% of returns)
Here:
$5,473
State:
$6,808
(% of AGI for various income ranges: 0.2% for AGIs below $25k, 0.6% for AGIs $25k-50k, 1.0% for AGIs $50k-75k, 1.1% for AGIs $75k-100k, 1.5% for AGIs $100k-200k, 1.5% for AGIs over 200k)
Taxes paid: $6,105 (reported on 15.5% of returns)
77437:
$6,105
State:
$6,921
(% of AGI for various income ranges: 0.8% for AGIs below $25k, 1.1% for AGIs $25k-50k, 1.4% for AGIs $50k-75k, 2.0% for AGIs $75k-100k, 2.6% for AGIs $100k-200k, 1.3% for AGIs over 200k)
Earned income credit: $2,645 (reported on 26.0% of returns)
Here:
$2,645
State:
$2,570
(% of AGI for various income ranges: 9.9% for AGIs below $25k, 1.5% for AGIs $25k-50k)
Percentage of individuals using paid preparers for their 2012 taxes: 63.9%
Here:
64%
State:
51%
(% for various income ranges: 61.3% for AGIs below $25k, 61.2% for AGIs $25k-50k, 64.8% for AGIs $50k-75k, 65.0% for AGIs $75k-100k, 74.0% for AGIs $100k-200k, 88.9% for AGIs over 200k)
Averages for the 2004 tax year for zip code 77437, filed in 2005:
Average Adjusted Gross Income (AGI) in 2004: $36,866 (Individual Income Tax Returns)
Here:
$36,866
State:
$47,881
Salary/wage: $30,866 (reported on 85.1% of returns)
Here:
$30,866
State:
$41,947
(% of AGI for various income ranges: 158.2% for AGIs below $10k, 84.3% for AGIs $10k-25k, 84.7% for AGIs $25k-50k, 77.8% for AGIs $50k-75k, 75.6% for AGIs $75k-100k, 45.3% for AGIs over 100k)
Taxable interest for individuals: $2,136 (reported on 36.0% of returns)
This zip code:
$2,136
Texas:
$2,255
(% of AGI for various income ranges: 9.2% for AGIs below $10k, 1.9% for AGIs $10k-25k, 1.6% for AGIs $25k-50k, 2.1% for AGIs $50k-75k, 1.4% for AGIs $75k-100k, 2.4% for AGIs over 100k)
Taxable dividends: $2,750 (reported on 17.9% of returns)
Here:
$2,750
State:
$4,261
(% of AGI for various income ranges: 3.1% for AGIs below $10k, 0.6% for AGIs $10k-25k, 0.5% for AGIs $25k-50k, 0.7% for AGIs $50k-75k, 1.1% for AGIs $75k-100k, 2.6% for AGIs over 100k)
Net capital gain/loss: +$5,994 (reported on 15.5% of returns)
Here:
+$5,994
State:
+$16,110
(% of AGI for various income ranges: 2.8% for AGIs below $10k, 0.3% for AGIs $10k-25k, 0.4% for AGIs $25k-50k, 0.7% for AGIs $50k-75k, 1.0% for AGIs $75k-100k, 6.6% for AGIs over 100k)
Profit/loss from business: +$12,626 (reported on 14.8% of returns)
Here:
+$12,626
State:
+$11,013
(% of AGI for various income ranges: -19.1% for AGIs below $10k, 4.1% for AGIs $10k-25k, 3.3% for AGIs $25k-50k, 4.6% for AGIs $50k-75k, 5.6% for AGIs $75k-100k, 8.2% for AGIs over 100k)
IRA payment deduction: $3,508 (reported on 2.7% of returns)
77437:
$3,508
Texas:
$3,120
(% of AGI for various income ranges: 0.1% for AGIs $10k-25k, 0.3% for AGIs $25k-50k, 0.3% for AGIs $50k-75k, 0.4% for AGIs $75k-100k, 0.2% for AGIs over 100k)
Self-employed pension: $12,060 (reported on 0.7% of returns)
Here:
$12,060
Texas:
$16,401
Total itemized deductions: $23,126 (24% of AGI, reported on 12.2% of returns)
Here:
$23,126
State:
$19,631
Here:
23.7% of AGI
State:
18.9% of AGI
(% of AGI for various income ranges: 10.5% for AGIs below $10k, 3.5% for AGIs $10k-25k, 4.1% for AGIs $25k-50k, 6.3% for AGIs $50k-75k, 7.7% for AGIs $75k-100k, 12.5% for AGIs over 100k)
Charity contributions deductions: $4,267 (4% of AGI, reported on 10.4% of returns)
Here:
$4,267
State:
$4,753
Here:
4.3% of AGI
State:
4.2% of AGI
(% of AGI for various income ranges: 0.6% for AGIs below $10k, 0.5% for AGIs $10k-25k, 0.7% for AGIs $25k-50k, 1.0% for AGIs $50k-75k, 1.3% for AGIs $75k-100k, 2.0% for AGIs over 100k)
Total tax: $6,351 (reported on 65.4% of returns)
77437:
$6,351
State:
$9,058
(% of AGI for various income ranges: 5.3% for AGIs below $10k, 3.2% for AGIs $10k-25k, 6.2% for AGIs $25k-50k, 9.2% for AGIs $50k-75k, 11.6% for AGIs $75k-100k, 19.8% for AGIs over 100k)
Earned income credit: $2,127 (reported on 27.7% of returns)
Here:
$2,127
State:
$2,024
Percentage of individuals using paid preparers for their 2004 taxes: 66.5%
Here:
67%
State:
57%
(% for various income ranges: 62.1% for AGIs below $10k, 68.4% for AGIs $10k-25k, 64.9% for AGIs $25k-50k, 64.6% for AGIs $50k-75k, 69.1% for AGIs $75k-100k, 83.8% for AGIs over 100k)
Household received Food Stamps/SNAP in the past 12 months: 1,137 Household did not receive Food Stamps/SNAP in the past 12 months: 5,656
Women who had a birth in the past 12 months: 351 (175 now married, 171 unmarried) Women who did not have a birth in the past 12 months: 4,052 (2,017 now married, 2,027 unmarried)
Housing units in zip code 77437 with a mortgage: 1,925 (122 second mortgage, 132 both second mortgage and home equity loan) Houses without a mortgage: 18
Median monthly owner costs for units with a mortgage: $1,607 Median monthly owner costs for units without a mortgage: $593
Residents with income below the poverty level in 2022:
This zip code:
14.5%
Whole state:
14.0%
Residents with income below 50% of the poverty level in 2022:
This zip code:
8.9%
Whole state:
7.4%
Median number of rooms in houses and condos:
Here:
5.9
State:
6.3
Median number of rooms in apartments:
Here:
4.2
State:
4.0
Notable locations in this zip code not listed on our city pages
In group quarters: 241 (-1 institutionalized population)
Size of family households: 1,959 2-persons, 1,009 3-persons, 1,166 4-persons, 625 5-persons, 145 6-persons, 62 7-or-more-persons
Size of nonfamily households: 1,569 1-person, 199 2-persons, 14 3-persons
3,255 married couples with children.
1,359 single-parent households (480 men, 879 women).
68.6% of residents of 77437 zip code speak English at home.
31.0% of residents speak Spanish at home (63% very well, 15% well, 12% not well, 10% not at all).
0.2% of residents speak other Indo-European language at home (95% very well, 5% not well).
0.1% of residents speak Asian or Pacific Island language at home (89% very well, 11% not well).
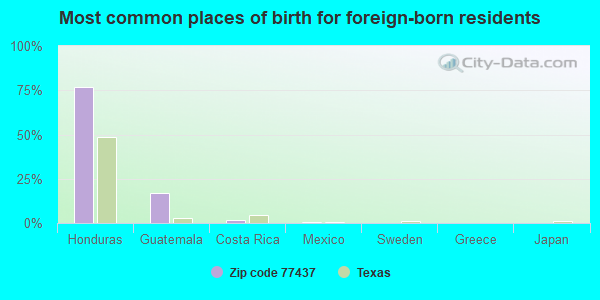
Foreign born population: 1,966 (10.4%) (44.8% of them are naturalized citizens)
This zip code:
10.4%
Whole state:
17.2%
77%Honduras
17%Guatemala
2%Costa Rica
1%Mexico
0%Sweden
0%Greece
0%Japan
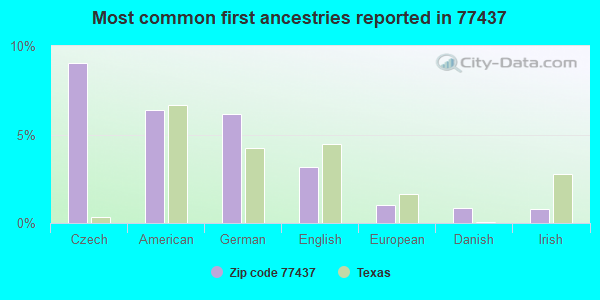
9%Czech
6%American
6%German
3%English
1%European
1%Danish
1%Irish
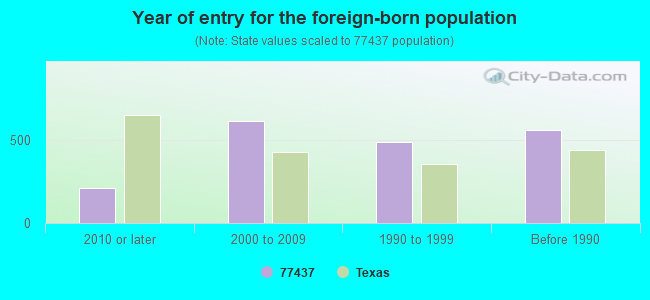
Year of entry for the foreign-born population
2142010 or later
6142000 to 2009
4901990 to 1999
562Before 1990
Facilities with environmental interests located in this zip code:
AEP CENTRAL POWER AND LIGHT COMPANY (MARION & WRIGHT ST in EL CAMPO, TX)
(Resource Conservation and Recovery Act (tracking hazardous waste)) Alternative names: CENTRAL PWR & LGHT EL CAMPO SVC CTR
AUGAT INC (614 N MECHANIC in EL CAMPO, TX)
(Resource Conservation and Recovery Act (tracking hazardous waste)) Alternative names: AUGAT INC EL CAMPO PLANT
ALAMO CONCRETE PRODUCTS, LTD. (LOOP 525E in EL CAMPO, TX)
National Pollutant Discharge Elimination System NON-MAJOR (Tracking pollutant discharge elimination systems) - permit Business SIC classification: READY-MIXED CONCRETE
AMERADA HESS CORP NEW TAITON FIELD (CR 471 2 MI NE OF in NEW TAITON, TX)
(Resource Conservation and Recovery Act (tracking hazardous waste)) Organizations: DEWBRE PETROLEUM CORPORATION (CONTACT/OPERATOR)
Alternative names: AMERADA HESS - NEW TAITON
ASHLEY OAKS WWTP (1300' S OF COUNTY RD 424 & 360 in EL CAMPO, TX)
National Pollutant Discharge Elimination System NON-MAJOR (Tracking pollutant discharge elimination systems) - permit Business SIC classification: OPERATORS OF RESIDENTIAL MOBILE HOME SITES Organizations: WALKER WATER WORKS, INC. (CONTACT/OWNER)
Alternative names: WALKER WATER WORKS INC
Housing units lacking complete plumbing facilities: 4.5% Housing units lacking complete kitchen facilities: 3.8%
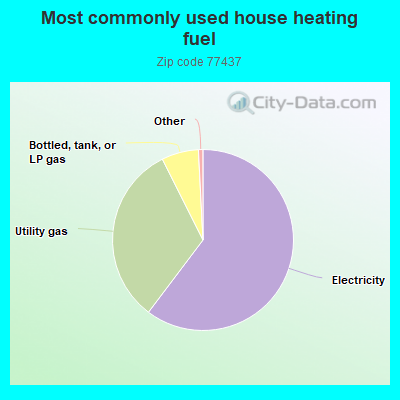
60.3%Electricity
32.3%Utility gas
6.6%Bottled, tank, or LP gas
Population in 1990: 15,829. Population change in the 1990s: +249 (+1.6%).
Place of birth for U.S.-born residents:
This state: 15,396
Northeast: 284
Midwest: 239
South: 492
West: 404
64% of the 77437 zip code residents lived in the same house 5 years ago. Out of people who lived in different houses, 73% lived in this county. Out of people who lived in different counties, 50% lived in Texas.
92% of the 77437 zip code residents lived in the same house 1 year ago. Out of people who lived in different houses, 66% moved from this county. Out of people who lived in different houses, 30% moved from different county within same state. Out of people who lived in different houses, 0% moved from different state. Out of people who lived in different houses, 2% moved from abroad.
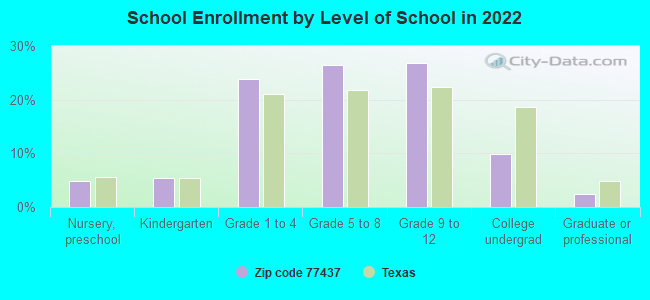
Private vs. public school enrollment:
Students in private schools in grades 1 to 8 (elementary and middle school): 319
Here:
13.2%
Texas:
8.8%
Students in private schools in grades 9 to 12 (high school): 7
Here:
0.6%
Texas:
8.0%
Students in private undergraduate colleges: 106
Here:
22.3%
Texas:
16.2%
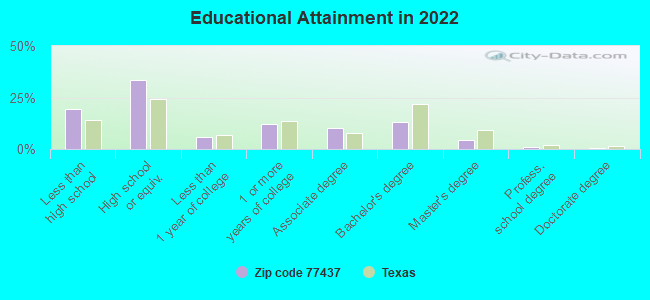
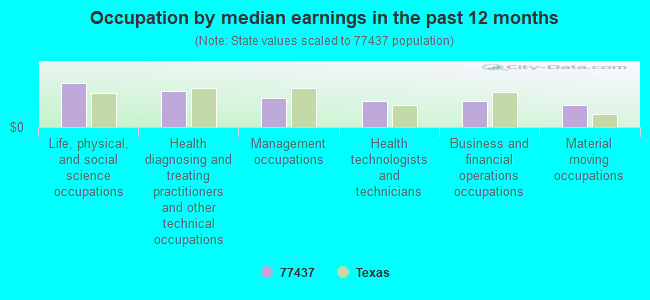
Occupation by median earnings in the past 12 months ($)
118,482Life, physical, and social science occupations
96,346Health diagnosing and treating practitioners and other technical occupations
78,967Management occupations
70,055Health technologists and technicians
68,692Business and financial operations occupations
58,809Material moving occupations
Companies with federal contracts located in this zip code:
M & M GRAVEL SALES INC (HWY 71 N ONE MILE in EL CAMPO, TX; small business)
$25,368 with Army for Mining, Rock Drilling, Earth Boring and Related Equipment. Signed on 2006-06-15. Completion date: 2006-08-17.
HELENA CHEMICAL COMPANY (HWY 59 BYP W in EL CAMPO, TX; small business)
$5,000 with U.S. Fish and Wildlife Service for Miscellaneous Chemical Specialties. Taking place in NM. Signed on 2001-12-15. Completion date: 2002-10-15.
Top industries in this zip code by the number of employees in 2005:
Mining: Support Activities for Oil and Gas Operations (20-49: 3, 10-19: 4, 1-4: 3)
People in group quarters in 2010:
106 people in nursing facilities/skilled-nursing facilities
16 people in other noninstitutional facilities
13 people in group homes intended for adults
5 people in workers' group living quarters and job corps centers
People in group quarters in 2000:
111 people in nursing homes
31 people in homes for the mentally retarded
27 people in other group homes
14 people in other nonhousehold living situations
4 people in schools, hospitals, or wards for the intellectually disabled
3 people in religious group quarters
2 people in wards in general hospitals for patients who have no usual home elsewhere
2002 - 2018 National Fire Incident Reporting System (NFIRS) incidents
According to the data from the years 2002 - 2018 the average number of fires per year is 96. The highest number of fire incidents - 140 took place in 2005, and the least - 68 in 2004. The data has a dropping trend.
When looking into fire subcategories, the most reports belonged to: Outside Fires (58.1%), and Structure Fires (23.2%).
Fire incident types reported to NFIRS in Zip Code 77437


 Nearest zip codes: 77443, 77455, 77432, 77467, 77436, 77488.
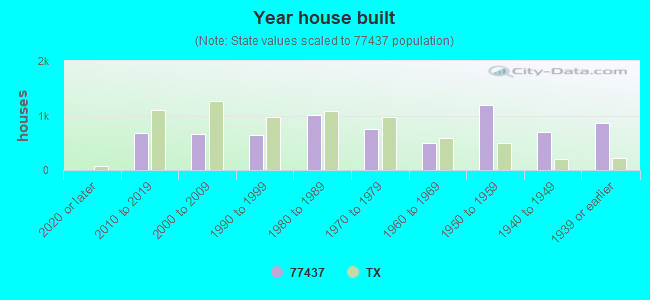


 According to the data from the years 2002 - 2018 the average number of fires per year is 96. The highest number of fire incidents - 140 took place in 2005, and the least - 68 in 2004. The data has a dropping trend.
 When looking into fire subcategories, the most reports belonged to: Outside Fires (58.1%), and Structure Fires (23.2%).