Estimated zip code population in 2022: 6,770 Zip code population in 2010: 6,446 Zip code population in 2000: 6,667
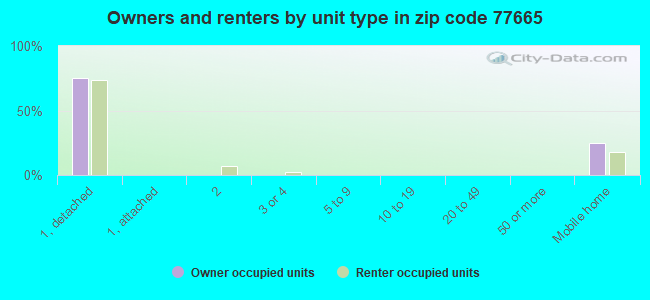
Houses and condos: 2,590 Renter-occupied apartments: 470
% of renters here:
22%
State:
38%
March 2022 cost of living index in zip code 77665: 94.4 (less than average, U.S. average is 100)
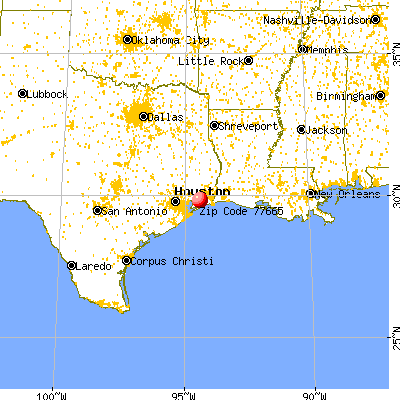
Land area: 134.7 sq. mi. Water area: 1.1 sq. mi.
Population density: 50 people per square mile
(very low).
OSM Map
General Map
Google Map
MSN Map
OSM Map
General Map
Google Map
MSN Map
OSM Map
General Map
Google Map
MSN Map
OSM Map
General Map
Google Map
MSN Map
Please wait while loading the map...
Real estate property taxes paid for housing units in 2022:
This zip code:
1.1% ($2,051)
Texas:
1.5% ($4,050)
Median real estate property taxes paid for housing units with mortgages in 2022: $2,819 (0.9%) Median real estate property taxes paid for housing units with no mortgage in 2022: $1,750 (1.2%)
Business Search- 14 Million verified businesses
Males: 3,652
(53.9%)
Females: 3,117
(46.1%)
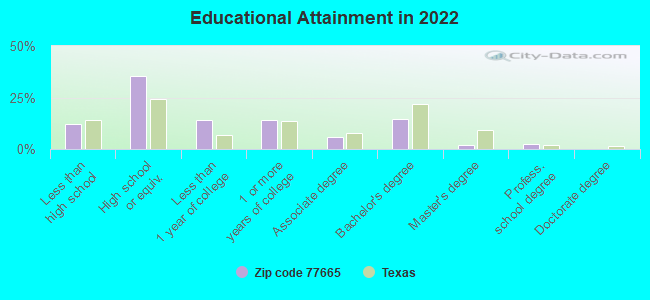
For population 25 years and over in 77665:
High school or higher: 87.0%
Bachelor's degree or higher: 18.5%
Graduate or professional degree: 4.3%
Unemployed: 6.6%
Mean travel time to work (commute): 29.5 minutes
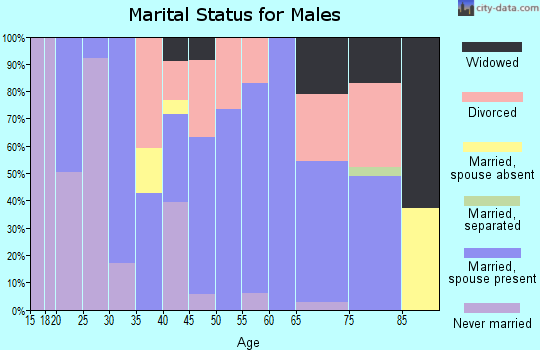
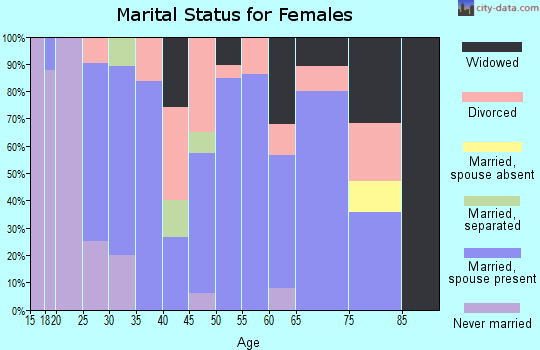
For population 15 years and over in 77665:
Never married: 29.5%
Now married: 56.0%
Separated: 0.5%
Widowed: 4.9%
Divorced: 9.2%
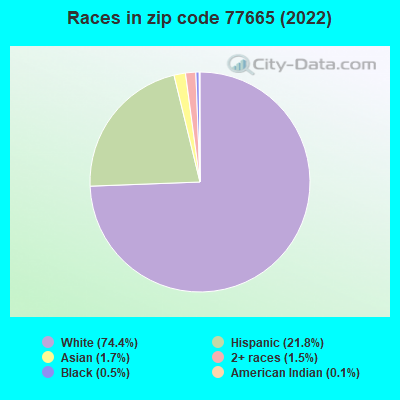
Zip code 77665 compared to state average:
Black race population percentage significantly below state average.
Hispanic race population percentage below state average.
Median age above state average.
Foreign-born population percentage below state average.
Renting percentage below state average.
Length of stay since moving in significantly above state average.
Percentage of population with a bachelor's degree or higher below state average.
Averages for the 2020 tax year for zip code 77665, filed in 2021:
Average Adjusted Gross Income (AGI) in 2020: $65,528 (Individual Income Tax Returns)
Here:
$65,528
State:
$77,054
Salary/wage: $58,266 (reported on 85.7% of returns)
Here:
$58,266
State:
$62,766
(% of AGI for various income ranges: 1316.1% for AGIs below $25k, 3838.2% for AGIs $25k-50k, 6864.6% for AGIs $50k-75k, 9051.4% for AGIs $75k-100k, 16585.9% for AGIs $100k-200k, 60867.5% for AGIs over 200k)
Taxable interest for individuals: $848 (reported on 27.1% of returns)
This zip code:
$848
Texas:
$2,665
(% of AGI for various income ranges: 8.4% for AGIs below $25k, 6.4% for AGIs $25k-50k, 21.0% for AGIs $50k-75k, 75.0% for AGIs $75k-100k, 66.2% for AGIs $100k-200k, 420.0% for AGIs over 200k)
Ordinary dividends: $4,255 (reported on 10.3% of returns)
Here:
$4,255
State:
$10,044
(% of AGI for various income ranges: 13.9% for AGIs below $25k, 11.1% for AGIs $25k-50k, 40.8% for AGIs $50k-75k, 96.4% for AGIs $75k-100k, 172.5% for AGIs $100k-200k, 735.0% for AGIs over 200k)
Net capital gain/loss in AGI: +$13,765 (reported on 9.7% of returns)
Here:
+$13,765
State:
+$39,590
(% of AGI for various income ranges: 10.4% for AGIs below $25k, 3.6% for AGIs $25k-50k, 44.9% for AGIs $50k-75k, 177.7% for AGIs $75k-100k, 310.6% for AGIs $100k-200k, 6495.0% for AGIs over 200k)
Profit/loss from business: +$2,845 (reported on 19.3% of returns)
Here:
+$2,845
State:
+$10,888
(% of AGI for various income ranges: 113.5% for AGIs below $25k, 188.1% for AGIs $100k-200k, 3042.5% for AGIs over 200k)
Taxable individual retirement arrangement distribution: $25,000 (reported on 6.9% of returns)
77665:
$25,000
Texas:
$24,740
(% of AGI for various income ranges: 40.0% for AGIs below $25k, 64.1% for AGIs $25k-50k, 145.6% for AGIs $50k-75k, 419.1% for AGIs $75k-100k, 1018.4% for AGIs $100k-200k)
Total itemized deductions: $45,035 (reported on 5.3% of returns)
Here:
$45,035
State:
$40,428
(% of AGI for various income ranges: 150.5% for AGIs $25k-50k, 509.7% for AGIs $50k-75k, 777.8% for AGIs $100k-200k, 5465.0% for AGIs over 200k)
Charity contributions: $21,200 (reported on 3.1% of returns)
Here:
$21,200
State:
$18,201
(% of AGI for various income ranges: 100.8% for AGIs $50k-75k, 245.9% for AGIs $100k-200k, 2350.0% for AGIs over 200k)
Taxes paid: $6,677 (reported on 4.0% of returns)
77665:
$6,677
State:
$7,821
(% of AGI for various income ranges: 73.6% for AGIs $50k-75k, 113.8% for AGIs $100k-200k, 542.5% for AGIs over 200k)
Earned income credit: $2,541 (reported on 18.1% of returns)
Here:
$2,541
State:
$2,584
(% of AGI for various income ranges: 121.8% for AGIs below $25k, 72.0% for AGIs $25k-50k)
Percentage of individuals using paid preparers for their 2020 taxes: 89.4%
Here:
89%
State:
92%
(% for various income ranges: 88.1% for AGIs below $25k, 87.2% for AGIs $25k-50k, 90.0% for AGIs $50k-75k, 92.6% for AGIs $75k-100k, 91.5% for AGIs $100k-200k, 100.0% for AGIs over 200k)
Averages for the 2012 tax year for zip code 77665, filed in 2013:
Average Adjusted Gross Income (AGI) in 2012: $52,631 (Individual Income Tax Returns)
Here:
$52,631
State:
$65,384
Salary/wage: $47,177 (reported on 87.6% of returns)
Here:
$47,177
State:
$52,524
(% of AGI for various income ranges: 83.6% for AGIs below $25k, 86.5% for AGIs $25k-50k, 83.7% for AGIs $50k-75k, 86.8% for AGIs $75k-100k, 83.5% for AGIs $100k-200k, 45.1% for AGIs over 200k)
Taxable interest for individuals: $911 (reported on 25.9% of returns)
This zip code:
$911
Texas:
$2,372
(% of AGI for various income ranges: 1.1% for AGIs below $25k, 0.5% for AGIs $25k-50k, 0.3% for AGIs $50k-75k, 0.2% for AGIs $75k-100k, 0.4% for AGIs $100k-200k, 0.5% for AGIs over 200k)
Ordinary dividends: $5,155 (reported on 11.7% of returns)
Here:
$5,155
State:
$9,721
(% of AGI for various income ranges: 0.9% for AGIs below $25k, 0.6% for AGIs $25k-50k, 0.6% for AGIs $50k-75k, 0.9% for AGIs $75k-100k, 1.5% for AGIs $100k-200k, 2.0% for AGIs over 200k)
Net capital gain/loss in AGI: +$10,242 (reported on 9.2% of returns)
Here:
+$10,242
State:
+$35,319
(% of AGI for various income ranges: 0.2% for AGIs below $25k, 0.2% for AGIs $25k-50k, 1.2% for AGIs $50k-75k, 0.2% for AGIs $75k-100k, 0.9% for AGIs $100k-200k, 8.1% for AGIs over 200k)
Profit/loss from business: +$15,020 (reported on 16.3% of returns)
Here:
+$15,020
State:
+$13,732
(% of AGI for various income ranges: 7.1% for AGIs below $25k, 2.7% for AGIs $25k-50k, 3.0% for AGIs $50k-75k, 2.4% for AGIs $75k-100k, 3.4% for AGIs $100k-200k, 11.4% for AGIs over 200k)
Taxable individual retirement arrangement distribution: $14,790 (reported on 7.1% of returns)
77665:
$14,790
Texas:
$19,511
(% of AGI for various income ranges: 2.5% for AGIs below $25k, 2.0% for AGIs $25k-50k, 1.8% for AGIs $50k-75k, 2.1% for AGIs $75k-100k, 3.0% for AGIs $100k-200k)
Total itemized deductions: $20,928 (20% of AGI, reported on 19.1% of returns)
Here:
$20,928
State:
$24,724
Here:
20.1% of AGI
State:
15.9% of AGI
(% of AGI for various income ranges: 6.1% for AGIs below $25k, 7.2% for AGIs $25k-50k, 8.4% for AGIs $50k-75k, 8.6% for AGIs $75k-100k, 7.7% for AGIs $100k-200k, 7.0% for AGIs over 200k)
Charity contributions: $6,188 (reported on 14.5% of returns)
Here:
$6,188
State:
$6,808
(% of AGI for various income ranges: 0.4% for AGIs below $25k, 0.9% for AGIs $25k-50k, 1.5% for AGIs $50k-75k, 1.8% for AGIs $75k-100k, 2.4% for AGIs $100k-200k, 2.3% for AGIs over 200k)
Taxes paid: $4,323 (reported on 18.8% of returns)
77665:
$4,323
State:
$6,921
(% of AGI for various income ranges: 0.7% for AGIs below $25k, 1.0% for AGIs $25k-50k, 1.3% for AGIs $50k-75k, 1.6% for AGIs $75k-100k, 2.2% for AGIs $100k-200k, 1.6% for AGIs over 200k)
Earned income credit: $2,350 (reported on 20.6% of returns)
Here:
$2,350
State:
$2,570
(% of AGI for various income ranges: 7.7% for AGIs below $25k, 1.3% for AGIs $25k-50k)
Percentage of individuals using paid preparers for their 2012 taxes: 61.0%
Here:
61%
State:
51%
(% for various income ranges: 58.2% for AGIs below $25k, 58.6% for AGIs $25k-50k, 62.2% for AGIs $50k-75k, 65.4% for AGIs $75k-100k, 65.6% for AGIs $100k-200k, 85.7% for AGIs over 200k)
Averages for the 2004 tax year for zip code 77665, filed in 2005:
Average Adjusted Gross Income (AGI) in 2004: $36,928 (Individual Income Tax Returns)
Here:
$36,928
State:
$47,881
Salary/wage: $36,010 (reported on 86.1% of returns)
Here:
$36,010
State:
$41,947
(% of AGI for various income ranges: 172.5% for AGIs below $10k, 84.1% for AGIs $10k-25k, 86.6% for AGIs $25k-50k, 87.0% for AGIs $50k-75k, 89.6% for AGIs $75k-100k, 66.3% for AGIs over 100k)
Taxable interest for individuals: $1,427 (reported on 34.3% of returns)
This zip code:
$1,427
Texas:
$2,255
(% of AGI for various income ranges: 9.2% for AGIs below $10k, 1.8% for AGIs $10k-25k, 1.1% for AGIs $25k-50k, 0.9% for AGIs $50k-75k, 0.8% for AGIs $75k-100k, 1.6% for AGIs over 100k)
Taxable dividends: $1,936 (reported on 14.3% of returns)
Here:
$1,936
State:
$4,261
(% of AGI for various income ranges: 2.2% for AGIs below $10k, 0.5% for AGIs $10k-25k, 0.6% for AGIs $25k-50k, 0.7% for AGIs $50k-75k, 0.2% for AGIs $75k-100k, 1.4% for AGIs over 100k)
Net capital gain/loss: +$3,720 (reported on 10.4% of returns)
Here:
+$3,720
State:
+$16,110
(% of AGI for various income ranges: 3.2% for AGIs below $10k, 0.3% for AGIs $10k-25k, 0.3% for AGIs $25k-50k, 0.3% for AGIs $50k-75k, 0.1% for AGIs $75k-100k, 3.7% for AGIs over 100k)
Profit/loss from business: +$4,126 (reported on 15.8% of returns)
Here:
+$4,126
State:
+$11,013
(% of AGI for various income ranges: -7.1% for AGIs below $10k, 3.5% for AGIs $10k-25k, 2.2% for AGIs $25k-50k, 0.4% for AGIs $50k-75k, -0.3% for AGIs $75k-100k, 4.1% for AGIs over 100k)
IRA payment deduction: $3,550 (reported on 1.7% of returns)
77665:
$3,550
Texas:
$3,120
(% of AGI for various income ranges: 0.5% for AGIs $10k-25k, 0.2% for AGIs $50k-75k, 0.4% for AGIs $75k-100k)
Total itemized deductions: $17,838 (26% of AGI, reported on 17.2% of returns)
Here:
$17,838
State:
$19,631
Here:
26.1% of AGI
State:
18.9% of AGI
(% of AGI for various income ranges: 5.8% for AGIs $10k-25k, 7.2% for AGIs $25k-50k, 8.8% for AGIs $50k-75k, 9.9% for AGIs $75k-100k, 9.8% for AGIs over 100k)
Charity contributions deductions: $3,813 (5% of AGI, reported on 13.3% of returns)
Here:
$3,813
State:
$4,753
Here:
5.3% of AGI
State:
4.2% of AGI
(% of AGI for various income ranges: 0.8% for AGIs $10k-25k, 1.1% for AGIs $25k-50k, 1.8% for AGIs $50k-75k, 1.7% for AGIs $75k-100k, 1.4% for AGIs over 100k)
Total tax: $4,677 (reported on 69.9% of returns)
77665:
$4,677
State:
$9,058
(% of AGI for various income ranges: 3.8% for AGIs below $10k, 3.5% for AGIs $10k-25k, 5.7% for AGIs $25k-50k, 8.0% for AGIs $50k-75k, 10.0% for AGIs $75k-100k, 16.0% for AGIs over 100k)
Earned income credit: $1,810 (reported on 20.9% of returns)
Here:
$1,810
State:
$2,024
Percentage of individuals using paid preparers for their 2004 taxes: 56.1%
Here:
56%
State:
57%
(% for various income ranges: 47.1% for AGIs below $10k, 53.0% for AGIs $10k-25k, 57.8% for AGIs $25k-50k, 59.9% for AGIs $50k-75k, 66.9% for AGIs $75k-100k, 73.5% for AGIs over 100k)
Household received Food Stamps/SNAP in the past 12 months: 93 Household did not receive Food Stamps/SNAP in the past 12 months: 2,074
Women who had a birth in the past 12 months: 58 (60 now married, 0 unmarried) Women who did not have a birth in the past 12 months: 1,324 (674 now married, 647 unmarried)
Housing units in zip code 77665 with a mortgage: 745 Median monthly owner costs for units with a mortgage: $1,826 Median monthly owner costs for units without a mortgage: $554
Residents with income below the poverty level in 2022:
This zip code:
19.9%
Whole state:
14.0%
Residents with income below 50% of the poverty level in 2022:
This zip code:
4.0%
Whole state:
7.4%
Median number of rooms in houses and condos:
Here:
5.8
State:
6.3
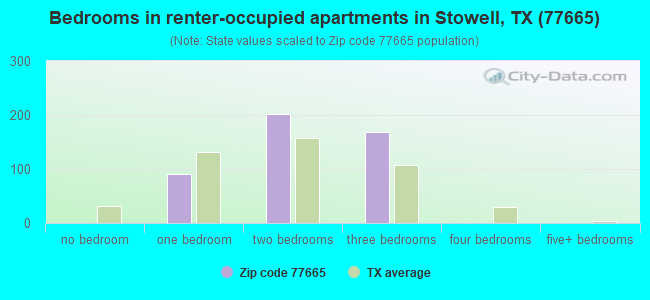
Median number of rooms in apartments:
Here:
5.0
State:
4.0
Notable locations in this zip code not listed on our city pages
In group quarters: 115 (-1 institutionalized population)
Size of family households: 598 2-persons, 217 3-persons, 344 4-persons, 352 5-persons, 135 6-persons, 73 7-or-more-persons
Size of nonfamily households: 417 1-person, 15 2-persons
1,147 married couples with children.
184 single-parent households (24 men, 160 women).
78.7% of residents of 77665 zip code speak English at home.
17.2% of residents speak Spanish at home (64% very well, 24% well, 13% not well).
2.0% of residents speak other Indo-European language at home (99% very well, 1% well).
1.8% of residents speak Asian or Pacific Island language at home (100% not well).
Foreign born population: 730 (10.8%) (27.0% of them are naturalized citizens)
This zip code:
10.8%
Whole state:
17.2%
80%Honduras
12%Indonesia
2%Bhutan
0%Zimbabwe
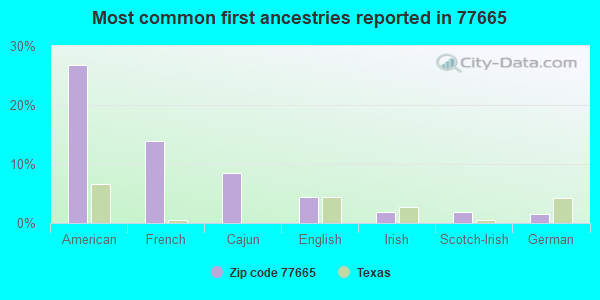
27%American
14%French
9%Cajun
4%English
2%Irish
2%Scotch-Irish
1%German
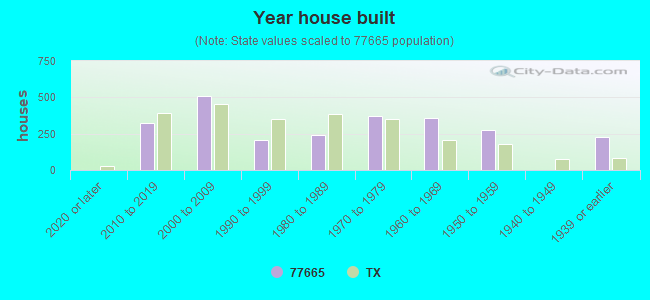
Year of entry for the foreign-born population
62010 or later
4242000 to 2009
491990 to 1999
248Before 1990
Housing units lacking complete plumbing facilities: 6.4% Housing units lacking complete kitchen facilities: 1.9%
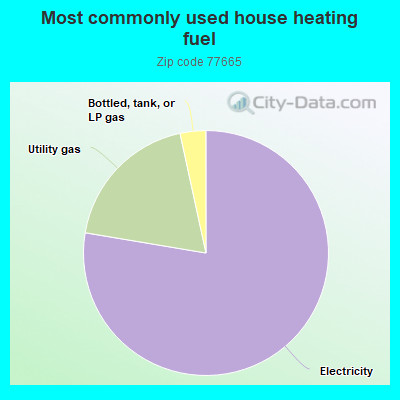
77.8%Electricity
19.0%Utility gas
3.4%Bottled, tank, or LP gas
Population in 1990: 2,716. Population change in the 1990s: +3,951 (+145.5%).
Place of birth for U.S.-born residents:
This state: 4,445
Northeast: 40
Midwest: 295
South: 814
West: 371
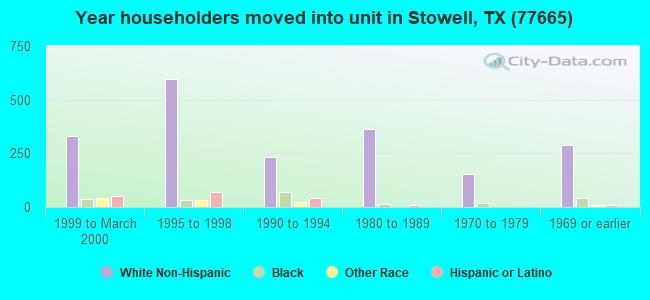
58% of the 77665 zip code residents lived in the same house 5 years ago. Out of people who lived in different houses, 54% lived in this county. Out of people who lived in different counties, 50% lived in Texas.
93% of the 77665 zip code residents lived in the same house 1 year ago. Out of people who lived in different houses, 16% moved from this county. Out of people who lived in different houses, 53% moved from different county within same state. Out of people who lived in different houses, 38% moved from different state.
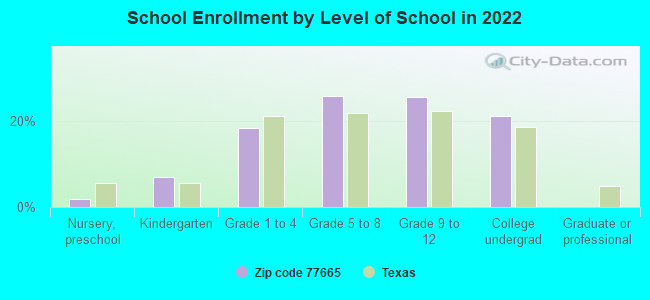
Private vs. public school enrollment:
Students in private schools in grades 1 to 8 (elementary and middle school): 84
Here:
11.9%
Texas:
8.8%
Students in private schools in grades 9 to 12 (high school): 19
Here:
4.7%
Texas:
8.0%
Students in private undergraduate colleges: 100
Here:
29.4%
Texas:
16.2%
Occupation by median earnings in the past 12 months ($)
96,095Sales and related occupations
65,915Business and financial operations occupations
63,931Installation, maintenance, and repair occupations
61,730Transportation occupations
46,953Architecture and engineering occupations
46,630Management occupations
Top industries in this zip code by the number of employees in 2005:


 Nearest zip codes: 77661, 77622, 77629, 77560, 77538, 77514.