Estimated zip code population in 2022: 17,053 Zip code population in 2010: 17,144 Zip code population in 2000: 16,795
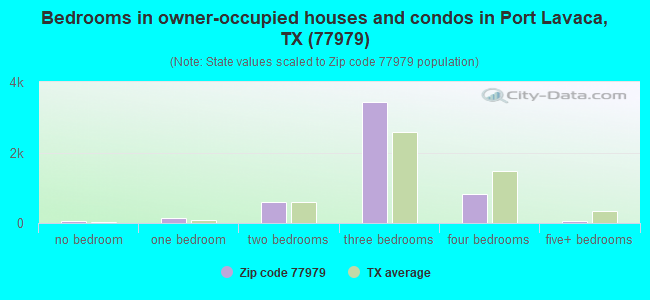
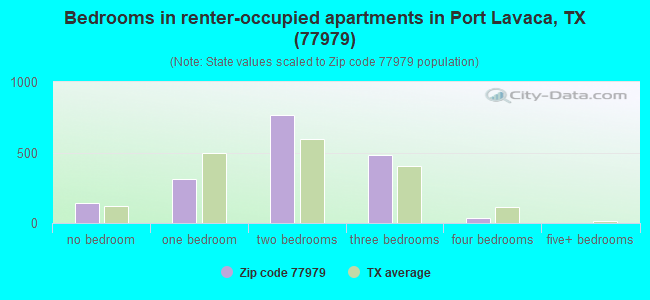
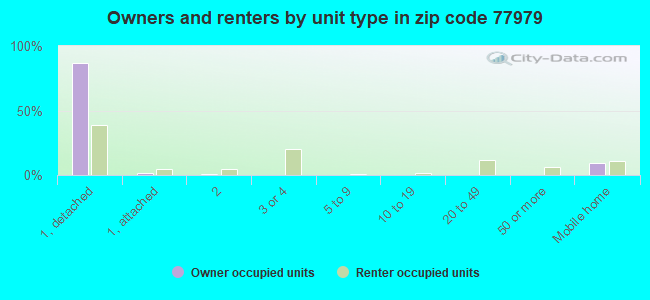
Houses and condos: 8,094 Renter-occupied apartments: 1,740
% of renters here:
25%
State:
38%
March 2022 cost of living index in zip code 77979: 81.1 (low, U.S. average is 100)
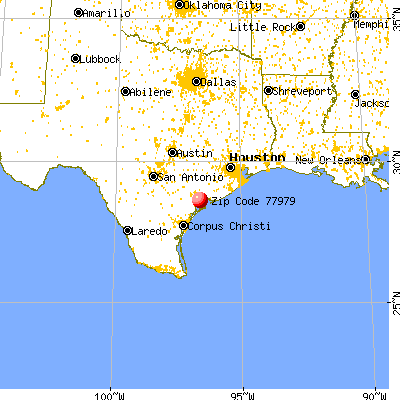
Land area: 341.0 sq. mi. Water area: 132.0 sq. mi.
Population density: 50 people per square mile
(very low).
OSM Map
General Map
Google Map
MSN Map
OSM Map
General Map
Google Map
MSN Map
OSM Map
General Map
Google Map
MSN Map
OSM Map
General Map
Google Map
MSN Map
Please wait while loading the map...
Real estate property taxes paid for housing units in 2022:
This zip code:
1.2% ($1,749)
Texas:
1.5% ($4,050)
Median real estate property taxes paid for housing units with mortgages in 2022: $2,319 (1.3%) Median real estate property taxes paid for housing units with no mortgage in 2022: $1,472 (1.1%)
Averages for the 2020 tax year for zip code 77979, filed in 2021:
Average Adjusted Gross Income (AGI) in 2020: $59,301 (Individual Income Tax Returns)
Here:
$59,301
State:
$77,054
Salary/wage: $54,378 (reported on 84.6% of returns)
Here:
$54,378
State:
$62,766
(% of AGI for various income ranges: 1251.1% for AGIs below $25k, 3665.8% for AGIs $25k-50k, 6539.3% for AGIs $50k-75k, 9344.1% for AGIs $75k-100k, 17090.1% for AGIs $100k-200k, 50087.5% for AGIs over 200k)
Taxable interest for individuals: $1,595 (reported on 21.1% of returns)
This zip code:
$1,595
Texas:
$2,665
(% of AGI for various income ranges: 10.8% for AGIs below $25k, 14.7% for AGIs $25k-50k, 27.7% for AGIs $50k-75k, 55.7% for AGIs $75k-100k, 110.0% for AGIs $100k-200k, 972.5% for AGIs over 200k)
Ordinary dividends: $5,692 (reported on 11.4% of returns)
Here:
$5,692
State:
$10,044
(% of AGI for various income ranges: 13.8% for AGIs below $25k, 21.3% for AGIs $25k-50k, 37.3% for AGIs $50k-75k, 77.8% for AGIs $75k-100k, 211.2% for AGIs $100k-200k, 2553.8% for AGIs over 200k)
Net capital gain/loss in AGI: +$14,776 (reported on 11.0% of returns)
Here:
+$14,776
State:
+$39,590
(% of AGI for various income ranges: 7.0% for AGIs below $25k, 8.2% for AGIs $25k-50k, 54.4% for AGIs $50k-75k, 133.1% for AGIs $75k-100k, 397.3% for AGIs $100k-200k, 9963.8% for AGIs over 200k)
Profit/loss from business: +$1,434 (reported on 17.4% of returns)
Here:
+$1,434
State:
+$10,888
(% of AGI for various income ranges: 67.9% for AGIs below $25k, 53.7% for AGIs $100k-200k, 2343.8% for AGIs over 200k)
Taxable individual retirement arrangement distribution: $19,857 (reported on 6.2% of returns)
77979:
$19,857
Texas:
$24,740
(% of AGI for various income ranges: 28.2% for AGIs below $25k, 66.2% for AGIs $25k-50k, 135.9% for AGIs $50k-75k, 317.5% for AGIs $75k-100k, 417.9% for AGIs $100k-200k, 2456.2% for AGIs over 200k)
Self-employed (Keogh) retirement plans: $27,050 (reported on 0.3% of returns)
77979:
$27,050
Texas:
$29,298
(% of AGI for various income ranges: 74.1% for AGIs $100k-200k)
Total itemized deductions: $35,706 (reported on 4.6% of returns)
Here:
$35,706
State:
$40,428
(% of AGI for various income ranges: 28.2% for AGIs below $25k, 94.5% for AGIs $25k-50k, 314.9% for AGIs $50k-75k, 376.9% for AGIs $75k-100k, 545.8% for AGIs $100k-200k, 2492.5% for AGIs over 200k)
Charity contributions: $15,108 (reported on 3.4% of returns)
Here:
$15,108
State:
$18,201
(% of AGI for various income ranges: 18.9% for AGIs $25k-50k, 76.7% for AGIs $50k-75k, 76.5% for AGIs $75k-100k, 217.1% for AGIs $100k-200k, 1295.0% for AGIs over 200k)
Taxes paid: $5,627 (reported on 4.0% of returns)
77979:
$5,627
State:
$7,821
(% of AGI for various income ranges: 9.5% for AGIs $25k-50k, 31.8% for AGIs $50k-75k, 53.1% for AGIs $75k-100k, 86.0% for AGIs $100k-200k, 480.0% for AGIs over 200k)
Earned income credit: $2,508 (reported on 22.3% of returns)
Here:
$2,508
State:
$2,584
(% of AGI for various income ranges: 140.2% for AGIs below $25k, 86.9% for AGIs $25k-50k, 2.2% for AGIs $50k-75k)
Percentage of individuals using paid preparers for their 2020 taxes: 93.1%
Here:
93%
State:
92%
(% for various income ranges: 92.1% for AGIs below $25k, 94.5% for AGIs $25k-50k, 91.5% for AGIs $50k-75k, 94.0% for AGIs $75k-100k, 94.5% for AGIs $100k-200k, 90.9% for AGIs over 200k)
Averages for the 2012 tax year for zip code 77979, filed in 2013:
Average Adjusted Gross Income (AGI) in 2012: $48,640 (Individual Income Tax Returns)
Here:
$48,640
State:
$65,384
Salary/wage: $42,836 (reported on 87.2% of returns)
Here:
$42,836
State:
$52,524
(% of AGI for various income ranges: 79.9% for AGIs below $25k, 84.4% for AGIs $25k-50k, 83.3% for AGIs $50k-75k, 81.3% for AGIs $75k-100k, 83.4% for AGIs $100k-200k, 40.7% for AGIs over 200k)
Taxable interest for individuals: $1,644 (reported on 22.5% of returns)
This zip code:
$1,644
Texas:
$2,372
(% of AGI for various income ranges: 0.8% for AGIs below $25k, 0.6% for AGIs $25k-50k, 0.6% for AGIs $50k-75k, 0.7% for AGIs $75k-100k, 0.9% for AGIs $100k-200k, 1.0% for AGIs over 200k)
Ordinary dividends: $5,161 (reported on 11.4% of returns)
Here:
$5,161
State:
$9,721
(% of AGI for various income ranges: 0.9% for AGIs below $25k, 0.5% for AGIs $25k-50k, 0.7% for AGIs $50k-75k, 0.6% for AGIs $75k-100k, 0.9% for AGIs $100k-200k, 4.1% for AGIs over 200k)
Net capital gain/loss in AGI: +$7,735 (reported on 9.3% of returns)
Here:
+$7,735
State:
+$35,319
(% of AGI for various income ranges: 0.2% for AGIs $25k-50k, 0.1% for AGIs $50k-75k, 0.7% for AGIs $75k-100k, 0.8% for AGIs $100k-200k, 7.9% for AGIs over 200k)
Profit/loss from business: +$8,628 (reported on 13.4% of returns)
Here:
+$8,628
State:
+$13,732
(% of AGI for various income ranges: 7.4% for AGIs below $25k, 1.7% for AGIs $25k-50k, 0.8% for AGIs $50k-75k, 1.2% for AGIs $75k-100k, 2.1% for AGIs $100k-200k, 2.9% for AGIs over 200k)
Taxable individual retirement arrangement distribution: $11,746 (reported on 7.5% of returns)
77979:
$11,746
Texas:
$19,511
(% of AGI for various income ranges: 1.9% for AGIs below $25k, 1.8% for AGIs $25k-50k, 2.3% for AGIs $50k-75k, 2.4% for AGIs $75k-100k, 2.1% for AGIs $100k-200k)
Self-employment retirement plans: $20,850 (reported on 0.3% of returns)
77979:
$20,850
Texas:
$23,938
(% of AGI for various income ranges: 0.7% for AGIs $50k-75k)
Total itemized deductions: $21,705 (19% of AGI, reported on 11.4% of returns)
Here:
$21,705
State:
$24,724
Here:
19.2% of AGI
State:
15.9% of AGI
(% of AGI for various income ranges: 4.3% for AGIs below $25k, 5.3% for AGIs $25k-50k, 4.4% for AGIs $50k-75k, 4.6% for AGIs $75k-100k, 5.3% for AGIs $100k-200k, 6.5% for AGIs over 200k)
Charity contributions: $5,804 (reported on 7.5% of returns)
Here:
$5,804
State:
$6,808
(% of AGI for various income ranges: 0.3% for AGIs below $25k, 0.6% for AGIs $25k-50k, 0.6% for AGIs $50k-75k, 0.6% for AGIs $75k-100k, 1.4% for AGIs $100k-200k, 1.4% for AGIs over 200k)
Taxes paid: $4,379 (reported on 11.1% of returns)
77979:
$4,379
State:
$6,921
(% of AGI for various income ranges: 0.5% for AGIs below $25k, 0.8% for AGIs $25k-50k, 0.8% for AGIs $50k-75k, 0.9% for AGIs $75k-100k, 1.4% for AGIs $100k-200k, 1.2% for AGIs over 200k)
Earned income credit: $2,356 (reported on 25.4% of returns)
Here:
$2,356
State:
$2,570
(% of AGI for various income ranges: 8.8% for AGIs below $25k, 1.6% for AGIs $25k-50k)
Percentage of individuals using paid preparers for their 2012 taxes: 62.0%
Here:
62%
State:
51%
(% for various income ranges: 60.7% for AGIs below $25k, 60.9% for AGIs $25k-50k, 60.0% for AGIs $50k-75k, 67.2% for AGIs $75k-100k, 66.7% for AGIs $100k-200k, 75.0% for AGIs over 200k)
Averages for the 2004 tax year for zip code 77979, filed in 2005:
Average Adjusted Gross Income (AGI) in 2004: $38,063 (Individual Income Tax Returns)
Here:
$38,063
State:
$47,881
Salary/wage: $33,469 (reported on 83.7% of returns)
Here:
$33,469
State:
$41,947
(% of AGI for various income ranges: 138.2% for AGIs below $10k, 78.0% for AGIs $10k-25k, 80.3% for AGIs $25k-50k, 80.3% for AGIs $50k-75k, 80.2% for AGIs $75k-100k, 51.0% for AGIs over 100k)
Taxable interest for individuals: $1,914 (reported on 32.6% of returns)
This zip code:
$1,914
Texas:
$2,255
(% of AGI for various income ranges: 7.5% for AGIs below $10k, 2.0% for AGIs $10k-25k, 1.5% for AGIs $25k-50k, 1.1% for AGIs $50k-75k, 1.5% for AGIs $75k-100k, 1.7% for AGIs over 100k)
Taxable dividends: $1,936 (reported on 14.3% of returns)
Here:
$1,936
State:
$4,261
(% of AGI for various income ranges: 1.7% for AGIs below $10k, 0.6% for AGIs $10k-25k, 0.6% for AGIs $25k-50k, 0.4% for AGIs $50k-75k, 0.7% for AGIs $75k-100k, 1.1% for AGIs over 100k)
Net capital gain/loss: +$4,332 (reported on 11.6% of returns)
Here:
+$4,332
State:
+$16,110
(% of AGI for various income ranges: -1.7% for AGIs below $10k, 0.3% for AGIs $10k-25k, 0.5% for AGIs $25k-50k, 0.9% for AGIs $50k-75k, 0.8% for AGIs $75k-100k, 3.4% for AGIs over 100k)
Profit/loss from business: +$6,812 (reported on 13.1% of returns)
Here:
+$6,812
State:
+$11,013
(% of AGI for various income ranges: -21.2% for AGIs below $10k, 4.3% for AGIs $10k-25k, 1.1% for AGIs $25k-50k, 1.6% for AGIs $50k-75k, 1.7% for AGIs $75k-100k, 5.3% for AGIs over 100k)
IRA payment deduction: $3,328 (reported on 1.8% of returns)
77979:
$3,328
Texas:
$3,120
(% of AGI for various income ranges: 0.2% for AGIs $10k-25k, 0.2% for AGIs $25k-50k, 0.1% for AGIs $50k-75k, 0.2% for AGIs $75k-100k, 0.1% for AGIs over 100k)
Self-employed pension: $13,172 (reported on 0.4% of returns)
Here:
$13,172
Texas:
$16,401
Total itemized deductions: $16,818 (18% of AGI, reported on 10.4% of returns)
Here:
$16,818
State:
$19,631
Here:
17.7% of AGI
State:
18.9% of AGI
(% of AGI for various income ranges: 10.8% for AGIs below $10k, 3.2% for AGIs $10k-25k, 4.1% for AGIs $25k-50k, 4.7% for AGIs $50k-75k, 5.4% for AGIs $75k-100k, 4.6% for AGIs over 100k)
Charity contributions deductions: $4,553 (4% of AGI, reported on 8.0% of returns)
Here:
$4,553
State:
$4,753
Here:
4.4% of AGI
State:
4.2% of AGI
(% of AGI for various income ranges: 0.6% for AGIs below $10k, 0.4% for AGIs $10k-25k, 0.6% for AGIs $25k-50k, 0.9% for AGIs $50k-75k, 1.2% for AGIs $75k-100k, 1.4% for AGIs over 100k)
Total tax: $6,365 (reported on 66.3% of returns)
77979:
$6,365
State:
$9,058
(% of AGI for various income ranges: 4.6% for AGIs below $10k, 3.0% for AGIs $10k-25k, 6.1% for AGIs $25k-50k, 9.1% for AGIs $50k-75k, 11.3% for AGIs $75k-100k, 21.3% for AGIs over 100k)
Earned income credit: $1,980 (reported on 27.3% of returns)
Here:
$1,980
State:
$2,024
Percentage of individuals using paid preparers for their 2004 taxes: 64.4%
Here:
64%
State:
57%
(% for various income ranges: 58.8% for AGIs below $10k, 66.9% for AGIs $10k-25k, 66.7% for AGIs $25k-50k, 64.9% for AGIs $50k-75k, 65.8% for AGIs $75k-100k, 61.5% for AGIs over 100k)
Likely homosexual households (counted as self-reported same-sex unmarried-partner households)
Lesbian couples: 0.7% of all households
Gay men: 0.0% of all households
Household received Food Stamps/SNAP in the past 12 months: 1,217 Household did not receive Food Stamps/SNAP in the past 12 months: 5,679
Women who had a birth in the past 12 months: 177 (142 now married, 36 unmarried) Women who did not have a birth in the past 12 months: 3,577 (1,613 now married, 1,963 unmarried)
Housing units in zip code 77979 with a mortgage: 1,864 (19 second mortgage, 13 both second mortgage and home equity loan) Houses without a mortgage: 5
Median monthly owner costs for units with a mortgage: $1,472 Median monthly owner costs for units without a mortgage: $474
Residents with income below the poverty level in 2022:
This zip code:
9.8%
Whole state:
14.0%
Residents with income below 50% of the poverty level in 2022:
This zip code:
5.9%
Whole state:
7.4%
Median number of rooms in houses and condos:
Here:
5.9
State:
6.3
Median number of rooms in apartments:
Here:
4.5
State:
4.0
Notable locations in this zip code not listed on our city pages
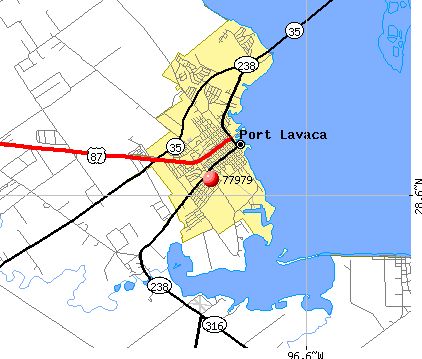
Notable locations in zip code 77979: Indianola Fishing Center Marina (A), Lavaca Causeway Marina (B), Nautical Landing Marina (C), Port Alto Boat Shed Marina (D), S and S Marina (E), At Last Marina (F), Alamo Beach (G), Port Lavaca Fire Department Station 1 (H), Port Lavaca Fire Department Station 2 (I), Port Lavaca Fire Marshal's Office (J), Calhoun County Sheriff's Office (K), Port Lavaca Police Department (L), Calhoun County Courthouse (M), Calhoun County Museum (N), Magnolia Beach Volunteer Fire Department (O), Olivia - Port Alto Volunteer Fire Department / Emergency Medical Service (P), Calhoun County Emergency Medical Service (Q), A C Louwien Bakery (R). Display/hide their locations on the map
Churches in zip code 77979 include: Olivia Eden Church (A), Christ Community Church (B), First Presbyterian Church (C), Episcopal Church Grace Parish (D), Our Lady of the Gulf Catholic Church (E), Second Baptist Church (F), Saint Joseph Baptist Church (G), Parkway by the Bay Baptist Church (H), First Baptist Church (I). Display/hide their locations on the map
Cemeteries: Indianola Cemetery (1), Clark Family Cemetery (2), Port Lavaca Cemetery (3), Ranger Cemetery (4), Hatch Cemetery (5), Old Town Cemetery (6), Six Mile Cemetery (7). Display/hide their locations on the map
Lakes and reservoirs: Salt Lake (A), Redfish Lake (B), Blind Bayou (C), Swan Lake (D), Old Town Lake (E), Jones Bayou (F), Mud Lake (G), Operating Basin Number 31 (H). Display/hide their locations on the map
Streams, rivers, and creeks: Black Bayou (A), Agula Creek (B), Middle Sandy Creek (C), Keller Creek (D), Chocolate Bayou (E), Sixmile Creek (F), East Coloma Creek (G), West Coloma Creek (H), Placedo Creek (I). Display/hide their locations on the map
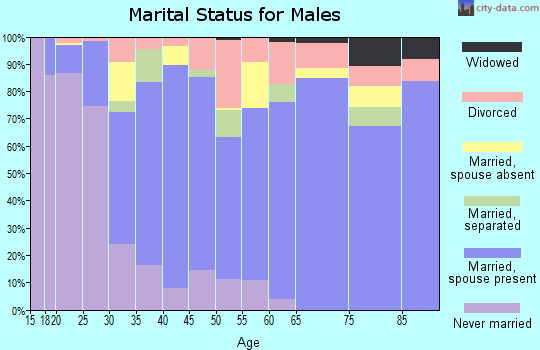
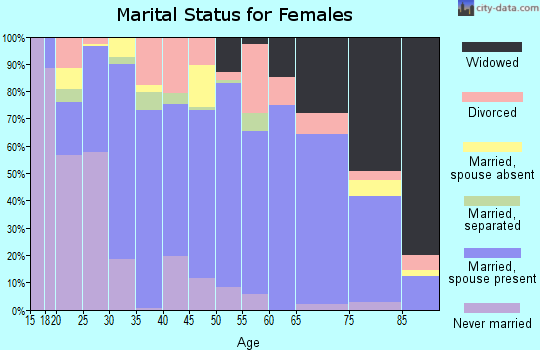
1,872 married couples with children.
981 single-parent households (112 men, 869 women).
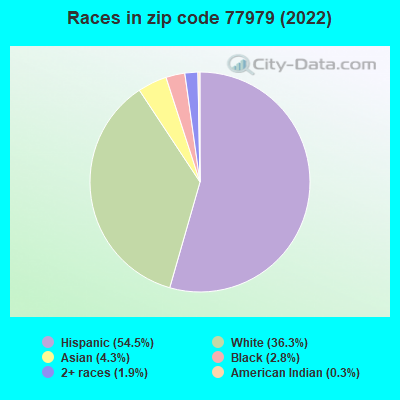
69.6% of residents of 77979 zip code speak English at home.
25.9% of residents speak Spanish at home (71% very well, 14% well, 8% not well, 7% not at all).
0.3% of residents speak other Indo-European language at home (100% very well).
4.3% of residents speak Asian or Pacific Island language at home (43% very well, 44% well, 7% not well, 5% not at all).
0.1% of residents speak other language at home (100% very well).
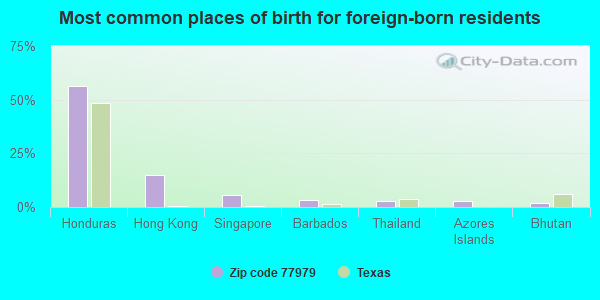
Foreign born population: 1,906 (11.2%) (53.4% of them are naturalized citizens)
This zip code:
11.2%
Whole state:
17.2%
56%Honduras
15%Hong Kong
6%Singapore
3%Barbados
3%Thailand
3%Azores Islands
2%Bhutan
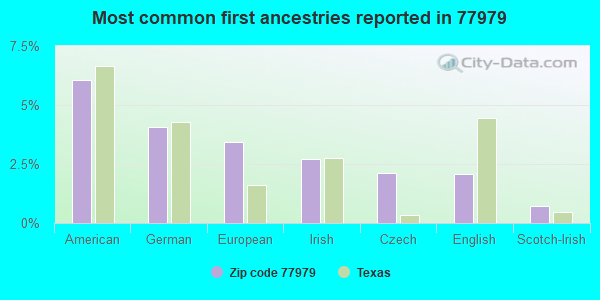
6%American
4%German
3%European
3%Irish
2%Czech
2%English
1%Scotch-Irish
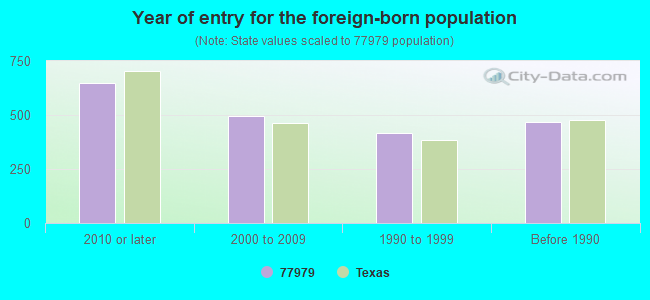
Year of entry for the foreign-born population
6472010 or later
4972000 to 2009
4171990 to 1999
468Before 1990
Facilities with environmental interests located in this zip code:
ABB RANDALL CORPORATION (619 BAYVIEW DRIVE in PORT LAVACA, TX)
(Resource Conservation and Recovery Act (tracking hazardous waste))
AUTO PARTS & MACHINE CO INC (1200 W MAIN ST in PORT LAVACA, TX)
(Resource Conservation and Recovery Act (tracking hazardous waste))
Housing units lacking complete plumbing facilities: 0.9% Housing units lacking complete kitchen facilities: 5.6%
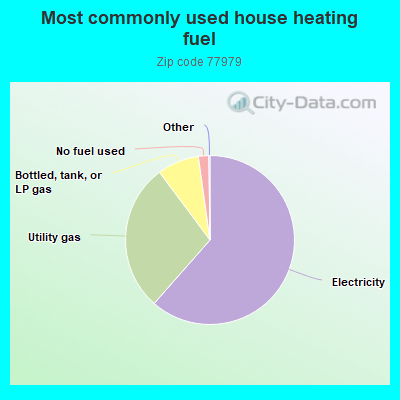
61.5%Electricity
28.3%Utility gas
8.0%Bottled, tank, or LP gas
2.0%No fuel used
Population in 1990: 15,627. Population change in the 1990s: +1,168 (+7.5%).
Place of birth for U.S.-born residents:
This state: 13,377
Northeast: 150
Midwest: 305
South: 554
West: 496
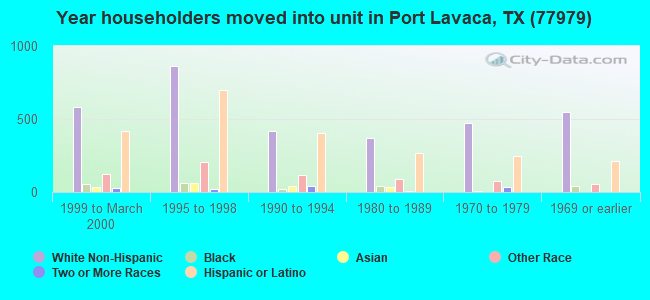
61% of the 77979 zip code residents lived in the same house 5 years ago. Out of people who lived in different houses, 66% lived in this county. Out of people who lived in different counties, 50% lived in Texas.
92% of the 77979 zip code residents lived in the same house 1 year ago. Out of people who lived in different houses, 47% moved from this county. Out of people who lived in different houses, 38% moved from different county within same state. Out of people who lived in different houses, 15% moved from different state. Out of people who lived in different houses, 2% moved from abroad.
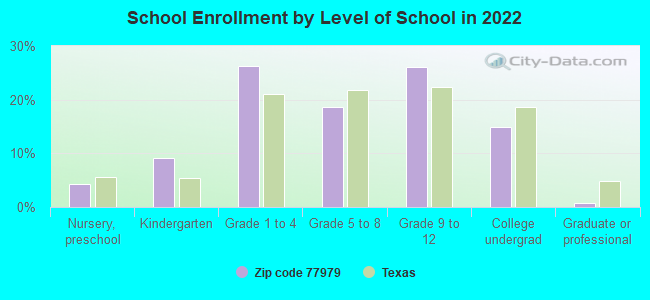
Private vs. public school enrollment:
Students in private schools in grades 1 to 8 (elementary and middle school): 176
Here:
10.2%
Texas:
8.8%
Students in private schools in grades 9 to 12 (high school): 86
Here:
8.6%
Texas:
8.0%
Students in private undergraduate colleges: 46
Here:
8.1%
Texas:
16.2%
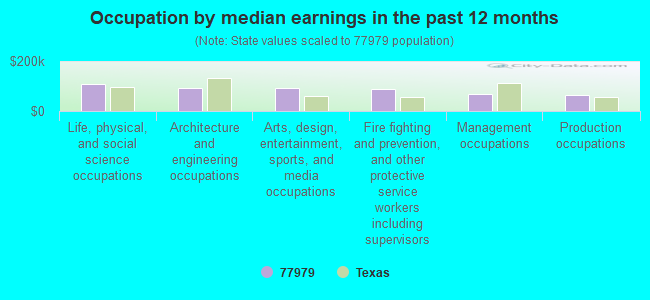
Occupation by median earnings in the past 12 months ($)
108,744Life, physical, and social science occupations
92,828Architecture and engineering occupations
91,947Arts, design, entertainment, sports, and media occupations
86,632Fire fighting and prevention, and other protective service workers including supervisors
68,587Management occupations
65,455Production occupations
Companies with federal contracts located in this zip code:
KING FISHER, MARINE SERVICE, L (159 HWY 316 in PORT LAVACA, TX) : $171,286,159 in 293 contractsfrom 1999 to 2006
Contracts for Maintenance, Repair or Alteration of Real Property -- Dredging, Construction of Structures and Facilities -- Dredging, Maintenance, Repair or Alteration of Real Property -- Other Conservation and Development Facilities, Maintenance, Repair or Alteration of Real Property -- Surface Mine Reclamation Facilities, and moreby Army, U.S. Army Corps of Engineers - civil program financing only Signed by year:2000: $10,012,269; 2001: $19,217,925; 2002: $25,532,876; 2003: $17,179,984; 2004: $25,029,182; 2005: $45,937,975; 2006: $24,589,577.
Biggest contracts:
$9,677,610 with Army for Maintenance, Repair or Alteration of Real Property -- Dredging. Signed on 2006-01-25. Completion date: 2006-09-30.
$7,250,000 with U.S. Army Corps of Engineers - civil program financing only for Maintenance, Repair or Alteration of Real Property -- Dredging. Signed on 2002-11-04. Completion date: 2003-05-16.
$5,000,000 with Army for Maintenance, Repair or Alteration of Real Property -- Dredging. Signed on 2005-10-18. Completion date: 2006-09-30.
$4,950,000, same as above.Signed on 2005-03-16. Completion date: 2005-08-30.
T W LAQUAY DREDGING, INC (619 BAYVIEW DR in PORT LAVACA, TX; small business) : $74,178,545 in 139 contractsfrom 2001 to 2006
Contracts for Maintenance, Repair or Alteration of Real Property -- Other Conservation and Development Facilities, Maintenance, Repair or Alteration of Real Property -- Dredging, Maintenance, Repair or Alteration of Real Property -- Dams by Army, U.S. Army Corps of Engineers - civil program financing only Signed by year:2000: $0; 2001: $1,540,200; 2002: $7,314,523; 2003: $9,011,248; 2004: $19,049,294; 2005: $35,911,374; 2006: $1,351,906.
Biggest contracts:
$4,811,966 with Army for Maintenance, Repair or Alteration of Real Property -- Other Conservation and Development Facilities. Signed on 2005-03-01. Completion date: 2004-09-30.
$4,811,966 with U.S. Army Corps of Engineers - civil program financing only for Maintenance, Repair or Alteration of Real Property -- Other Conservation and Development Facilities. Signed on 2005-03-01. Completion date: 2004-09-30.
$4,127,390 with Army for Maintenance, Repair or Alteration of Real Property -- Dredging. Signed on 2005-12-29. Completion date: 2006-09-30.
$3,337,500, same as above.Signed on 2005-12-29. Completion date: 2006-02-28.
RLB CONTRACTING INC (410 BROADWAY ST in PORT LAVACA, TX; small business) : $15,599,797 in 26 contractsfrom 2003 to 2006
Contracts for Maintenance, Repair or Alteration of Real Property -- Dredging, Maintenance, Repair or Alteration of Real Property -- Other Conservation and Development Facilities, Construction of Structures and Facilities -- Other Conservation and Development Facilities, Construction of Structures and Facilities -- Dredging by Army, U.S. Army Corps of Engineers - civil program financing only Signed by year:2000: $0; 2001: $0; 2002: $0; 2003: $5,666,506; 2004: $2,810,307; 2005: $461,792; 2006: $6,661,192.
Biggest contracts:
$4,969,942 with Army for Maintenance, Repair or Alteration of Real Property -- Dredging. Signed on 2006-02-17. Completion date: 2005-06-22.
$1,691,250, same as above.Signed on 2006-05-17. Completion date: 2006-09-30.
$1,527,120 with U.S. Army Corps of Engineers - civil program financing only for Maintenance, Repair or Alteration of Real Property -- Other Conservation and Development Facilities. Signed on 2003-04-18. Completion date: 2003-12-31.
$1,280,000, same as above.Signed on 2003-10-01. Completion date: 2003-12-31.
Top industries in this zip code by the number of employees in 2005:
Construction: Other Heavy and Civil Engineering Construction (250-499 employees: 1 establishment, 50-99 employees: 1 establishment, 10-19 employees: 1 establishment, 1-4 employees: 2 establishments)
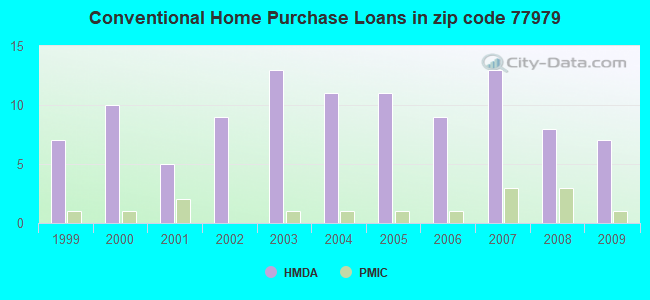
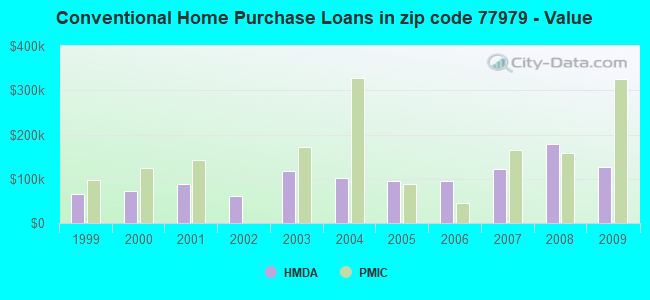
Detailed PMIC statistics for the following Tracts:0008.00
2002 - 2016 National Fire Incident Reporting System (NFIRS) incidents
Based on the data from the years 2002 - 2016 the average number of fire incidents per year is 69. The highest number of fire incidents - 128 took place in 2011, and the least - 2 in 2014. The data has an increasing trend.
When looking into fire subcategories, the most incidents belonged to: Outside Fires (61.1%), and Structure Fires (21.3%).
Fire incident types reported to NFIRS in Zip Code 77979


 Nearest zip codes: 77978, 77969, 77983, 77991, 77982, 77977.


 Based on the data from the years 2002 - 2016 the average number of fire incidents per year is 69. The highest number of fire incidents - 128 took place in 2011, and the least - 2 in 2014. The data has an increasing trend.
 When looking into fire subcategories, the most incidents belonged to: Outside Fires (61.1%), and Structure Fires (21.3%).