Estimated zip code population in 2022: 5,405 Zip code population in 2010: 4,956 Zip code population in 2000: 5,035
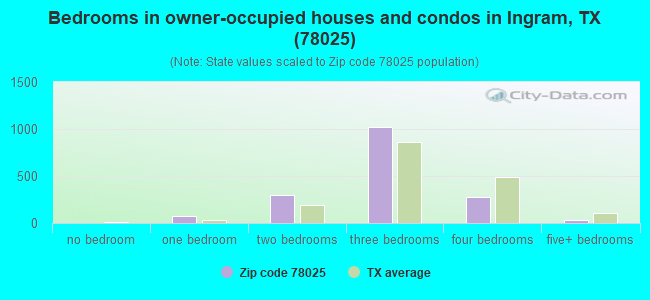
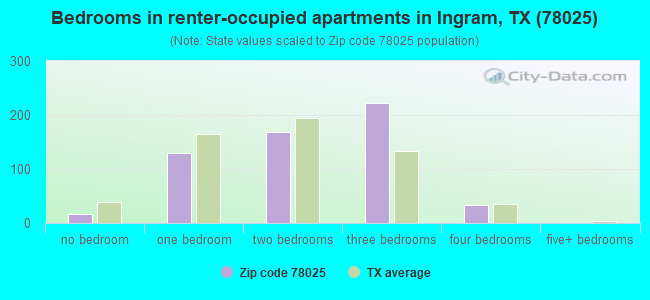
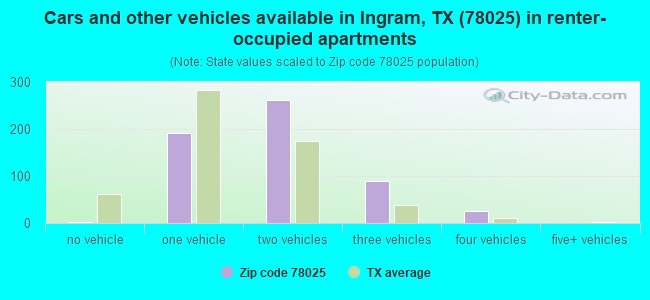
Houses and condos: 2,818 Renter-occupied apartments: 578
% of renters here:
25%
State:
38%
March 2022 cost of living index in zip code 78025: 80.7 (low, U.S. average is 100)
Land area: 43.9 sq. mi. Water area: 0.4 sq. mi.
Population density: 123 people per square mile
(very low).
OSM Map
General Map
Google Map
MSN Map
OSM Map
General Map
Google Map
MSN Map
OSM Map
General Map
Google Map
MSN Map
OSM Map
General Map
Google Map
MSN Map
Please wait while loading the map...
Real estate property taxes paid for housing units in 2022:
This zip code:
1.1% ($2,572)
Texas:
1.5% ($4,050)
Median real estate property taxes paid for housing units with mortgages in 2022: $2,947 (1.2%) Median real estate property taxes paid for housing units with no mortgage in 2022: $2,086 (0.9%)
Averages for the 2020 tax year for zip code 78025, filed in 2021:
Average Adjusted Gross Income (AGI) in 2020: $66,340 (Individual Income Tax Returns)
Here:
$66,340
State:
$77,054
Salary/wage: $40,811 (reported on 70.4% of returns)
Here:
$40,811
State:
$62,766
(% of AGI for various income ranges: 1125.4% for AGIs below $25k, 3438.1% for AGIs $25k-50k, 6225.5% for AGIs $50k-75k, 7840.8% for AGIs $75k-100k, 13301.8% for AGIs $100k-200k, 50115.0% for AGIs over 200k)
Taxable interest for individuals: $3,344 (reported on 28.0% of returns)
This zip code:
$3,344
Texas:
$2,665
(% of AGI for various income ranges: 22.2% for AGIs below $25k, 27.2% for AGIs $25k-50k, 86.0% for AGIs $50k-75k, 134.2% for AGIs $75k-100k, 540.0% for AGIs $100k-200k, 5650.0% for AGIs over 200k)
Ordinary dividends: $11,649 (reported on 18.0% of returns)
Here:
$11,649
State:
$10,044
(% of AGI for various income ranges: 33.2% for AGIs below $25k, 45.1% for AGIs $25k-50k, 196.5% for AGIs $50k-75k, 304.2% for AGIs $75k-100k, 1225.5% for AGIs $100k-200k, 13440.0% for AGIs over 200k)
Net capital gain/loss in AGI: +$53,264 (reported on 17.6% of returns)
Here:
+$53,264
State:
+$39,590
(% of AGI for various income ranges: 16.2% for AGIs below $25k, 44.3% for AGIs $25k-50k, 115.5% for AGIs $50k-75k, 107.5% for AGIs $75k-100k, 1321.8% for AGIs $100k-200k, 106425.0% for AGIs over 200k)
Profit/loss from business: +$19,579 (reported on 24.8% of returns)
Here:
+$19,579
State:
+$10,888
(% of AGI for various income ranges: 319.0% for AGIs below $25k, 294.0% for AGIs $25k-50k, 426.5% for AGIs $50k-75k, 833.3% for AGIs $75k-100k, 1741.8% for AGIs $100k-200k, 24010.0% for AGIs over 200k)
Taxable individual retirement arrangement distribution: $27,954 (reported on 10.4% of returns)
78025:
$27,954
Texas:
$24,740
(% of AGI for various income ranges: 48.4% for AGIs below $25k, 118.3% for AGIs $25k-50k, 344.5% for AGIs $50k-75k, 552.5% for AGIs $75k-100k, 4530.9% for AGIs $100k-200k)
Total itemized deductions: $40,143 (reported on 5.6% of returns)
Here:
$40,143
State:
$40,428
(% of AGI for various income ranges: 94.8% for AGIs below $25k, 611.0% for AGIs $50k-75k, 1210.9% for AGIs $100k-200k, 12345.0% for AGIs over 200k)
Charity contributions: $22,636 (reported on 4.4% of returns)
Here:
$22,636
State:
$18,201
(% of AGI for various income ranges: 181.5% for AGIs $50k-75k, 414.5% for AGIs $100k-200k, 8355.0% for AGIs over 200k)
Taxes paid: $6,314 (reported on 5.6% of returns)
78025:
$6,314
State:
$7,821
(% of AGI for various income ranges: 18.9% for AGIs below $25k, 95.5% for AGIs $50k-75k, 230.9% for AGIs $100k-200k, 1600.0% for AGIs over 200k)
Earned income credit: $2,440 (reported on 20.8% of returns)
Here:
$2,440
State:
$2,584
(% of AGI for various income ranges: 129.5% for AGIs below $25k, 85.5% for AGIs $25k-50k)
Percentage of individuals using paid preparers for their 2020 taxes: 90.8%
Here:
91%
State:
92%
(% for various income ranges: 89.4% for AGIs below $25k, 91.5% for AGIs $25k-50k, 93.8% for AGIs $50k-75k, 90.0% for AGIs $75k-100k, 91.3% for AGIs $100k-200k, 90.0% for AGIs over 200k)
Averages for the 2012 tax year for zip code 78025, filed in 2013:
Average Adjusted Gross Income (AGI) in 2012: $52,155 (Individual Income Tax Returns)
Here:
$52,155
State:
$65,384
Salary/wage: $32,185 (reported on 71.1% of returns)
Here:
$32,185
State:
$52,524
(% of AGI for various income ranges: 65.2% for AGIs below $25k, 69.9% for AGIs $25k-50k, 63.3% for AGIs $50k-75k, 48.6% for AGIs $75k-100k, 43.9% for AGIs $100k-200k, 10.1% for AGIs over 200k)
Taxable interest for individuals: $3,493 (reported on 30.7% of returns)
This zip code:
$3,493
Texas:
$2,372
(% of AGI for various income ranges: 1.3% for AGIs below $25k, 1.0% for AGIs $25k-50k, 1.8% for AGIs $50k-75k, 2.1% for AGIs $75k-100k, 2.6% for AGIs $100k-200k, 2.8% for AGIs over 200k)
Ordinary dividends: $10,048 (reported on 18.4% of returns)
Here:
$10,048
State:
$9,721
(% of AGI for various income ranges: 1.7% for AGIs below $25k, 1.4% for AGIs $25k-50k, 2.1% for AGIs $50k-75k, 2.6% for AGIs $75k-100k, 3.2% for AGIs $100k-200k, 6.7% for AGIs over 200k)
Net capital gain/loss in AGI: +$21,957 (reported on 16.2% of returns)
Here:
+$21,957
State:
+$35,319
(% of AGI for various income ranges: 0.4% for AGIs $25k-50k, 3.1% for AGIs $75k-100k, 4.4% for AGIs $100k-200k, 18.9% for AGIs over 200k)
Profit/loss from business: +$18,569 (reported on 24.1% of returns)
Here:
+$18,569
State:
+$13,732
(% of AGI for various income ranges: 16.1% for AGIs below $25k, 6.3% for AGIs $25k-50k, 4.5% for AGIs $50k-75k, 7.3% for AGIs $75k-100k, 26.4% for AGIs $100k-200k)
Taxable individual retirement arrangement distribution: $16,173 (reported on 13.2% of returns)
78025:
$16,173
Texas:
$19,511
(% of AGI for various income ranges: 4.5% for AGIs below $25k, 3.4% for AGIs $25k-50k, 3.3% for AGIs $50k-75k, 6.1% for AGIs $75k-100k, 11.6% for AGIs $100k-200k)
Total itemized deductions: $25,669 (17% of AGI, reported on 17.1% of returns)
Here:
$25,669
State:
$24,724
Here:
17.5% of AGI
State:
15.9% of AGI
(% of AGI for various income ranges: 7.0% for AGIs below $25k, 6.2% for AGIs $25k-50k, 7.9% for AGIs $50k-75k, 9.8% for AGIs $75k-100k, 11.3% for AGIs $100k-200k, 8.4% for AGIs over 200k)
Charity contributions: $7,997 (reported on 13.2% of returns)
Here:
$7,997
State:
$6,808
(% of AGI for various income ranges: 0.9% for AGIs below $25k, 1.0% for AGIs $25k-50k, 1.3% for AGIs $50k-75k, 2.0% for AGIs $75k-100k, 2.0% for AGIs $100k-200k, 3.4% for AGIs over 200k)
Taxes paid: $6,031 (reported on 17.1% of returns)
78025:
$6,031
State:
$6,921
(% of AGI for various income ranges: 1.1% for AGIs below $25k, 1.4% for AGIs $25k-50k, 1.6% for AGIs $50k-75k, 3.0% for AGIs $75k-100k, 3.5% for AGIs $100k-200k, 1.6% for AGIs over 200k)
Earned income credit: $2,361 (reported on 25.0% of returns)
Here:
$2,361
State:
$2,570
(% of AGI for various income ranges: 7.7% for AGIs below $25k, 1.5% for AGIs $25k-50k)
Percentage of individuals using paid preparers for their 2012 taxes: 53.5%
Here:
54%
State:
51%
(% for various income ranges: 50.9% for AGIs below $25k, 49.2% for AGIs $25k-50k, 53.8% for AGIs $50k-75k, 62.5% for AGIs $75k-100k, 71.4% for AGIs $100k-200k, 80.0% for AGIs over 200k)
Averages for the 2004 tax year for zip code 78025, filed in 2005:
Average Adjusted Gross Income (AGI) in 2004: $38,679 (Individual Income Tax Returns)
Here:
$38,679
State:
$47,881
Salary/wage: $26,335 (reported on 73.8% of returns)
Here:
$26,335
State:
$41,947
(% of AGI for various income ranges: 92.5% for AGIs below $10k, 70.1% for AGIs $10k-25k, 71.9% for AGIs $25k-50k, 62.9% for AGIs $50k-75k, 42.5% for AGIs $75k-100k, 19.9% for AGIs over 100k)
Taxable interest for individuals: $3,374 (reported on 37.1% of returns)
This zip code:
$3,374
Texas:
$2,255
(% of AGI for various income ranges: 5.3% for AGIs below $10k, 2.5% for AGIs $10k-25k, 2.2% for AGIs $25k-50k, 1.8% for AGIs $50k-75k, 3.9% for AGIs $75k-100k, 4.6% for AGIs over 100k)
Taxable dividends: $5,170 (reported on 20.9% of returns)
Here:
$5,170
State:
$4,261
(% of AGI for various income ranges: 6.2% for AGIs below $10k, 1.3% for AGIs $10k-25k, 1.8% for AGIs $25k-50k, 1.5% for AGIs $50k-75k, 4.2% for AGIs $75k-100k, 4.2% for AGIs over 100k)
Net capital gain/loss: +$12,364 (reported on 20.0% of returns)
Here:
+$12,364
State:
+$16,110
(% of AGI for various income ranges: -4.4% for AGIs below $10k, 0.7% for AGIs $10k-25k, 0.4% for AGIs $25k-50k, 1.8% for AGIs $50k-75k, 3.1% for AGIs $75k-100k, 16.7% for AGIs over 100k)
Profit/loss from business: +$8,507 (reported on 22.7% of returns)
Here:
+$8,507
State:
+$11,013
(% of AGI for various income ranges: 10.3% for AGIs below $10k, 10.3% for AGIs $10k-25k, 5.1% for AGIs $25k-50k, 6.5% for AGIs $50k-75k, 4.1% for AGIs $75k-100k, 1.9% for AGIs over 100k)
IRA payment deduction: $3,403 (reported on 2.6% of returns)
78025:
$3,403
Texas:
$3,120
(% of AGI for various income ranges: 0.2% for AGIs $10k-25k, 0.3% for AGIs $25k-50k, 0.4% for AGIs $50k-75k, 0.7% for AGIs $75k-100k)
Total itemized deductions: $19,251 (25% of AGI, reported on 16.2% of returns)
Here:
$19,251
State:
$19,631
Here:
25.0% of AGI
State:
18.9% of AGI
(% of AGI for various income ranges: 11.5% for AGIs below $10k, 5.3% for AGIs $10k-25k, 8.2% for AGIs $25k-50k, 9.1% for AGIs $50k-75k, 12.4% for AGIs $75k-100k, 7.3% for AGIs over 100k)
Charity contributions deductions: $6,129 (7% of AGI, reported on 12.8% of returns)
Here:
$6,129
State:
$4,753
Here:
7.3% of AGI
State:
4.2% of AGI
(% of AGI for various income ranges: 0.7% for AGIs $10k-25k, 1.2% for AGIs $25k-50k, 2.1% for AGIs $50k-75k, 2.9% for AGIs $75k-100k, 3.0% for AGIs over 100k)
Total tax: $4,866 (reported on 71.0% of returns)
78025:
$4,866
State:
$9,058
(% of AGI for various income ranges: 4.2% for AGIs below $10k, 4.2% for AGIs $10k-25k, 6.2% for AGIs $25k-50k, 9.6% for AGIs $50k-75k, 11.3% for AGIs $75k-100k, 12.2% for AGIs over 100k)
Earned income credit: $2,013 (reported on 23.2% of returns)
Here:
$2,013
State:
$2,024
Percentage of individuals using paid preparers for their 2004 taxes: 56.0%
Here:
56%
State:
57%
(% for various income ranges: 47.6% for AGIs below $10k, 58.4% for AGIs $10k-25k, 58.9% for AGIs $25k-50k, 54.5% for AGIs $50k-75k, 54.3% for AGIs $75k-100k, 72.0% for AGIs over 100k)
Household received Food Stamps/SNAP in the past 12 months: 136 Household did not receive Food Stamps/SNAP in the past 12 months: 2,143
Women who had a birth in the past 12 months: 36 (27 now married, 8 unmarried) Women who did not have a birth in the past 12 months: 835 (404 now married, 430 unmarried)
Housing units in zip code 78025 with a mortgage: 677 (11 second mortgage, 12 both second mortgage and home equity loan) Median monthly owner costs for units with a mortgage: $1,495 Median monthly owner costs for units without a mortgage: $592
Residents with income below the poverty level in 2022:
This zip code:
11.8%
Whole state:
14.0%
Residents with income below 50% of the poverty level in 2022:
This zip code:
2.5%
Whole state:
7.4%
Median number of rooms in houses and condos:
Here:
6.1
State:
6.3
Median number of rooms in apartments:
Here:
4.7
State:
4.0
Notable locations in this zip code not listed on our city pages
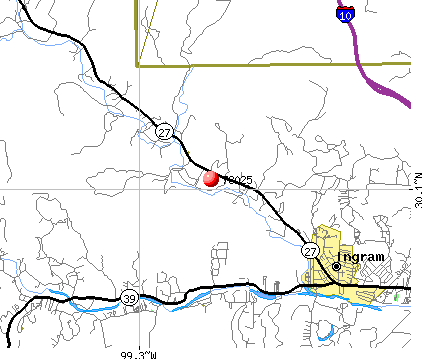
Notable locations in zip code 78025: Bittle Ranch (A), Camp Rio Vista (B), Camp Scenic (C), Indian Creek Camp (D), Trails End Ranch (E), Ingram Volunteer Fire Department (F). Display/hide their locations on the map
Streams, rivers, and creeks: Tegener Creek (A), Fall Branch (B), Henderson Branch (C), Indian Creek (D), Johnson Creek (E), Kelley Creek (F), Dry Branch (G), Byas Branch (H), Brushy Branch (I). Display/hide their locations on the map
In group quarters: 147 (-1 institutionalized population)
Size of family households: 1,005 2-persons, 269 3-persons, 156 4-persons, 141 5-persons, 21 6-persons, 23 7-or-more-persons
Size of nonfamily households: 509 1-person, 126 2-persons, 41 3-persons
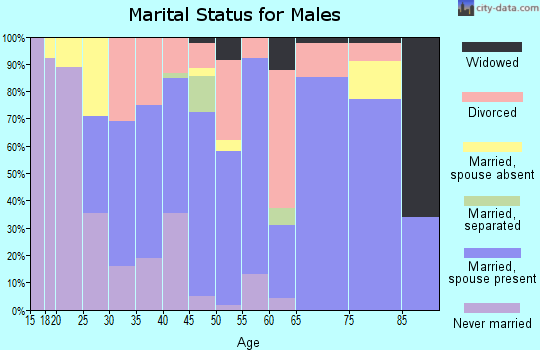
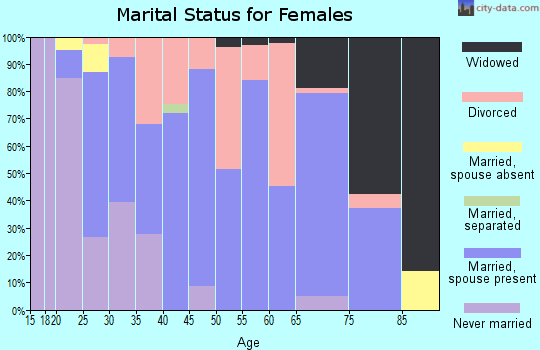
629 married couples with children.
200 single-parent households (39 men, 161 women).
81.5% of residents of 78025 zip code speak English at home.
18.3% of residents speak Spanish at home (70% very well, 14% well, 14% not well, 2% not at all).
0.2% of residents speak other Indo-European language at home (100% very well).
0.1% of residents speak Asian or Pacific Island language at home (100% well).
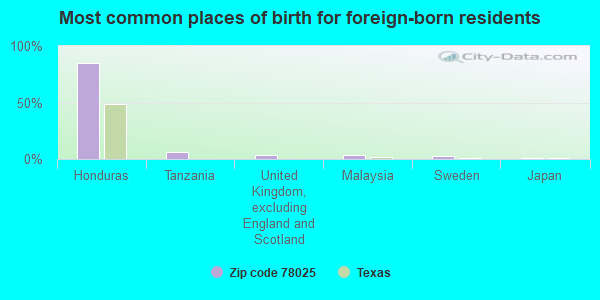
Foreign born population: 506 (9.4%) (24.3% of them are naturalized citizens)
This zip code:
9.4%
Whole state:
17.2%
85%Honduras
6%Tanzania
3%United Kingdom, excluding England and Scotland
3%Malaysia
3%Sweden
1%Japan
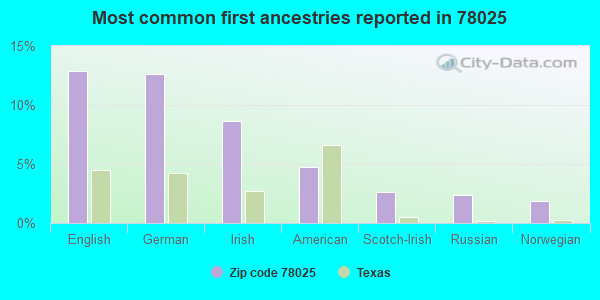
13%English
13%German
9%Irish
5%American
3%Scotch-Irish
2%Russian
2%Norwegian
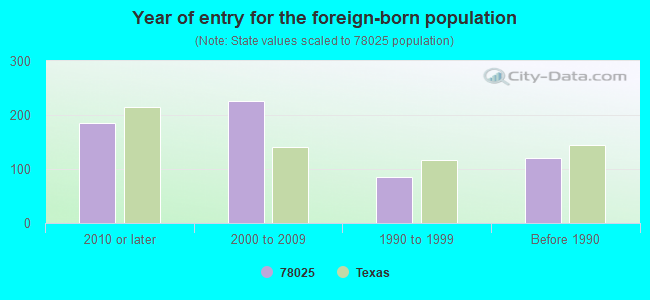
Year of entry for the foreign-born population
1862010 or later
2252000 to 2009
861990 to 1999
120Before 1990
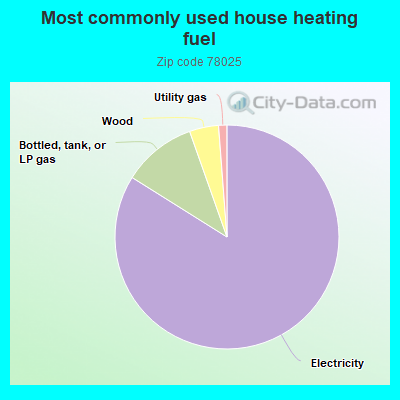
Housing units lacking complete plumbing facilities: 1.2% Housing units lacking complete kitchen facilities: 3.5%
84.0%Electricity
10.7%Bottled, tank, or LP gas
4.2%Wood
1.2%Utility gas
Population in 1990: 7,005.
Place of birth for U.S.-born residents:
This state: 3,147
Northeast: 225
Midwest: 568
South: 437
West: 405
53% of the 78025 zip code residents lived in the same house 5 years ago. Out of people who lived in different houses, 44% lived in this county. Out of people who lived in different counties, 50% lived in Texas.
86% of the 78025 zip code residents lived in the same house 1 year ago. Out of people who lived in different houses, 57% moved from this county. Out of people who lived in different houses, 27% moved from different county within same state. Out of people who lived in different houses, 13% moved from different state.
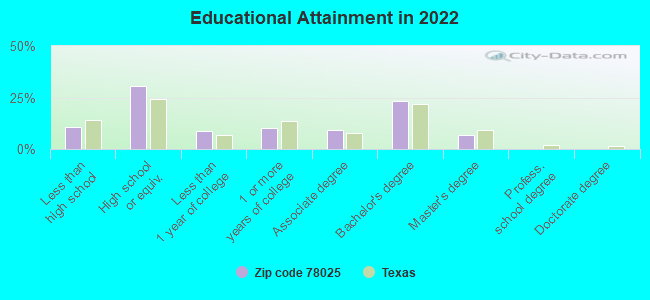
Private vs. public school enrollment:
Students in private schools in grades 1 to 8 (elementary and middle school): 97
Here:
16.5%
Texas:
8.8%
Students in private schools in grades 9 to 12 (high school): 10
Here:
3.7%
Texas:
8.0%
Students in private undergraduate colleges: 39
Here:
28.8%
Texas:
16.2%
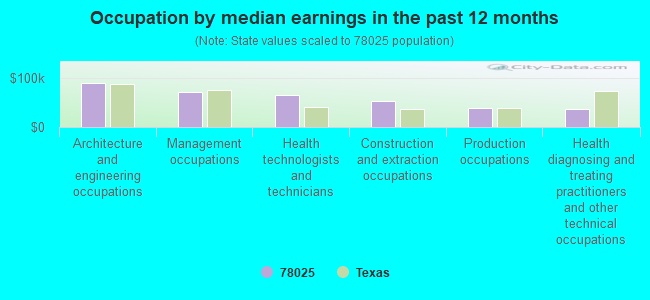
Occupation by median earnings in the past 12 months ($)
89,154Architecture and engineering occupations
71,024Management occupations
64,689Health technologists and technicians
51,731Construction and extraction occupations
38,035Production occupations
36,169Health diagnosing and treating practitioners and other technical occupations
Companies with federal contracts located in this zip code:
ROSINBAUM MACHINE (108 CAROLYN STREET in INGRAM, TX; small business) : $44,464 in 10 contractsfrom 2004 to 2005
Contracts for Fittings for Rope, Cable, and Chain, Hardware, Commercial, Airframe Structural Components, Bushings, Rings, Shims, and Spacers by Defense Logistics Agency Signed by year:2000: $0; 2001: $0; 2002: $0; 2003: $0; 2004: $13,064; 2005: $31,400; 2006: $0.
Biggest contracts:
$8,260 with Defense Logistics Agency for Fittings for Rope, Cable, and Chain. Signed on 2005-02-28. Completion date: 2005-03-29.
$5,760 with Defense Logistics Agency for Hardware, Commercial. Signed on 2004-11-22. Completion date: 2005-01-20.
$4,560 with Defense Logistics Agency for Airframe Structural Components. Signed on 2005-02-03. Completion date: 2005-04-19.
$4,510 with Defense Logistics Agency for Bushings, Rings, Shims, and Spacers. Signed on 2005-03-02. Completion date: 2005-05-12.
LAZY HILLS GUEST RANCH INC (375 HENDERSON BRANCH ROAD in INGRAM, TX; small business) : $22,173 in 3 contractsfrom 2003 to 2004
$23,745 with Army for Lease or Rental of Facilities -- Other Educational Buildings. Signed on 2004-05-05. Completion date: 2004-04-02.
$22,173 with Army for Lodging - Hotel/Motel. Signed on 2003-06-25. Completion date: 2003-08-01.
-$23,745 with Army for Lease or Rental of Facilities -- Other Educational Buildings. Signed on 2004-08-26. Completion date: 2004-09-10.
Top industries in this zip code by the number of employees in 2005:
Health Care and Social Assistance: Other Residential Care Facilities (50-99 employees: 2 establishments)
Arts, Entertainment, and Recreation: Independent Artists, Writers, and Performers (20-49: 1)
Other Services (except Public Administration): Religious Organizations (10-19: 1, 5-9: 2, 1-4: 2)
Accommodation and Food Services: Recreational and Vacation Camps (except Campgrounds) (10-19: 2)
Finance and Insurance: Commercial Banking (10-19: 1, 5-9: 1)
Construction: New Single-Family Housing Construction (except Operative Builders) (10-19: 1, 1-4: 2)
Administrative and Support and Waste Management and Remediation Services: Landscaping Services (10-19: 1, 1-4: 1)
People in group quarters in 2010:
41 people in residential treatment centers for juveniles (non-correctional)
39 people in workers' group living quarters and job corps centers
23 people in group homes for juveniles (non-correctional)
20 people in group homes intended for adults
People in group quarters in 2000:
81 people in other group homes
37 people in other noninstitutional group quarters
Fatal accident statistics in 2013:
Fatal accident count: 2
Vehicles involved in fatal accidents: 3
Fatal accidents caused by drunken drivers: 0
Fatalities: 2
Persons involved in fatal accidents: 3
Pedestrians involved in fatal accidents: 1
Fatal accident statistics in 2012:
Fatal accident count: 1
Vehicles involved in fatal accidents: 1
Fatal accidents caused by drunken drivers: 0
Fatalities: 1
Persons involved in fatal accidents: 1
Pedestrians involved in fatal accidents: 0
2002 - 2018 National Fire Incident Reporting System (NFIRS) incidents
According to the data from the years 2002 - 2018 the average number of fire incidents per year is 14. The highest number of fire incidents - 57 took place in 2006, and the least - 0 in 2010. The data has a dropping trend.
When looking into fire subcategories, the most incidents belonged to: Outside Fires (56.7%), and Structure Fires (30.0%).
Fire incident types reported to NFIRS in Zip Code 78025


 Nearest zip codes: 78029, 78028, 78024, 78055, 78631, 78010.
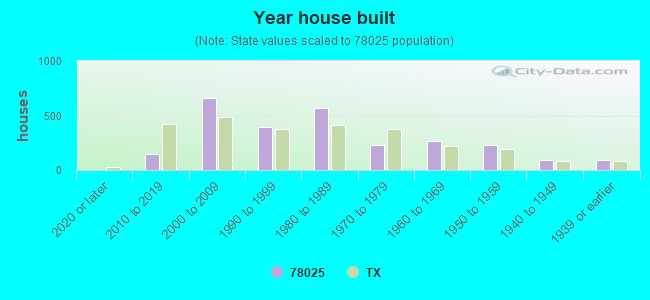


 : $44,464 in 10 contracts from 2004 to 2005


 According to the data from the years 2002 - 2018 the average number of fire incidents per year is 14. The highest number of fire incidents - 57 took place in 2006, and the least - 0 in 2010. The data has a dropping trend.
 When looking into fire subcategories, the most incidents belonged to: Outside Fires (56.7%), and Structure Fires (30.0%).