Estimated zip code population in 2022: 27,609 Zip code population in 2010: 27,593 Zip code population in 2000: 28,803
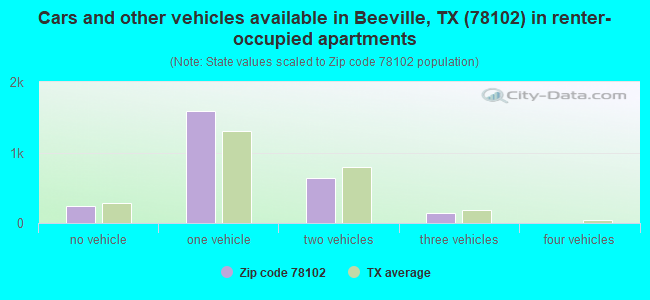
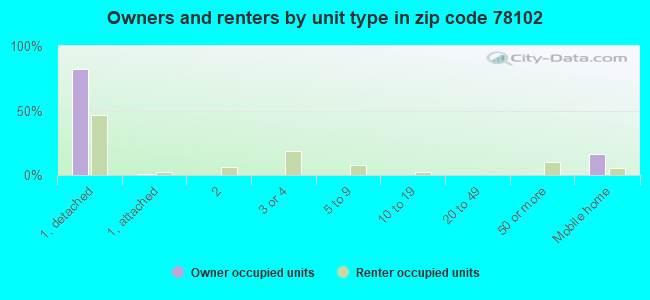
Houses and condos: 9,102 Renter-occupied apartments: 2,609
% of renters here:
34%
State:
38%
March 2022 cost of living index in zip code 78102: 78.4 (low, U.S. average is 100)
Land area: 469.0 sq. mi. Water area: 0.0 sq. mi.
Population density: 59 people per square mile
(very low).
OSM Map
General Map
Google Map
MSN Map
OSM Map
General Map
Google Map
MSN Map
OSM Map
General Map
Google Map
MSN Map
OSM Map
General Map
Google Map
MSN Map
Please wait while loading the map...
Real estate property taxes paid for housing units in 2022:
This zip code:
1.2% ($1,623)
Texas:
1.5% ($4,050)
Median real estate property taxes paid for housing units with mortgages in 2022: $2,064 (1.2%) Median real estate property taxes paid for housing units with no mortgage in 2022: $1,182 (1.1%)
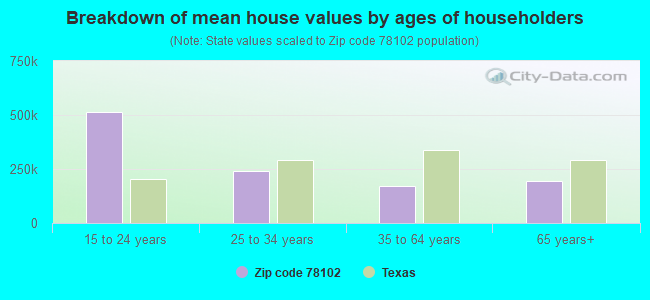
Estimated median house/condo value in 2022: $130,989
78102:
$130,989
Texas:
$275,400
According to our research of Texas and other state lists, there were 73 registered sex offenders living in 78102 zip code as of April 25, 2024. The ratio of all residents to sex offenders in zip code 78102 is 399 to 1. The ratio of registered sex offenders to all residents in this zip code is near the state average.
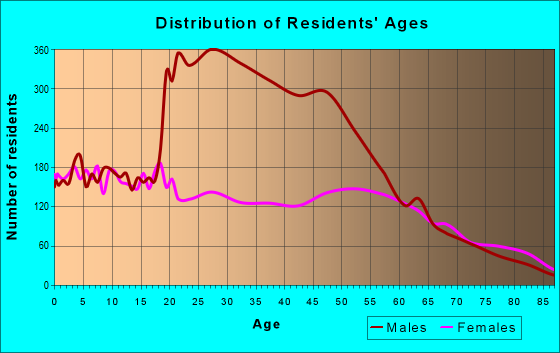
Median resident age:
This zip code:
35.8 years
Texas median age:
35.6 years
Average household size:
This zip code:
2.6 people
Texas:
2.6 people
Averages for the 2020 tax year for zip code 78102, filed in 2021:
Average Adjusted Gross Income (AGI) in 2020: $44,498 (Individual Income Tax Returns)
Here:
$44,498
State:
$77,054
Salary/wage: $39,541 (reported on 84.6% of returns)
Here:
$39,541
State:
$62,766
(% of AGI for various income ranges: 1258.5% for AGIs below $25k, 3548.9% for AGIs $25k-50k, 6164.2% for AGIs $50k-75k, 9577.1% for AGIs $75k-100k, 14925.1% for AGIs $100k-200k, 63193.3% for AGIs over 200k)
Taxable interest for individuals: $1,306 (reported on 18.2% of returns)
This zip code:
$1,306
Texas:
$2,665
(% of AGI for various income ranges: 9.2% for AGIs below $25k, 10.0% for AGIs $25k-50k, 28.5% for AGIs $50k-75k, 52.9% for AGIs $75k-100k, 114.9% for AGIs $100k-200k, 2003.3% for AGIs over 200k)
Ordinary dividends: $6,214 (reported on 7.9% of returns)
Here:
$6,214
State:
$10,044
(% of AGI for various income ranges: 8.8% for AGIs below $25k, 13.2% for AGIs $25k-50k, 26.2% for AGIs $50k-75k, 108.7% for AGIs $75k-100k, 213.7% for AGIs $100k-200k, 6886.7% for AGIs over 200k)
Net capital gain/loss in AGI: +$11,086 (reported on 7.8% of returns)
Here:
+$11,086
State:
+$39,590
(% of AGI for various income ranges: 10.5% for AGIs below $25k, 9.7% for AGIs $25k-50k, 38.3% for AGIs $50k-75k, 203.4% for AGIs $75k-100k, 414.4% for AGIs $100k-200k, 13023.3% for AGIs over 200k)
Profit/loss from business: +$6,083 (reported on 15.1% of returns)
Here:
+$6,083
State:
+$10,888
(% of AGI for various income ranges: 68.1% for AGIs below $25k, 28.4% for AGIs $25k-50k, 24.4% for AGIs $50k-75k, 225.8% for AGIs $75k-100k, 517.3% for AGIs $100k-200k, 6790.0% for AGIs over 200k)
Taxable individual retirement arrangement distribution: $18,831 (reported on 5.0% of returns)
78102:
$18,831
Texas:
$24,740
(% of AGI for various income ranges: 19.4% for AGIs below $25k, 40.5% for AGIs $25k-50k, 107.3% for AGIs $50k-75k, 296.6% for AGIs $75k-100k, 673.7% for AGIs $100k-200k, 5646.7% for AGIs over 200k)
Total itemized deductions: $31,605 (reported on 2.3% of returns)
Here:
$31,605
State:
$40,428
(% of AGI for various income ranges: 45.6% for AGIs $25k-50k, 139.8% for AGIs $50k-75k, 235.5% for AGIs $75k-100k, 353.2% for AGIs $100k-200k, 4880.0% for AGIs over 200k)
Charity contributions: $12,269 (reported on 1.6% of returns)
Here:
$12,269
State:
$18,201
(% of AGI for various income ranges: 2.6% for AGIs below $25k, 13.1% for AGIs $50k-75k, 51.8% for AGIs $75k-100k, 107.8% for AGIs $100k-200k, 2563.3% for AGIs over 200k)
Taxes paid: $5,663 (reported on 2.3% of returns)
78102:
$5,663
State:
$7,821
(% of AGI for various income ranges: 6.9% for AGIs $25k-50k, 18.5% for AGIs $50k-75k, 42.4% for AGIs $75k-100k, 79.8% for AGIs $100k-200k, 926.7% for AGIs over 200k)
Earned income credit: $2,659 (reported on 27.8% of returns)
Here:
$2,659
State:
$2,584
(% of AGI for various income ranges: 156.0% for AGIs below $25k, 92.8% for AGIs $25k-50k, 2.0% for AGIs $50k-75k)
Percentage of individuals using paid preparers for their 2020 taxes: 93.5%
Here:
94%
State:
92%
(% for various income ranges: 92.4% for AGIs below $25k, 95.1% for AGIs $25k-50k, 94.0% for AGIs $50k-75k, 94.6% for AGIs $75k-100k, 91.9% for AGIs $100k-200k, 91.7% for AGIs over 200k)
Averages for the 2012 tax year for zip code 78102, filed in 2013:
Average Adjusted Gross Income (AGI) in 2012: $43,073 (Individual Income Tax Returns)
Here:
$43,073
State:
$65,384
Salary/wage: $36,515 (reported on 89.8% of returns)
Here:
$36,515
State:
$52,524
(% of AGI for various income ranges: 84.7% for AGIs below $25k, 88.0% for AGIs $25k-50k, 83.9% for AGIs $50k-75k, 80.6% for AGIs $75k-100k, 74.6% for AGIs $100k-200k, 31.2% for AGIs over 200k)
Taxable interest for individuals: $1,084 (reported on 17.9% of returns)
This zip code:
$1,084
Texas:
$2,372
(% of AGI for various income ranges: 0.4% for AGIs below $25k, 0.2% for AGIs $25k-50k, 0.3% for AGIs $50k-75k, 0.4% for AGIs $75k-100k, 0.7% for AGIs $100k-200k, 0.9% for AGIs over 200k)
Ordinary dividends: $4,397 (reported on 7.5% of returns)
Here:
$4,397
State:
$9,721
(% of AGI for various income ranges: 0.6% for AGIs below $25k, 0.2% for AGIs $25k-50k, 0.4% for AGIs $50k-75k, 0.8% for AGIs $75k-100k, 1.1% for AGIs $100k-200k, 1.9% for AGIs over 200k)
Net capital gain/loss in AGI: +$24,848 (reported on 6.6% of returns)
Here:
+$24,848
State:
+$35,319
(% of AGI for various income ranges: 0.2% for AGIs $25k-50k, 0.3% for AGIs $50k-75k, 0.7% for AGIs $75k-100k, 2.5% for AGIs $100k-200k, 24.8% for AGIs over 200k)
Profit/loss from business: +$10,992 (reported on 14.2% of returns)
Here:
+$10,992
State:
+$13,732
(% of AGI for various income ranges: 5.4% for AGIs below $25k, 2.1% for AGIs $25k-50k, 1.8% for AGIs $50k-75k, 2.5% for AGIs $75k-100k, 4.1% for AGIs $100k-200k, 7.8% for AGIs over 200k)
Taxable individual retirement arrangement distribution: $14,581 (reported on 4.7% of returns)
78102:
$14,581
Texas:
$19,511
(% of AGI for various income ranges: 0.7% for AGIs below $25k, 1.0% for AGIs $25k-50k, 1.2% for AGIs $50k-75k, 1.9% for AGIs $75k-100k, 2.8% for AGIs $100k-200k, 2.3% for AGIs over 200k)
Total itemized deductions: $18,680 (19% of AGI, reported on 11.6% of returns)
Here:
$18,680
State:
$24,724
Here:
19.0% of AGI
State:
15.9% of AGI
(% of AGI for various income ranges: 2.2% for AGIs below $25k, 4.2% for AGIs $25k-50k, 5.4% for AGIs $50k-75k, 5.5% for AGIs $75k-100k, 7.5% for AGIs $100k-200k, 5.2% for AGIs over 200k)
Charity contributions: $5,012 (reported on 8.4% of returns)
Here:
$5,012
State:
$6,808
(% of AGI for various income ranges: 0.2% for AGIs below $25k, 0.7% for AGIs $25k-50k, 0.8% for AGIs $50k-75k, 0.8% for AGIs $75k-100k, 1.5% for AGIs $100k-200k, 2.0% for AGIs over 200k)
Taxes paid: $4,387 (reported on 11.1% of returns)
78102:
$4,387
State:
$6,921
(% of AGI for various income ranges: 0.3% for AGIs below $25k, 0.8% for AGIs $25k-50k, 1.1% for AGIs $50k-75k, 1.3% for AGIs $75k-100k, 1.8% for AGIs $100k-200k, 1.5% for AGIs over 200k)
Earned income credit: $2,500 (reported on 30.7% of returns)
Here:
$2,500
State:
$2,570
(% of AGI for various income ranges: 10.6% for AGIs below $25k, 1.5% for AGIs $25k-50k)
Percentage of individuals using paid preparers for their 2012 taxes: 61.4%
Here:
61%
State:
51%
(% for various income ranges: 58.7% for AGIs below $25k, 59.9% for AGIs $25k-50k, 67.3% for AGIs $50k-75k, 63.5% for AGIs $75k-100k, 69.6% for AGIs $100k-200k, 81.8% for AGIs over 200k)
Averages for the 2004 tax year for zip code 78102, filed in 2005:
Average Adjusted Gross Income (AGI) in 2004: $29,794 (Individual Income Tax Returns)
Here:
$29,794
State:
$47,881
Salary/wage: $26,489 (reported on 88.3% of returns)
Here:
$26,489
State:
$41,947
(% of AGI for various income ranges: 100.4% for AGIs below $10k, 85.1% for AGIs $10k-25k, 85.2% for AGIs $25k-50k, 80.1% for AGIs $50k-75k, 78.8% for AGIs $75k-100k, 50.6% for AGIs over 100k)
Taxable interest for individuals: $1,354 (reported on 25.8% of returns)
This zip code:
$1,354
Texas:
$2,255
(% of AGI for various income ranges: 2.2% for AGIs below $10k, 0.9% for AGIs $10k-25k, 1.0% for AGIs $25k-50k, 0.8% for AGIs $50k-75k, 0.9% for AGIs $75k-100k, 2.3% for AGIs over 100k)
Taxable dividends: $2,646 (reported on 10.6% of returns)
Here:
$2,646
State:
$4,261
(% of AGI for various income ranges: 1.4% for AGIs below $10k, 0.4% for AGIs $10k-25k, 0.5% for AGIs $25k-50k, 0.9% for AGIs $50k-75k, 0.4% for AGIs $75k-100k, 2.8% for AGIs over 100k)
Net capital gain/loss: +$4,940 (reported on 9.2% of returns)
Here:
+$4,940
State:
+$16,110
(% of AGI for various income ranges: -0.6% for AGIs below $10k, 0.2% for AGIs $10k-25k, 0.5% for AGIs $25k-50k, 0.9% for AGIs $50k-75k, 0.5% for AGIs $75k-100k, 7.0% for AGIs over 100k)
Profit/loss from business: +$6,775 (reported on 14.3% of returns)
Here:
+$6,775
State:
+$11,013
(% of AGI for various income ranges: 8.0% for AGIs below $10k, 2.4% for AGIs $10k-25k, 2.0% for AGIs $25k-50k, 3.2% for AGIs $50k-75k, 3.5% for AGIs $75k-100k, 5.7% for AGIs over 100k)
IRA payment deduction: $3,051 (reported on 1.5% of returns)
78102:
$3,051
Texas:
$3,120
(% of AGI for various income ranges: 0.1% for AGIs $10k-25k, 0.2% for AGIs $25k-50k, 0.2% for AGIs $50k-75k, 0.4% for AGIs $75k-100k)
Self-employed pension: $10,615 (reported on 0.2% of returns)
Here:
$10,615
Texas:
$16,401
Total itemized deductions: $15,880 (21% of AGI, reported on 8.0% of returns)
Here:
$15,880
State:
$19,631
Here:
21.3% of AGI
State:
18.9% of AGI
(% of AGI for various income ranges: 3.0% for AGIs below $10k, 2.4% for AGIs $10k-25k, 3.5% for AGIs $25k-50k, 5.0% for AGIs $50k-75k, 6.2% for AGIs $75k-100k, 6.1% for AGIs over 100k)
Charity contributions deductions: $4,801 (6% of AGI, reported on 6.1% of returns)
Here:
$4,801
State:
$4,753
Here:
5.8% of AGI
State:
4.2% of AGI
(% of AGI for various income ranges: 0.2% for AGIs below $10k, 0.3% for AGIs $10k-25k, 0.5% for AGIs $25k-50k, 0.9% for AGIs $50k-75k, 1.7% for AGIs $75k-100k, 2.6% for AGIs over 100k)
Total tax: $4,112 (reported on 61.6% of returns)
78102:
$4,112
State:
$9,058
(% of AGI for various income ranges: 2.6% for AGIs below $10k, 2.9% for AGIs $10k-25k, 5.9% for AGIs $25k-50k, 8.8% for AGIs $50k-75k, 11.2% for AGIs $75k-100k, 19.1% for AGIs over 100k)
Earned income credit: $2,004 (reported on 35.2% of returns)
Here:
$2,004
State:
$2,024
Percentage of individuals using paid preparers for their 2004 taxes: 70.3%
Here:
70%
State:
57%
(% for various income ranges: 66.4% for AGIs below $10k, 74.9% for AGIs $10k-25k, 69.4% for AGIs $25k-50k, 67.2% for AGIs $50k-75k, 65.8% for AGIs $75k-100k, 77.8% for AGIs over 100k)
Likely homosexual households (counted as self-reported same-sex unmarried-partner households)
Lesbian couples: 0.1% of all households
Gay men: 0.0% of all households
Household received Food Stamps/SNAP in the past 12 months: 1,566 Household did not receive Food Stamps/SNAP in the past 12 months: 6,053
Women who had a birth in the past 12 months: 250 (146 now married, 102 unmarried) Women who did not have a birth in the past 12 months: 4,268 (1,713 now married, 2,560 unmarried)
Housing units in zip code 78102 with a mortgage: 1,840 (59 second mortgage, 64 both second mortgage and home equity loan) Median monthly owner costs for units with a mortgage: $1,236 Median monthly owner costs for units without a mortgage: $415
Residents with income below the poverty level in 2022:
This zip code:
22.2%
Whole state:
14.0%
Residents with income below 50% of the poverty level in 2022:
This zip code:
11.7%
Whole state:
7.4%
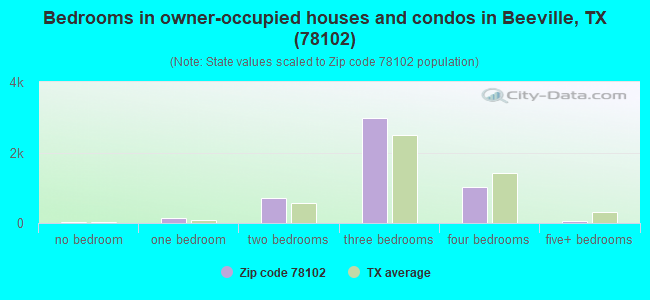
Median number of rooms in houses and condos:
Here:
5.8
State:
6.3
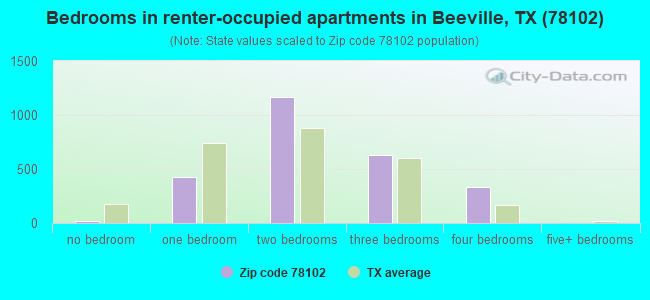
Median number of rooms in apartments:
Here:
4.7
State:
4.0
Notable locations in this zip code not listed on our city pages
In group quarters: 7,275 (-1 institutionalized population)
Size of family households: 1,895 2-persons, 1,069 3-persons, 1,134 4-persons, 373 5-persons, 282 6-persons, 138 7-or-more-persons
Size of nonfamily households: 2,213 1-person, 480 2-persons, 8 5-persons
2,922 married couples with children.
1,161 single-parent households (134 men, 1,027 women).
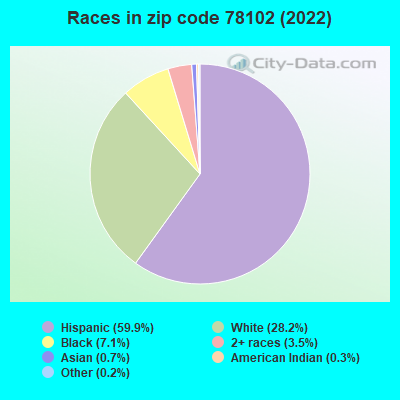
64.3% of residents of 78102 zip code speak English at home.
34.6% of residents speak Spanish at home (78% very well, 13% well, 6% not well, 3% not at all).
1.0% of residents speak other Indo-European language at home (64% very well, 34% well, 2% not well).
0.2% of residents speak Asian or Pacific Island language at home (31% very well, 47% well, 19% not well, 3% not at all).
0.2% of residents speak other language at home (67% very well, 33% well).
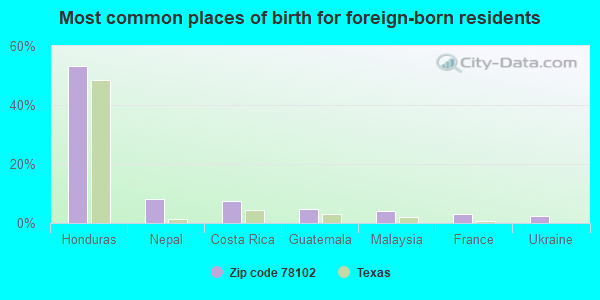
Foreign born population: 1,255 (4.5%) (46.3% of them are naturalized citizens)
This zip code:
4.5%
Whole state:
17.2%
53%Honduras
8%Nepal
7%Costa Rica
5%Guatemala
4%Malaysia
3%France
2%Ukraine
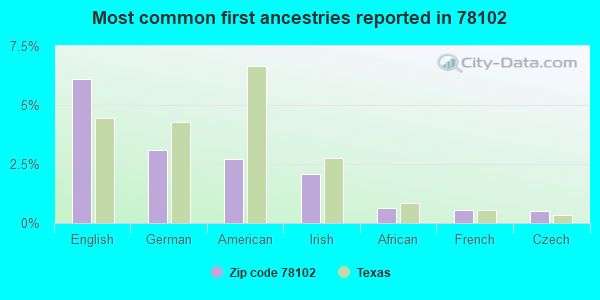
6%English
3%German
3%American
2%Irish
1%African
1%French
0%Czech
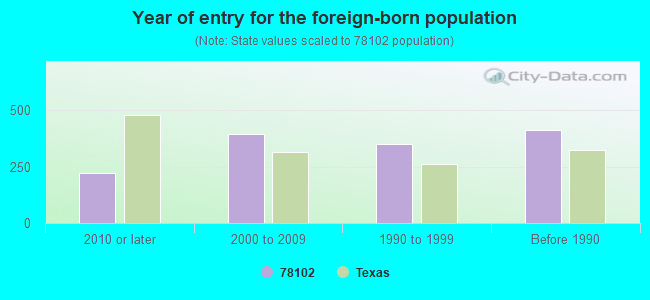
Year of entry for the foreign-born population
2232010 or later
3942000 to 2009
3501990 to 1999
413Before 1990
Facilities with environmental interests located in this zip code:
AC JONES HIGH SCHOOL (1902 N ADAMS ST in BEEVILLE, TX)
AIR MONITORING SITE (Airborne pollution emission tracking) (National Center for Education Statistics) - STATE ID-013901001 Organizations: BEEVILLE ISD (SCHOOL DISTRICT)
Alternative names: A C JONES HIGH SCHOOL
ALAMO CONCRETE PRODUCTS, LTD. (200 WEST REAGAN ROAD in BEEVILLE, TX)
National Pollutant Discharge Elimination System NON-MAJOR (Tracking pollutant discharge elimination systems) - permit Business SIC classification: READY-MIXED CONCRETE
BAM ENERGY INCORPORATED (FM 2505 & HWY 97 in BEEVILLE, TX)
AIR MAJOR (AIRS/AFS) CRITERIA AND HAZARDOUS AIR POLLUTANT INVENTORY (Inventory of air pollution sources) Business SIC and NAICS classification: CRUDE PETROLEUM AND NATURAL GAS
Housing units lacking complete plumbing facilities: 5.3% Housing units lacking complete kitchen facilities: 5.1%
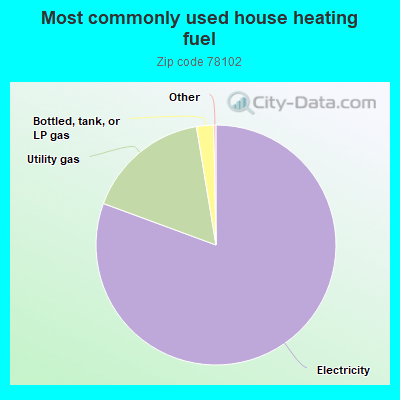
80.7%Electricity
16.8%Utility gas
2.3%Bottled, tank, or LP gas
Population in 1990: 23,211. Population change in the 1990s: +5,592 (+24.1%).
Place of birth for U.S.-born residents:
This state: 22,160
Northeast: 312
Midwest: 1,281
South: 1,121
West: 1,091
41% of the 78102 zip code residents lived in the same house 5 years ago. Out of people who lived in different houses, 35% lived in this county. Out of people who lived in different counties, 50% lived in Texas.
81% of the 78102 zip code residents lived in the same house 1 year ago. Out of people who lived in different houses, 22% moved from this county. Out of people who lived in different houses, 77% moved from different county within same state. Out of people who lived in different houses, 1% moved from different state. Out of people who lived in different houses, 0% moved from abroad.
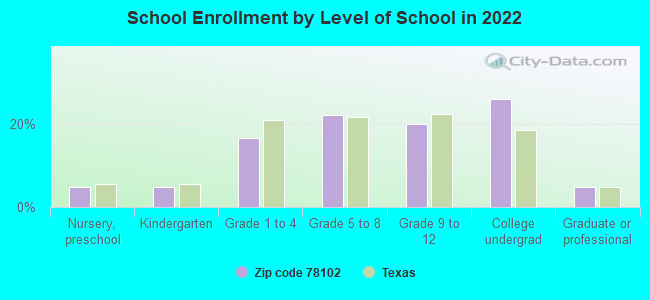
Private vs. public school enrollment:
Students in private schools in grades 1 to 8 (elementary and middle school): 125
Here:
5.3%
Texas:
8.8%
Students in private schools in grades 9 to 12 (high school): 134
Here:
11.0%
Texas:
8.0%
Students in private undergraduate colleges: 66
Here:
4.2%
Texas:
16.2%
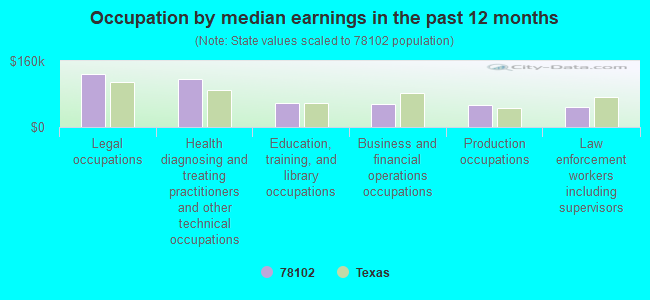
Occupation by median earnings in the past 12 months ($)
127,825Legal occupations
117,350Health diagnosing and treating practitioners and other technical occupations
57,565Education, training, and library occupations
55,795Business and financial operations occupations
52,300Production occupations
49,278Law enforcement workers including supervisors
Top industries in this zip code by the number of employees in 2005:
Health Care and Social Assistance: General Medical and Surgical Hospitals (250-499 employees: 1 establishment)
Health Care and Social Assistance: Child Day Care Services (20-49: 2, 5-9: 1, 1-4: 1)
People in group quarters in 2010:
7,073 people in state prisons
124 people in nursing facilities/skilled-nursing facilities
123 people in local jails and other municipal confinement facilities
98 people in college/university student housing
2 people in other noninstitutional facilities
People in group quarters in 2000:
7,070 people in state prisons
147 people in nursing homes
112 people in college dormitories (includes college quarters off campus)
111 people in local jails and other confinement facilities (including police lockups)
60 people in other noninstitutional group quarters
8 people in religious group quarters
6 people in homes for the mentally retarded
2005 - 2014 National Fire Incident Reporting System (NFIRS) incidents
Based on the data from the years 2005 - 2014 the average number of fire incidents per year is 36. The highest number of fire incidents - 168 took place in 2006, and the least - 1 in 2010. The data has a declining trend.
When looking into fire subcategories, the most reports belonged to: Outside Fires (64.7%), and Structure Fires (22.2%).
Fire incident types reported to NFIRS in Zip Code 78102
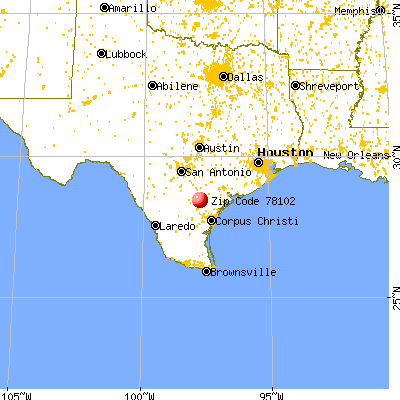


 Nearest zip codes: 78104, 78142, 78389, 78162, 78107, 78391.
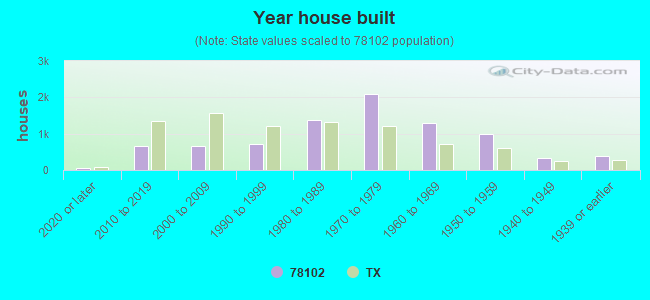


 Based on the data from the years 2005 - 2014 the average number of fire incidents per year is 36. The highest number of fire incidents - 168 took place in 2006, and the least - 1 in 2010. The data has a declining trend.
 When looking into fire subcategories, the most reports belonged to: Outside Fires (64.7%), and Structure Fires (22.2%).