Estimated zip code population in 2022: 22,714 Zip code population in 2010: 16,269 Zip code population in 2000: 13,568
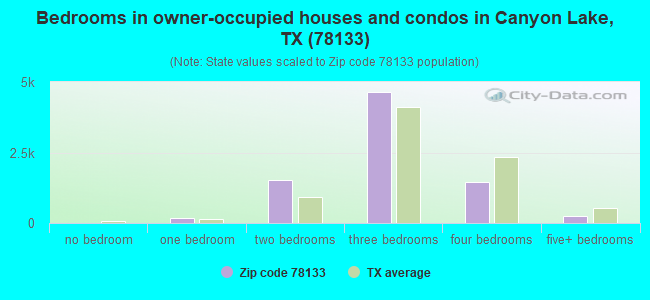
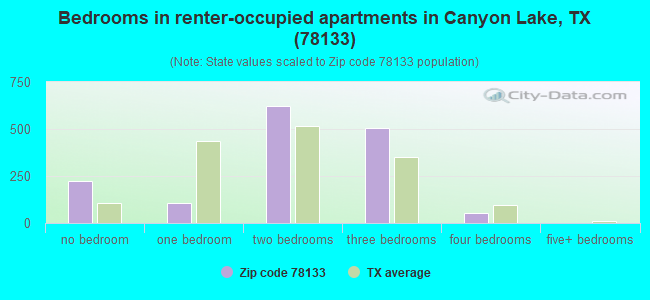
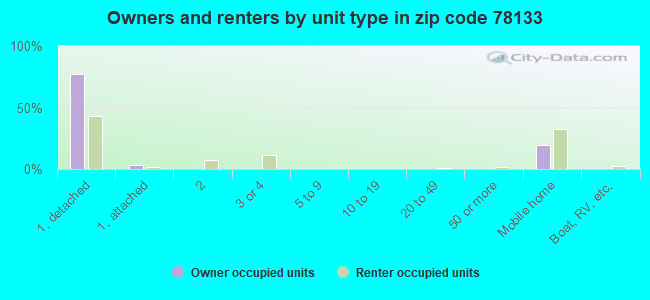
Houses and condos: 11,730 Renter-occupied apartments: 1,490
% of renters here:
15%
State:
38%
March 2022 cost of living index in zip code 78133: 81.6 (low, U.S. average is 100)
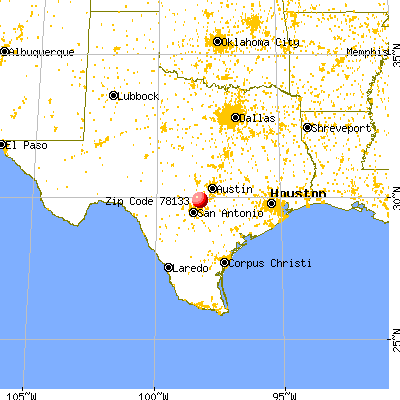
Land area: 83.6 sq. mi. Water area: 12.3 sq. mi.
Population density: 272 people per square mile
(very low).
OSM Map
General Map
Google Map
MSN Map
OSM Map
General Map
Google Map
MSN Map
OSM Map
General Map
Google Map
MSN Map
OSM Map
General Map
Google Map
MSN Map
Please wait while loading the map...
Real estate property taxes paid for housing units in 2022:
This zip code:
0.9% ($2,835)
Texas:
1.5% ($4,050)
Median real estate property taxes paid for housing units with mortgages in 2022: $3,450 (1.0%) Median real estate property taxes paid for housing units with no mortgage in 2022: $2,477 (0.8%)
Averages for the 2020 tax year for zip code 78133, filed in 2021:
Average Adjusted Gross Income (AGI) in 2020: $79,921 (Individual Income Tax Returns)
Here:
$79,921
State:
$77,054
Salary/wage: $64,808 (reported on 71.6% of returns)
Here:
$64,808
State:
$62,766
(% of AGI for various income ranges: 951.1% for AGIs below $25k, 3078.4% for AGIs $25k-50k, 5516.7% for AGIs $50k-75k, 7841.6% for AGIs $75k-100k, 15645.5% for AGIs $100k-200k, 64276.5% for AGIs over 200k)
Taxable interest for individuals: $2,008 (reported on 37.3% of returns)
This zip code:
$2,008
Texas:
$2,665
(% of AGI for various income ranges: 23.4% for AGIs below $25k, 27.8% for AGIs $25k-50k, 64.1% for AGIs $50k-75k, 93.3% for AGIs $75k-100k, 206.8% for AGIs $100k-200k, 1541.3% for AGIs over 200k)
Ordinary dividends: $3,760 (reported on 45.1% of returns)
Here:
$3,760
State:
$10,044
(% of AGI for various income ranges: 43.0% for AGIs below $25k, 79.4% for AGIs $25k-50k, 169.3% for AGIs $50k-75k, 243.1% for AGIs $75k-100k, 513.8% for AGIs $100k-200k, 3063.0% for AGIs over 200k)
Net capital gain/loss in AGI: +$19,736 (reported on 22.1% of returns)
Here:
+$19,736
State:
+$39,590
(% of AGI for various income ranges: 8.3% for AGIs below $25k, 69.5% for AGIs $25k-50k, 178.2% for AGIs $50k-75k, 239.4% for AGIs $75k-100k, 893.8% for AGIs $100k-200k, 14097.0% for AGIs over 200k)
Profit/loss from business: +$14,026 (reported on 20.5% of returns)
Here:
+$14,026
State:
+$10,888
(% of AGI for various income ranges: 193.1% for AGIs below $25k, 223.7% for AGIs $25k-50k, 448.8% for AGIs $50k-75k, 478.7% for AGIs $75k-100k, 698.9% for AGIs $100k-200k, 3129.1% for AGIs over 200k)
Taxable individual retirement arrangement distribution: $28,740 (reported on 13.7% of returns)
78133:
$28,740
Texas:
$24,740
(% of AGI for various income ranges: 82.8% for AGIs below $25k, 153.6% for AGIs $25k-50k, 373.6% for AGIs $50k-75k, 729.9% for AGIs $75k-100k, 1626.5% for AGIs $100k-200k, 5203.9% for AGIs over 200k)
Self-employed (Keogh) retirement plans: $16,000 (reported on 0.5% of returns)
78133:
$16,000
Texas:
$29,298
(% of AGI for various income ranges: 76.9% for AGIs $100k-200k)
Total itemized deductions: $34,678 (reported on 9.3% of returns)
Here:
$34,678
State:
$40,428
(% of AGI for various income ranges: 52.3% for AGIs below $25k, 134.1% for AGIs $25k-50k, 233.7% for AGIs $50k-75k, 533.4% for AGIs $75k-100k, 1097.4% for AGIs $100k-200k, 5955.7% for AGIs over 200k)
Charity contributions: $9,999 (reported on 7.5% of returns)
Here:
$9,999
State:
$18,201
(% of AGI for various income ranges: 5.2% for AGIs below $25k, 16.5% for AGIs $25k-50k, 32.5% for AGIs $50k-75k, 97.8% for AGIs $75k-100k, 234.7% for AGIs $100k-200k, 1807.0% for AGIs over 200k)
Taxes paid: $7,540 (reported on 9.1% of returns)
78133:
$7,540
State:
$7,821
(% of AGI for various income ranges: 8.5% for AGIs below $25k, 21.7% for AGIs $25k-50k, 52.0% for AGIs $50k-75k, 127.0% for AGIs $75k-100k, 259.7% for AGIs $100k-200k, 1150.4% for AGIs over 200k)
Earned income credit: $2,167 (reported on 12.6% of returns)
Here:
$2,167
State:
$2,584
(% of AGI for various income ranges: 80.6% for AGIs below $25k, 58.8% for AGIs $25k-50k, 1.1% for AGIs $50k-75k)
Percentage of individuals using paid preparers for their 2020 taxes: 90.6%
Here:
91%
State:
92%
(% for various income ranges: 89.7% for AGIs below $25k, 91.7% for AGIs $25k-50k, 89.4% for AGIs $50k-75k, 91.2% for AGIs $75k-100k, 90.7% for AGIs $100k-200k, 91.9% for AGIs over 200k)
Averages for the 2012 tax year for zip code 78133, filed in 2013:
Average Adjusted Gross Income (AGI) in 2012: $61,095 (Individual Income Tax Returns)
Here:
$61,095
State:
$65,384
Salary/wage: $47,913 (reported on 74.4% of returns)
Here:
$47,913
State:
$52,524
(% of AGI for various income ranges: 65.8% for AGIs below $25k, 68.1% for AGIs $25k-50k, 65.0% for AGIs $50k-75k, 61.1% for AGIs $75k-100k, 61.1% for AGIs $100k-200k, 42.1% for AGIs over 200k)
Taxable interest for individuals: $1,893 (reported on 36.7% of returns)
This zip code:
$1,893
Texas:
$2,372
(% of AGI for various income ranges: 1.8% for AGIs below $25k, 1.0% for AGIs $25k-50k, 0.7% for AGIs $50k-75k, 1.0% for AGIs $75k-100k, 1.3% for AGIs $100k-200k, 1.2% for AGIs over 200k)
Ordinary dividends: $5,662 (reported on 21.4% of returns)
Here:
$5,662
State:
$9,721
(% of AGI for various income ranges: 2.6% for AGIs below $25k, 1.4% for AGIs $25k-50k, 1.6% for AGIs $50k-75k, 1.6% for AGIs $75k-100k, 2.0% for AGIs $100k-200k, 2.6% for AGIs over 200k)
Net capital gain/loss in AGI: +$21,701 (reported on 18.0% of returns)
Here:
+$21,701
State:
+$35,319
(% of AGI for various income ranges: 0.2% for AGIs $25k-50k, 0.8% for AGIs $50k-75k, 1.3% for AGIs $75k-100k, 2.8% for AGIs $100k-200k, 22.0% for AGIs over 200k)
Profit/loss from business: +$14,110 (reported on 20.7% of returns)
Here:
+$14,110
State:
+$13,732
(% of AGI for various income ranges: 10.4% for AGIs below $25k, 4.4% for AGIs $25k-50k, 2.7% for AGIs $50k-75k, 3.7% for AGIs $75k-100k, 5.1% for AGIs $100k-200k, 4.8% for AGIs over 200k)
Taxable individual retirement arrangement distribution: $18,783 (reported on 14.1% of returns)
78133:
$18,783
Texas:
$19,511
(% of AGI for various income ranges: 4.2% for AGIs below $25k, 4.2% for AGIs $25k-50k, 4.2% for AGIs $50k-75k, 4.1% for AGIs $75k-100k, 6.1% for AGIs $100k-200k, 2.6% for AGIs over 200k)
Self-employment retirement plans: $20,425 (reported on 0.5% of returns)
78133:
$20,425
Texas:
$23,938
Total itemized deductions: $22,932 (20% of AGI, reported on 27.7% of returns)
Here:
$22,932
State:
$24,724
Here:
20.1% of AGI
State:
15.9% of AGI
(% of AGI for various income ranges: 10.4% for AGIs below $25k, 9.9% for AGIs $25k-50k, 13.3% for AGIs $50k-75k, 11.1% for AGIs $75k-100k, 11.5% for AGIs $100k-200k, 7.3% for AGIs over 200k)
Charity contributions: $4,472 (reported on 20.2% of returns)
Here:
$4,472
State:
$6,808
(% of AGI for various income ranges: 0.7% for AGIs below $25k, 1.2% for AGIs $25k-50k, 1.1% for AGIs $50k-75k, 1.5% for AGIs $75k-100k, 1.8% for AGIs $100k-200k, 1.7% for AGIs over 200k)
Taxes paid: $6,156 (reported on 27.2% of returns)
78133:
$6,156
State:
$6,921
(% of AGI for various income ranges: 1.9% for AGIs below $25k, 2.0% for AGIs $25k-50k, 3.8% for AGIs $50k-75k, 2.5% for AGIs $75k-100k, 3.2% for AGIs $100k-200k, 2.3% for AGIs over 200k)
Earned income credit: $2,185 (reported on 16.2% of returns)
Here:
$2,185
State:
$2,570
(% of AGI for various income ranges: 6.0% for AGIs below $25k, 1.0% for AGIs $25k-50k)
Percentage of individuals using paid preparers for their 2012 taxes: 42.6%
Here:
43%
State:
51%
(% for various income ranges: 36.5% for AGIs below $25k, 41.0% for AGIs $25k-50k, 43.8% for AGIs $50k-75k, 49.3% for AGIs $75k-100k, 50.0% for AGIs $100k-200k, 71.4% for AGIs over 200k)
Averages for the 2004 tax year for zip code 78133, filed in 2005:
Average Adjusted Gross Income (AGI) in 2004: $43,615 (Individual Income Tax Returns)
Here:
$43,615
State:
$47,881
Salary/wage: $38,080 (reported on 73.6% of returns)
Here:
$38,080
State:
$41,947
(% of AGI for various income ranges: 160.4% for AGIs below $10k, 65.0% for AGIs $10k-25k, 67.0% for AGIs $25k-50k, 68.2% for AGIs $50k-75k, 66.2% for AGIs $75k-100k, 55.2% for AGIs over 100k)
Taxable interest for individuals: $2,042 (reported on 44.8% of returns)
This zip code:
$2,042
Texas:
$2,255
(% of AGI for various income ranges: 11.6% for AGIs below $10k, 3.1% for AGIs $10k-25k, 2.0% for AGIs $25k-50k, 1.9% for AGIs $50k-75k, 1.7% for AGIs $75k-100k, 1.9% for AGIs over 100k)
Taxable dividends: $2,958 (reported on 24.6% of returns)
Here:
$2,958
State:
$4,261
(% of AGI for various income ranges: 7.2% for AGIs below $10k, 1.8% for AGIs $10k-25k, 1.3% for AGIs $25k-50k, 1.2% for AGIs $50k-75k, 1.7% for AGIs $75k-100k, 2.0% for AGIs over 100k)
Net capital gain/loss: +$10,894 (reported on 20.0% of returns)
Here:
+$10,894
State:
+$16,110
(% of AGI for various income ranges: 8.3% for AGIs below $10k, 0.3% for AGIs $10k-25k, 1.2% for AGIs $25k-50k, 1.6% for AGIs $50k-75k, 2.1% for AGIs $75k-100k, 12.8% for AGIs over 100k)
Profit/loss from business: +$8,856 (reported on 21.8% of returns)
Here:
+$8,856
State:
+$11,013
(% of AGI for various income ranges: 3.7% for AGIs below $10k, 8.9% for AGIs $10k-25k, 4.9% for AGIs $25k-50k, 2.5% for AGIs $50k-75k, 3.3% for AGIs $75k-100k, 4.8% for AGIs over 100k)
IRA payment deduction: $3,149 (reported on 2.6% of returns)
78133:
$3,149
Texas:
$3,120
(% of AGI for various income ranges: 0.2% for AGIs $10k-25k, 0.2% for AGIs $25k-50k, 0.2% for AGIs $50k-75k, 0.2% for AGIs $75k-100k, 0.1% for AGIs over 100k)
Self-employed pension: $12,096 (reported on 0.8% of returns)
Here:
$12,096
Texas:
$16,401
(% of AGI for various income ranges: 0.3% for AGIs $10k-25k, 0.1% for AGIs $50k-75k, 0.5% for AGIs over 100k)
Total itemized deductions: $17,204 (23% of AGI, reported on 27.7% of returns)
Here:
$17,204
State:
$19,631
Here:
22.6% of AGI
State:
18.9% of AGI
(% of AGI for various income ranges: 27.9% for AGIs below $10k, 10.7% for AGIs $10k-25k, 11.4% for AGIs $25k-50k, 10.6% for AGIs $50k-75k, 12.0% for AGIs $75k-100k, 9.8% for AGIs over 100k)
Charity contributions deductions: $3,110 (4% of AGI, reported on 22.3% of returns)
Here:
$3,110
State:
$4,753
Here:
3.9% of AGI
State:
4.2% of AGI
(% of AGI for various income ranges: 1.6% for AGIs below $10k, 1.0% for AGIs $10k-25k, 1.3% for AGIs $25k-50k, 1.4% for AGIs $50k-75k, 1.7% for AGIs $75k-100k, 2.0% for AGIs over 100k)
Total tax: $6,555 (reported on 77.6% of returns)
78133:
$6,555
State:
$9,058
(% of AGI for various income ranges: 6.6% for AGIs below $10k, 4.5% for AGIs $10k-25k, 7.3% for AGIs $25k-50k, 9.2% for AGIs $50k-75k, 11.4% for AGIs $75k-100k, 18.8% for AGIs over 100k)
Earned income credit: $1,697 (reported on 14.3% of returns)
Here:
$1,697
State:
$2,024
Percentage of individuals using paid preparers for their 2004 taxes: 51.3%
Here:
51%
State:
57%
(% for various income ranges: 45.7% for AGIs below $10k, 51.2% for AGIs $10k-25k, 51.6% for AGIs $25k-50k, 52.6% for AGIs $50k-75k, 52.8% for AGIs $75k-100k, 60.3% for AGIs over 100k)
Likely homosexual households (counted as self-reported same-sex unmarried-partner households)
Lesbian couples: 0.0% of all households
Gay men: 0.1% of all households
Household received Food Stamps/SNAP in the past 12 months: 647 Household did not receive Food Stamps/SNAP in the past 12 months: 8,959
Women who had a birth in the past 12 months: 463 (376 now married, 90 unmarried) Women who did not have a birth in the past 12 months: 3,399 (2,086 now married, 1,294 unmarried)
Housing units in zip code 78133 with a mortgage: 4,236 (183 second mortgage, 9 home equity loan, 158 both second mortgage and home equity loan) Houses without a mortgage: 22
Median monthly owner costs for units with a mortgage: $1,648 Median monthly owner costs for units without a mortgage: $525
Residents with income below the poverty level in 2022:
This zip code:
9.4%
Whole state:
14.0%
Residents with income below 50% of the poverty level in 2022:
This zip code:
4.1%
Whole state:
7.4%
Median number of rooms in houses and condos:
Here:
5.8
State:
6.3
Median number of rooms in apartments:
Here:
4.0
State:
4.0
Notable locations in this zip code not listed on our city pages
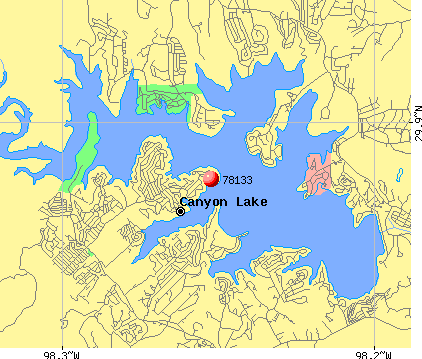
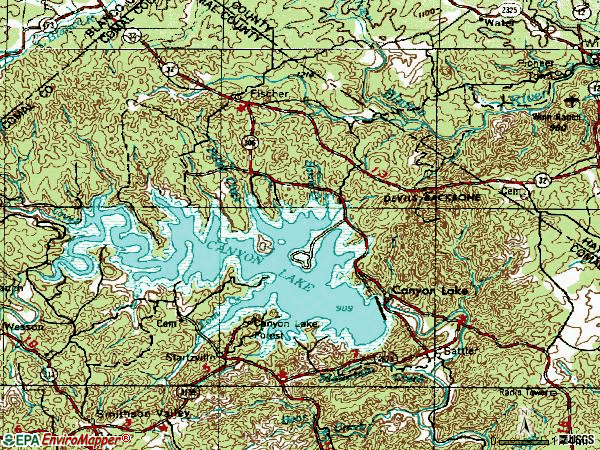
Notable locations in zip code 78133: Canyon Lake Fire / Emergency Medical Service Station 1 (A), Canyon Lake Fire / Emergency Medical Service Station 5 (B), Canyon Lake Fire / Emergency Medical Service Station 3 (C), Canyon Lake Fire / Emergency Medical Service Station 2 (D), Canyon Lake Fire and Emergency Medical Station Number 4 (E). Display/hide their locations on the map
Parks in zip code 78133 include: Allen Park (1), Jacobs Creek Park (2), Overlook Park (3), North Park (4), Cranes Mill Park (5), Potter Creek Park (6), Comal Park (7), Canyon Park (8). Display/hide their locations on the map
In group quarters: 8 (-1 institutionalized population)
Size of family households: 3,766 2-persons, 1,085 3-persons, 1,193 4-persons, 334 5-persons, 102 6-persons, 131 7-or-more-persons
Size of nonfamily households: 2,652 1-person, 332 2-persons, 60 3-persons
2,838 married couples with children.
1,038 single-parent households (593 men, 445 women).
91.5% of residents of 78133 zip code speak English at home.
7.1% of residents speak Spanish at home (78% very well, 9% well, 8% not well, 5% not at all).
1.3% of residents speak other Indo-European language at home (87% very well, 13% not well).
0.3% of residents speak Asian or Pacific Island language at home (91% very well, 9% well).
0.3% of residents speak other language at home (100% very well).
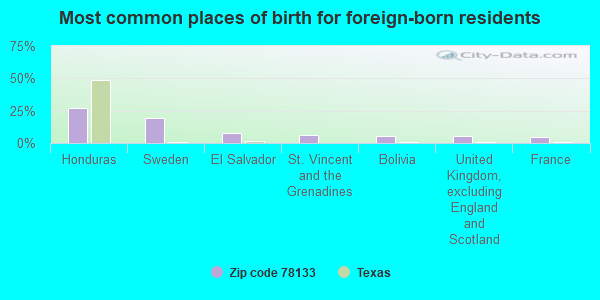
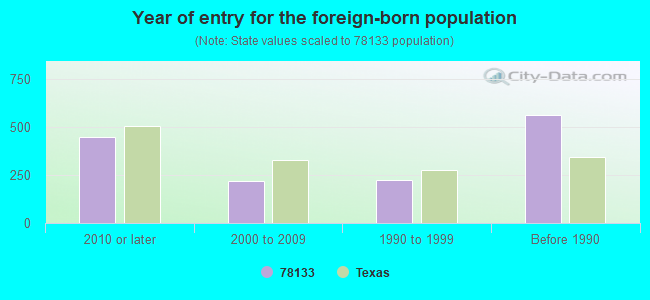
Foreign born population: 966 (4.3%) (54.4% of them are naturalized citizens)
This zip code:
4.3%
Whole state:
17.2%
27%Honduras
19%Sweden
8%El Salvador
6%St. Vincent and the Grenadines
6%Bolivia
5%United Kingdom, excluding England and Scotland
4%France
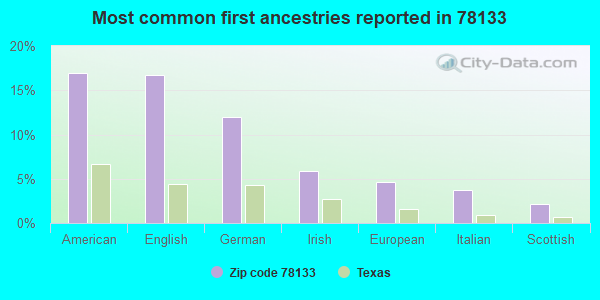
17%American
17%English
12%German
6%Irish
5%European
4%Italian
2%Scottish
Year of entry for the foreign-born population
4502010 or later
2172000 to 2009
2221990 to 1999
563Before 1990
Facilities with environmental interests located in this zip code:
ARROWHEAD VILLAGE WATER SYS (418 OSAGE DR in CANYON LAKE, TX)
(Integrated Compliance Information System) - ICIS-06-2000-1140, FORMAL ENFORCEMENT ACTION, ICIS-06-2001-1209, Business SIC classification: WATER SUPPLY
Housing units lacking complete plumbing facilities: 1.1% Housing units lacking complete kitchen facilities: 1.2%
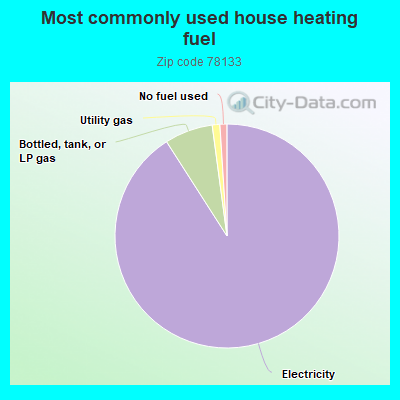
90.4%Electricity
6.9%Bottled, tank, or LP gas
1.1%Utility gas
1.0%No fuel used
Population in 1990: 8,428. Population change in the 1990s: +5,140 (+61.0%).
Place of birth for U.S.-born residents:
This state: 13,518
Northeast: 1,240
Midwest: 2,658
South: 1,796
West: 2,052
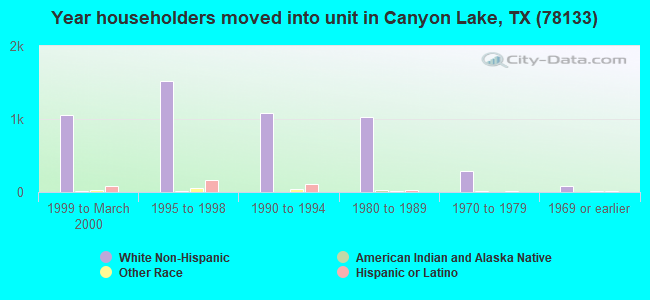
53% of the 78133 zip code residents lived in the same house 5 years ago. Out of people who lived in different houses, 32% lived in this county. Out of people who lived in different counties, 50% lived in Texas.
90% of the 78133 zip code residents lived in the same house 1 year ago. Out of people who lived in different houses, 25% moved from this county. Out of people who lived in different houses, 54% moved from different county within same state. Out of people who lived in different houses, 23% moved from different state. Out of people who lived in different houses, 2% moved from abroad.
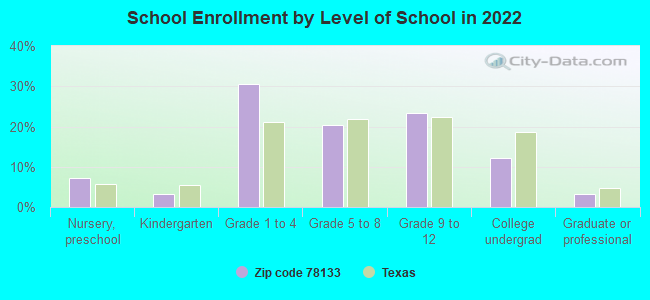
Private vs. public school enrollment:
Students in private schools in grades 1 to 8 (elementary and middle school): 214
Here:
10.6%
Texas:
8.8%
Students in private schools in grades 9 to 12 (high school): 181
Here:
19.3%
Texas:
8.0%
Students in private undergraduate colleges: 97
Here:
20.1%
Texas:
16.2%
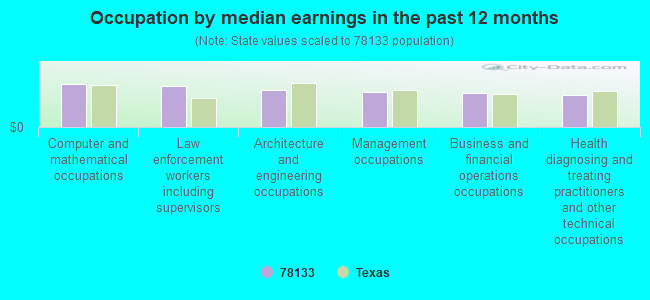
Occupation by median earnings in the past 12 months ($)
104,857Computer and mathematical occupations
101,828Law enforcement workers including supervisors
90,591Architecture and engineering occupations
86,069Management occupations
84,268Business and financial operations occupations
79,376Health diagnosing and treating practitioners and other technical occupations
Companies with biggest federal contracts located in this zip code:
GPS INTEGRATORS, INC (2557 GLENN DRIVE in CANYON LAKE, TX; small business) : $624,462 in 2 contractsfrom 2000 to 2001
$458,272 with Air Force for Miscellaneous Special Industry Machinery. Signed on 2000-09-14. Completion date: 2000-09-01.
$166,190, same as above.Signed on 2001-05-10. Completion date: 2001-05-09.
EAGLE INTEGRATED SOLUTIONS, IN (2557 GLENN DR in NEW BRAUNFELS, TX; small business) : $523,980 in 3 contractsfrom 2002 to 2003
$247,000 with Federal Technology Service for ADP Support Equipment. Signed on 2002-08-15. Completion date: 2003-08-15.
$207,082 with Air Force for Airfield Specialized Trucks and Trailers. Taking place in AK. Signed on 2003-03-17. Completion date: 2003-03-18.
$69,898 with Air Force for Road Clearing, Cleaning and Marking Equipment. Signed on 2002-11-11. Completion date: 2002-12-09.
TEXAS INDUSTRIAL INSTALLATION, (2260 REBECCA CREEK RD in NEW BRAUNFELS, TX; small business) : $47,504 in 4 contractsfrom 2004 to 2006
$27,500 with Navy for Conveyors. Signed on 2004-09-23. Completion date: 2004-10-29.
$9,165 with Army for Prefabricated and Portable Buildings. Signed on 2005-03-31. Completion date: 2005-05-06.
$8,539, same as above.Signed on 2006-05-06. Completion date: 2006-05-26.
$2,300, same as above.Signed on 2005-07-18. Completion date: 2005-09-21.
ALFRED D CARROLL (2140 LAKELAND DR in NEW BRAUNFELS, TX; small business) : $33,375 in 4 contractsfrom 2003 to 2006
$8,400 with Army for Guard Services. Taking place in NC. Signed on 2005-01-06. Completion date: 2005-10-31.
$8,400 with U.S. Army Corps of Engineers - civil program financing only for Guard Services. Taking place in NC. Signed on 2005-01-06. Completion date: 2005-10-31.
$8,400 with U.S. Army Corps of Engineers - civil program financing only for Recreation Site Maintenance Services (non-construction). Signed on 2003-02-24. Completion date: 2003-10-02.
$8,175 with Army for Guard Services. Taking place in NC. Signed on 2006-02-14. Completion date: 2006-10-31.
BODEN, MARY D (1153 MOUNTAINVIEW DR in CANYON LAKE, TX; small business) : $27,392 in 4 contractsfrom 2004 to 2005
$11,000 with Army for Operation of Government-Owned Facilities -- Recreation Facilities (Non-Building). Signed on 2005-02-16. Completion date: 2005-09-30.
$11,000 with U.S. Army Corps of Engineers - civil program financing only for Operation of Government-Owned Facilities -- Recreation Facilities (Non-Building). Signed on 2005-02-16. Completion date: 2005-09-30.
$5,392 with Army for Guard Services. Signed on 2004-03-16. Completion date: 2003-04-01.
$0, same as above.Signed on 2004-03-16. Completion date: 2003-04-01.
COOK, MARTHA L (680 NELSON DR in NEW BRAUNFELS, TX; small business) : $19,615 in 3 contractsfrom 2005 to 2006
$6,715 with Army for Other Housekeeping Services. Signed on 2006-02-13. Completion date: 2006-04-01.
$6,450 with Army for Operation of Government-Owned Facilities -- Other Administrative Facilities and Service Buildings. Signed on 2005-02-25. Completion date: 2006-09-30.
$6,450 with U.S. Army Corps of Engineers - civil program financing only for Operation of Government-Owned Facilities -- Other Administrative Facilities and Service Buildings. Signed on 2005-02-25. Completion date: 2006-09-30.
ROBERT MORAN (1642 FM 2673 1001-10 in NEW BRAUNFELS, TX) : $18,720 in 2 contractsin 2005
$9,360 with U.S. Army Corps of Engineers - civil program financing only for Operation of Government-Owned Facilities -- Other Administrative Facilities and Service Buildings. Signed on 2005-02-16. Completion date: 2006-09-30.
$9,360 with Army for Operation of Government-Owned Facilities -- Other Administrative Facilities and Service Buildings. Signed on 2005-02-16. Completion date: 2006-09-30.
ASHCRAFT, LENORA (4502 SIR ARTHUR WAY #16 in CANYON LAKE, TX; small business) : $17,293 in 2 contractsfrom 2004 to 2006
$8,778 with Army for Guard Services. Signed on 2004-03-16. Completion date: 2004-08-16.
$8,515 with Army for Other Housekeeping Services. Signed on 2006-02-07. Completion date: 2006-04-01.
MARY J COLLINS (102 ELK RIDGE in CANYON LAKE, TX; small business) : $17,227 in 2 contractsfrom 2004 to 2006
$8,712 with Army for Guard Services. Signed on 2004-03-16. Completion date: 2004-08-16.
$8,515 with Army for Other Housekeeping Services. Signed on 2006-02-07. Completion date: 2006-04-01.
MACLER, PETER E ASSOCIATES (1347 GRAND PASS in NEW BRAUNFELS, TX; small business) : $14,911 in 2 contractsfrom 2004 to 2005
$24,900 with Army for Maintenance, Repair and Rebuilding of Equipment -- Furnace, Steam Plant, and Drying Equipment; and Nuclear Reactors. Signed on 2004-11-16. Completion date: 2004-12-30.
-$9,989, same as above.Signed on 2005-09-22. Completion date: 2004-12-30.
Top industries in this zip code by the number of employees in 2005:
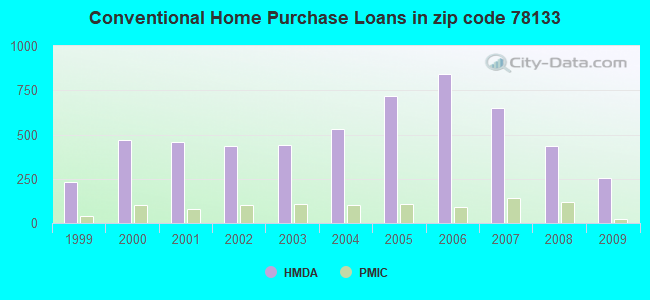
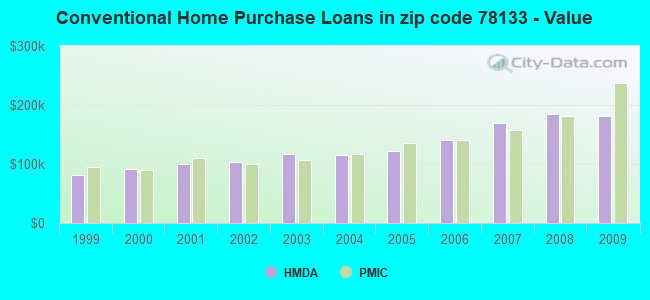
Detailed PMIC statistics for the following Tracts:3106.01
, 3106.02
2002 - 2018 National Fire Incident Reporting System (NFIRS) incidents
Based on the data from the years 2002 - 2018 the average number of fires per year is 95. The highest number of reported fire incidents - 197 took place in 2011, and the least - 5 in 2009. The data has a rising trend.
When looking into fire subcategories, the most reports belonged to: Outside Fires (58.1%), and Structure Fires (28.5%).
Fire incident types reported to NFIRS in Zip Code 78133


 Nearest zip codes: 78623, 78132, 78070, 78676, 78163, 78261.


 Based on the data from the years 2002 - 2018 the average number of fires per year is 95. The highest number of reported fire incidents - 197 took place in 2011, and the least - 5 in 2009. The data has a rising trend.
 When looking into fire subcategories, the most reports belonged to: Outside Fires (58.1%), and Structure Fires (28.5%).