Estimated zip code population in 2022: 38,120 Zip code population in 2010: 31,917 Zip code population in 2000: 28,194
Houses and condos: 15,624 Renter-occupied apartments: 7,783
% of renters here:
52%
State:
38%
March 2022 cost of living index in zip code 78218: 87.6 (less than average, U.S. average is 100)
Land area: 11.8 sq. mi. Water area: 0.0 sq. mi.
Population density: 3,224 people per square mile
(average).
OSM Map
General Map
Google Map
MSN Map
OSM Map
General Map
Google Map
MSN Map
OSM Map
General Map
Google Map
MSN Map
OSM Map
General Map
Google Map
MSN Map
Please wait while loading the map...
Real estate property taxes paid for housing units in 2022:
This zip code:
1.7% ($3,163)
Texas:
1.5% ($4,050)
Median real estate property taxes paid for housing units with mortgages in 2022: $3,550 (1.8%) Median real estate property taxes paid for housing units with no mortgage in 2022: $2,058 (1.1%)
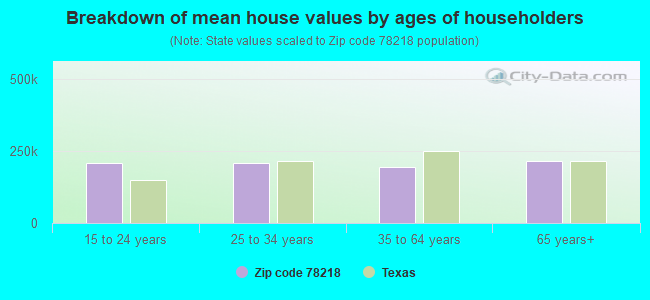
Estimated median house/condo value in 2022: $191,391
78218:
$191,391
Texas:
$275,400
According to our research of Texas and other state lists, there were 93 registered sex offenders living in 78218 zip code as of April 25, 2024. The ratio of all residents to sex offenders in zip code 78218 is 383 to 1. The ratio of registered sex offenders to all residents in this zip code is near the state average.
Median resident age:
This zip code:
36.5 years
Texas median age:
35.6 years
Average household size:
This zip code:
2.5 people
Texas:
2.6 people
Averages for the 2020 tax year for zip code 78218, filed in 2021:
Average Adjusted Gross Income (AGI) in 2020: $45,114 (Individual Income Tax Returns)
Here:
$45,114
State:
$77,054
Salary/wage: $37,064 (reported on 82.1% of returns)
Here:
$37,064
State:
$62,766
(% of AGI for various income ranges: 1176.9% for AGIs below $25k, 3500.6% for AGIs $25k-50k, 6344.1% for AGIs $50k-75k, 9448.7% for AGIs $75k-100k, 14583.8% for AGIs $100k-200k, 68348.6% for AGIs over 200k)
Taxable interest for individuals: $1,631 (reported on 15.4% of returns)
This zip code:
$1,631
Texas:
$2,665
(% of AGI for various income ranges: 5.8% for AGIs below $25k, 10.2% for AGIs $25k-50k, 22.5% for AGIs $50k-75k, 86.1% for AGIs $75k-100k, 170.4% for AGIs $100k-200k, 2405.7% for AGIs over 200k)
Ordinary dividends: $9,280 (reported on 7.9% of returns)
Here:
$9,280
State:
$10,044
(% of AGI for various income ranges: 7.3% for AGIs below $25k, 13.9% for AGIs $25k-50k, 43.1% for AGIs $50k-75k, 113.2% for AGIs $75k-100k, 605.2% for AGIs $100k-200k, 10084.3% for AGIs over 200k)
Net capital gain/loss in AGI: +$19,255 (reported on 7.9% of returns)
Here:
+$19,255
State:
+$39,590
(% of AGI for various income ranges: 1.0% for AGIs below $25k, 13.4% for AGIs $25k-50k, 41.0% for AGIs $50k-75k, 148.6% for AGIs $75k-100k, 839.8% for AGIs $100k-200k, 28007.1% for AGIs over 200k)
Profit/loss from business: +$9,705 (reported on 18.5% of returns)
Here:
+$9,705
State:
+$10,888
(% of AGI for various income ranges: 177.1% for AGIs below $25k, 150.9% for AGIs $25k-50k, 210.4% for AGIs $50k-75k, 241.4% for AGIs $75k-100k, 515.8% for AGIs $100k-200k, 8112.9% for AGIs over 200k)
Taxable individual retirement arrangement distribution: $18,611 (reported on 4.4% of returns)
78218:
$18,611
Texas:
$24,740
(% of AGI for various income ranges: 16.1% for AGIs below $25k, 33.1% for AGIs $25k-50k, 101.9% for AGIs $50k-75k, 199.7% for AGIs $75k-100k, 848.7% for AGIs $100k-200k, 5878.6% for AGIs over 200k)
Self-employed (Keogh) retirement plans: $34,100 (reported on 0.1% of returns)
78218:
$34,100
Texas:
$29,298
(% of AGI for various income ranges: 39.7% for AGIs $50k-75k)
Total itemized deductions: $34,259 (reported on 3.6% of returns)
Here:
$34,259
State:
$40,428
(% of AGI for various income ranges: 16.7% for AGIs below $25k, 79.7% for AGIs $25k-50k, 217.1% for AGIs $50k-75k, 272.9% for AGIs $75k-100k, 810.0% for AGIs $100k-200k, 10121.4% for AGIs over 200k)
Charity contributions: $13,817 (reported on 3.1% of returns)
Here:
$13,817
State:
$18,201
(% of AGI for various income ranges: 2.7% for AGIs below $25k, 14.2% for AGIs $25k-50k, 43.9% for AGIs $50k-75k, 74.2% for AGIs $75k-100k, 211.9% for AGIs $100k-200k, 6108.6% for AGIs over 200k)
Taxes paid: $6,690 (reported on 3.5% of returns)
78218:
$6,690
State:
$7,821
(% of AGI for various income ranges: 3.7% for AGIs below $25k, 13.9% for AGIs $25k-50k, 43.0% for AGIs $50k-75k, 64.8% for AGIs $75k-100k, 186.5% for AGIs $100k-200k, 1518.6% for AGIs over 200k)
Earned income credit: $2,601 (reported on 28.4% of returns)
Here:
$2,601
State:
$2,584
(% of AGI for various income ranges: 143.5% for AGIs below $25k, 91.2% for AGIs $25k-50k, 2.2% for AGIs $50k-75k)
Percentage of individuals using paid preparers for their 2020 taxes: 91.7%
Here:
92%
State:
92%
(% for various income ranges: 90.0% for AGIs below $25k, 93.3% for AGIs $25k-50k, 92.4% for AGIs $50k-75k, 91.9% for AGIs $75k-100k, 93.2% for AGIs $100k-200k, 92.6% for AGIs over 200k)
Averages for the 2012 tax year for zip code 78218, filed in 2013:
Average Adjusted Gross Income (AGI) in 2012: $40,452 (Individual Income Tax Returns)
Here:
$40,452
State:
$65,384
Salary/wage: $32,079 (reported on 83.2% of returns)
Here:
$32,079
State:
$52,524
(% of AGI for various income ranges: 78.7% for AGIs below $25k, 84.4% for AGIs $25k-50k, 75.6% for AGIs $50k-75k, 68.2% for AGIs $75k-100k, 56.2% for AGIs $100k-200k, 35.3% for AGIs over 200k)
Taxable interest for individuals: $1,844 (reported on 18.5% of returns)
This zip code:
$1,844
Texas:
$2,372
(% of AGI for various income ranges: 0.6% for AGIs below $25k, 0.4% for AGIs $25k-50k, 0.7% for AGIs $50k-75k, 1.3% for AGIs $75k-100k, 1.3% for AGIs $100k-200k, 1.2% for AGIs over 200k)
Ordinary dividends: $8,268 (reported on 9.0% of returns)
Here:
$8,268
State:
$9,721
(% of AGI for various income ranges: 0.5% for AGIs below $25k, 0.5% for AGIs $25k-50k, 1.3% for AGIs $50k-75k, 1.2% for AGIs $75k-100k, 2.8% for AGIs $100k-200k, 4.3% for AGIs over 200k)
Net capital gain/loss in AGI: +$20,768 (reported on 6.8% of returns)
Here:
+$20,768
State:
+$35,319
(% of AGI for various income ranges: 0.1% for AGIs $25k-50k, 0.2% for AGIs $50k-75k, 0.7% for AGIs $75k-100k, 2.1% for AGIs $100k-200k, 13.4% for AGIs over 200k)
Profit/loss from business: +$12,135 (reported on 15.8% of returns)
Here:
+$12,135
State:
+$13,732
(% of AGI for various income ranges: 10.9% for AGIs below $25k, 2.5% for AGIs $25k-50k, 1.9% for AGIs $50k-75k, 2.5% for AGIs $75k-100k, 4.8% for AGIs $100k-200k, 5.1% for AGIs over 200k)
Taxable individual retirement arrangement distribution: $12,442 (reported on 6.1% of returns)
78218:
$12,442
Texas:
$19,511
(% of AGI for various income ranges: 1.0% for AGIs below $25k, 1.1% for AGIs $25k-50k, 2.2% for AGIs $50k-75k, 3.1% for AGIs $75k-100k, 4.4% for AGIs $100k-200k, 1.4% for AGIs over 200k)
Self-employment retirement plans: $23,650 (reported on 0.3% of returns)
78218:
$23,650
Texas:
$23,938
Total itemized deductions: $22,711 (17% of AGI, reported on 11.7% of returns)
Here:
$22,711
State:
$24,724
Here:
17.4% of AGI
State:
15.9% of AGI
(% of AGI for various income ranges: 3.3% for AGIs below $25k, 5.5% for AGIs $25k-50k, 7.2% for AGIs $50k-75k, 6.9% for AGIs $75k-100k, 9.1% for AGIs $100k-200k, 8.4% for AGIs over 200k)
Charity contributions: $7,853 (reported on 8.8% of returns)
Here:
$7,853
State:
$6,808
(% of AGI for various income ranges: 0.2% for AGIs below $25k, 0.7% for AGIs $25k-50k, 1.1% for AGIs $50k-75k, 1.2% for AGIs $75k-100k, 2.4% for AGIs $100k-200k, 4.1% for AGIs over 200k)
Taxes paid: $5,913 (reported on 11.2% of returns)
78218:
$5,913
State:
$6,921
(% of AGI for various income ranges: 0.6% for AGIs below $25k, 1.1% for AGIs $25k-50k, 1.7% for AGIs $50k-75k, 1.8% for AGIs $75k-100k, 3.2% for AGIs $100k-200k, 2.2% for AGIs over 200k)
Earned income credit: $2,610 (reported on 34.3% of returns)
Here:
$2,610
State:
$2,570
(% of AGI for various income ranges: 10.4% for AGIs below $25k, 1.7% for AGIs $25k-50k)
Percentage of individuals using paid preparers for their 2012 taxes: 45.0%
Here:
45%
State:
51%
(% for various income ranges: 45.3% for AGIs below $25k, 40.5% for AGIs $25k-50k, 45.9% for AGIs $50k-75k, 46.7% for AGIs $75k-100k, 56.0% for AGIs $100k-200k, 81.8% for AGIs over 200k)
Averages for the 2004 tax year for zip code 78218, filed in 2005:
Average Adjusted Gross Income (AGI) in 2004: $34,138 (Individual Income Tax Returns)
Here:
$34,138
State:
$47,881
Salary/wage: $28,637 (reported on 83.0% of returns)
Here:
$28,637
State:
$41,947
(% of AGI for various income ranges: 92.8% for AGIs below $10k, 81.0% for AGIs $10k-25k, 80.7% for AGIs $25k-50k, 73.4% for AGIs $50k-75k, 68.2% for AGIs $75k-100k, 47.5% for AGIs over 100k)
Taxable interest for individuals: $2,195 (reported on 27.4% of returns)
This zip code:
$2,195
Texas:
$2,255
(% of AGI for various income ranges: 2.9% for AGIs below $10k, 1.0% for AGIs $10k-25k, 1.2% for AGIs $25k-50k, 1.6% for AGIs $50k-75k, 2.2% for AGIs $75k-100k, 2.6% for AGIs over 100k)
Taxable dividends: $3,657 (reported on 12.6% of returns)
Here:
$3,657
State:
$4,261
(% of AGI for various income ranges: 1.3% for AGIs below $10k, 0.5% for AGIs $10k-25k, 0.6% for AGIs $25k-50k, 1.2% for AGIs $50k-75k, 1.5% for AGIs $75k-100k, 2.6% for AGIs over 100k)
Net capital gain/loss: +$11,444 (reported on 9.5% of returns)
Here:
+$11,444
State:
+$16,110
(% of AGI for various income ranges: 0.1% for AGIs below $10k, -0.2% for AGIs $10k-25k, 0.3% for AGIs $25k-50k, 0.6% for AGIs $50k-75k, 0.9% for AGIs $75k-100k, 10.6% for AGIs over 100k)
Profit/loss from business: +$10,597 (reported on 12.9% of returns)
Here:
+$10,597
State:
+$11,013
(% of AGI for various income ranges: 7.3% for AGIs below $10k, 5.3% for AGIs $10k-25k, 2.1% for AGIs $25k-50k, 1.7% for AGIs $50k-75k, 2.6% for AGIs $75k-100k, 6.5% for AGIs over 100k)
IRA payment deduction: $2,948 (reported on 1.8% of returns)
78218:
$2,948
Texas:
$3,120
(% of AGI for various income ranges: 0.1% for AGIs $10k-25k, 0.2% for AGIs $25k-50k, 0.2% for AGIs $50k-75k, 0.2% for AGIs $75k-100k, 0.1% for AGIs over 100k)
Self-employed pension: $17,061 (reported on 0.4% of returns)
Here:
$17,061
Texas:
$16,401
Total itemized deductions: $17,153 (19% of AGI, reported on 12.7% of returns)
Here:
$17,153
State:
$19,631
Here:
18.6% of AGI
State:
18.9% of AGI
(% of AGI for various income ranges: 4.3% for AGIs below $10k, 3.3% for AGIs $10k-25k, 5.5% for AGIs $25k-50k, 6.7% for AGIs $50k-75k, 8.5% for AGIs $75k-100k, 8.6% for AGIs over 100k)
Charity contributions deductions: $4,246 (4% of AGI, reported on 10.3% of returns)
Here:
$4,246
State:
$4,753
Here:
4.1% of AGI
State:
4.2% of AGI
(% of AGI for various income ranges: 0.3% for AGIs below $10k, 0.4% for AGIs $10k-25k, 0.8% for AGIs $25k-50k, 1.4% for AGIs $50k-75k, 2.0% for AGIs $75k-100k, 2.1% for AGIs over 100k)
Total tax: $5,995 (reported on 65.3% of returns)
78218:
$5,995
State:
$9,058
(% of AGI for various income ranges: 2.7% for AGIs below $10k, 3.5% for AGIs $10k-25k, 6.7% for AGIs $25k-50k, 9.8% for AGIs $50k-75k, 12.0% for AGIs $75k-100k, 22.8% for AGIs over 100k)
Earned income credit: $1,959 (reported on 29.7% of returns)
Here:
$1,959
State:
$2,024
Percentage of individuals using paid preparers for their 2004 taxes: 56.9%
Here:
57%
State:
57%
(% for various income ranges: 58.2% for AGIs below $10k, 60.1% for AGIs $10k-25k, 52.3% for AGIs $25k-50k, 52.3% for AGIs $50k-75k, 52.6% for AGIs $75k-100k, 66.7% for AGIs over 100k)
Likely homosexual households (counted as self-reported same-sex unmarried-partner households)
Lesbian couples: 0.2% of all households
Gay men: 0.0% of all households
Household received Food Stamps/SNAP in the past 12 months: 2,942 Household did not receive Food Stamps/SNAP in the past 12 months: 12,012
Women who had a birth in the past 12 months: 520 (247 now married, 265 unmarried) Women who did not have a birth in the past 12 months: 8,277 (3,621 now married, 4,657 unmarried)
Housing units in zip code 78218 with a mortgage: 4,450 (287 second mortgage, 279 both second mortgage and home equity loan) Median monthly owner costs for units with a mortgage: $1,381 Median monthly owner costs for units without a mortgage: $550
Residents with income below the poverty level in 2022:
This zip code:
20.3%
Whole state:
14.0%
Residents with income below 50% of the poverty level in 2022:
This zip code:
10.2%
Whole state:
7.4%
Median number of rooms in houses and condos:
Here:
6.1
State:
6.3
Median number of rooms in apartments:
Here:
3.9
State:
4.0
Notable locations in this zip code not listed on our city pages
Notable locations in zip code 78218: Children's World Learning Center (A), Eisenhauer Road Baptist Day Care Center (B), San Antonio Fire Department Station 24 (C), Gemini Ambulance Service (D), San Antonio Fire Department Station 38 (E). Display/hide their locations on the map
Churches in zip code 78218 include: Iglesia de Dios Lanark Church (A), Episcopal Church of the Resurrection (B), Pentecostals of San Antonio Church (C), United Methodist Church Albright (D), First Korean Presbyterian Church (E), North East Community Church of God (F), Maranatha Baptist Church (G), Faith Missionary Baptist Church (H), True Vision Baptist Church (I). Display/hide their locations on the map
Parks in zip code 78218 include: Rittiman Creek Park (1), Salado Park (2), Dawson Massacre Historical Monument (3), James Park (4), Wilshire Terrace Park (5). Display/hide their locations on the map
Tourist attractions (not listed on the city page) : Water World No 2 (Water Parks & Slides; 1518 Austin Highway), Dallas City - Departmental Listings- Dallas-Arboretum & Botanical Soc (Cultural Attractions- Events- & Facilities; 8585 South Garland Road), Amf Bowling Centers - Amf Wonder Lanes (Amusement & Theme Parks; 1948 Austin Highway).
4,506 married couples with children.
2,713 single-parent households (627 men, 2,086 women).
60.1% of residents of 78218 zip code speak English at home.
34.7% of residents speak Spanish at home (64% very well, 15% well, 12% not well, 9% not at all).
1.4% of residents speak other Indo-European language at home (89% very well, 7% well, 4% not well).
2.7% of residents speak Asian or Pacific Island language at home (29% very well, 27% well, 41% not well, 2% not at all).
1.0% of residents speak other language at home (59% very well, 23% not well, 18% not at all).
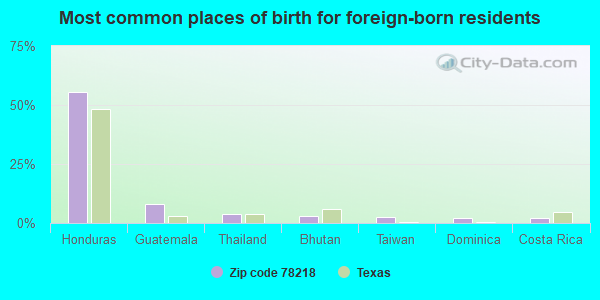
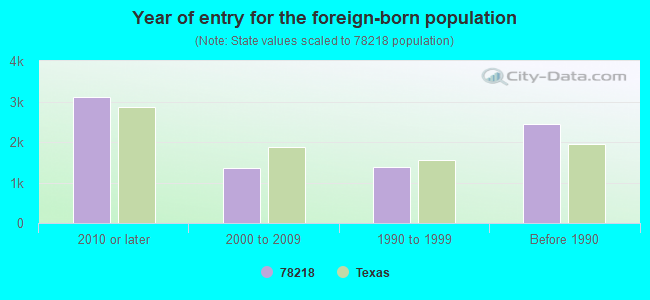
Foreign born population: 6,468 (17.0%) (46.9% of them are naturalized citizens)
Facilities with environmental interests located in this zip code:
ALAMO TRANSFORMER SUPPLY COMPANY (4931 SPACE CTR DR in SAN ANTONIO, TX)
COMPLIANCE ACTIVITY (Tracking inspections of insecticide, fungicide, and rodenticide, and toxic substances) Large Quantity Generators, more that 1000 kg of hazardous waste/month (Resource Conservation and Recovery Act (tracking hazardous waste)) TRANSPORTER (Resource Conservation and Recovery Act (tracking hazardous waste)) - notification Business SIC classification: POWER, DISTRIBUTION, AND SPECIALTY TRANSFORMERS; ELECTRICAL AND ELECTRONIC REPAIR SHOPS
AUTOMOTIVE HUBCAPS & ACCESSORIES (TXU010714) (2220 AUSTIN HWY. in SAN ANTONIO, TX)
BUTTERKRUST BAKERY, INC. (6000 N.E. LOOP 410 in SAN ANTONIO, TX)
AIR MINOR (AIRS/AFS) Business SIC classification: BREAD AND OTHER BAKERY PRODUCTS, EXCEPT COOKIES AND CRACKERS; GROCERIES AND RELATED PRODUCTS Alternative names: FLOWERS BAKERY DBA BUTTERCRUST BAKERY
BAKER SUPPLY PRODUCTS (6110 RITTIMAN RD. in SAN ANTONIO, TX)
Large Quantity Generators, more that 1000 kg of hazardous waste/month (Resource Conservation and Recovery Act (tracking hazardous waste)) TRI REPORTER (Tracking of toxic chemicals releasing facilities) Business SIC classification: ADHESIVES AND SEALANTS Business NAICS classification: ALL OTHER MISCELLANEOUS MANUFACTURING. Organizations: ARLON VISCOR LTD (CONTACT/OPERATOR)
Alternative names: ARLON ENGINEERED COATED PRODUCTS
ALAMO FIREWORKS CO (10192 IH 10 EAST (PO BOX 18264) in SAN ANTONIO, TX)
COMPLIANCE ACTIVITY (Tracking inspections of insecticide, fungicide, and rodenticide, and toxic substances) Business SIC classification: TOYS AND HOBBY GOODS AND SUPPLIES
Housing units lacking complete plumbing facilities: 0.7% Housing units lacking complete kitchen facilities: 1.1%
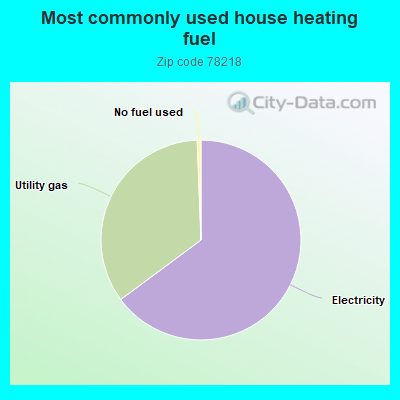
64.6%Electricity
34.4%Utility gas
0.6%No fuel used
Population in 1990: 29,276.
Place of birth for U.S.-born residents:
This state: 19,696
Northeast: 1,276
Midwest: 2,835
South: 2,551
West: 3,650
50% of the 78218 zip code residents lived in the same house 5 years ago. Out of people who lived in different houses, 71% lived in this county. Out of people who lived in different counties, 50% lived in Texas.
87% of the 78218 zip code residents lived in the same house 1 year ago. Out of people who lived in different houses, 62% moved from this county. Out of people who lived in different houses, 10% moved from different county within same state. Out of people who lived in different houses, 21% moved from different state. Out of people who lived in different houses, 5% moved from abroad.
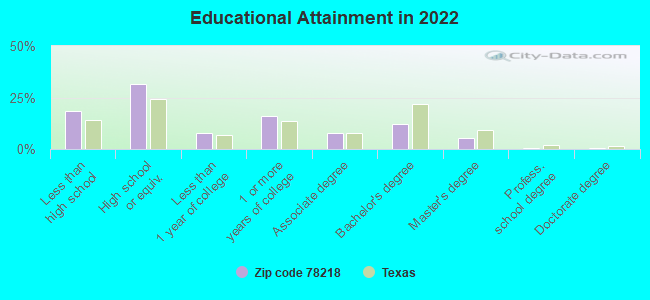
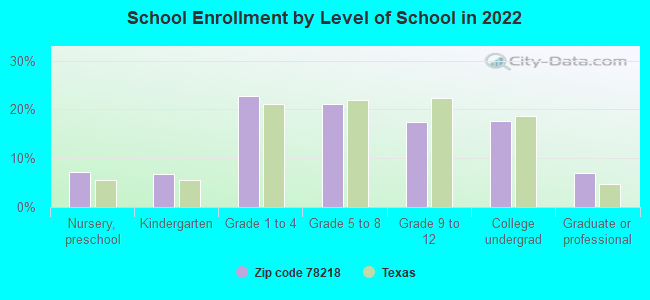
Private vs. public school enrollment:
Students in private schools in grades 1 to 8 (elementary and middle school): 155
Here:
4.2%
Texas:
8.8%
Students in private schools in grades 9 to 12 (high school): 140
Here:
9.5%
Texas:
8.0%
Students in private undergraduate colleges: 420
Here:
28.1%
Texas:
16.2%
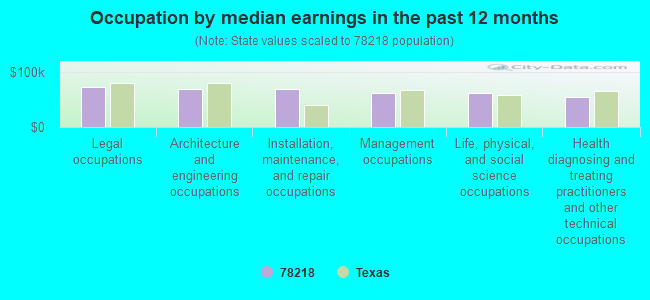
Occupation by median earnings in the past 12 months ($)
73,541Legal occupations
69,997Architecture and engineering occupations
69,024Installation, maintenance, and repair occupations
62,036Management occupations
61,342Life, physical, and social science occupations
55,672Health diagnosing and treating practitioners and other technical occupations
Companies with biggest federal contracts located in this zip code (SAN ANTONIO, TX):
CRV INC (3407 NRTHAST PKWY STE 170; small business) 21 employees, $7304227 revenue. Veteran Owned Business: $23,365,325 in 125 contractsfrom 1999 to 2006
Contracts for ADPE System Configuration, ADP Facility Operation and Maintenance Services, ADP Systems Development Services, Engineering and Technical Services, and moreby Federal Technology Service, Office of Policy, Management and Budget/Chief Financial Officer, Minerals Management Service, Air Force, and others Signed by year:2000: $4,792,250; 2001: $12,026,079; 2002: $1,545,029; 2003: $1,906,325; 2004: $2,572,744; 2005: $160,672; 2006: $81,226.
Biggest contracts:
$1,899,000 with Federal Technology Service for ADPE System Configuration. Signed on 2001-03-15. Completion date: 2001-04-15.
$1,508,000 with Federal Technology Service for ADP Facility Operation and Maintenance Services. Signed on 2001-02-15. Completion date: 2001-04-15.
$1,312,000, same as above.Signed on 2000-12-15. Completion date: 2001-01-15.
$1,080,000 with Office of Policy, Management and Budget/Chief Financial Officer for ADP Systems Development Services. Signed on 2001-11-15. Completion date: 2002-12-15.
SC&A, INC (1800 NE LOOP 410 SUITE 411; small business) : $10,297,866 in 54 contractsfrom 2002 to 2006
Contracts for ADP Facility Operation and Maintenance Services, ADP Support Equipment, Automated Information System Design and Integration Services, Surveillance Services, and moreby Immediate Office of the Secretary of Transportation, Federal Technology Service, Army, Minerals Management Service, and others Signed by year:2000: $0; 2001: $0; 2002: $3,577,000; 2003: $180,128; 2004: $3,113,551; 2005: $3,100,165; 2006: $327,022.
Biggest contracts:
$3,577,000 with Immediate Office of the Secretary of Transportation for ADP Facility Operation and Maintenance Services. Signed on 2002-11-15. Completion date: 2007-11-15.
$1,251,032 with Federal Technology Service for ADP Support Equipment. Signed on 2005-09-23. Completion date: 2005-11-21.
$760,099 with Army for Automated Information System Design and Integration Services. Signed on 2005-08-10. Completion date: 2005-08-14.
$738,461, same as above.Signed on 2004-08-26. Completion date: 2005-08-14.
PEPSI COLA METRO (6100 NE LOOP 410) : $5,881,803 in 22 contractsfrom 2002 to 2006
Contracts for Food Items For Resale, Beverages, Nonalcoholic by Department of Defense, Defense Commissary Agency, Army Signed by year:2000: $0; 2001: $0; 2002: $2,725,220; 2003: $1,134,762; 2004: $1,919,211; 2005: $102,610; 2006: $0.
Biggest contracts:
$1,547,591 with Department of Defense for Food Items For Resale. Signed on 2002-01-01. Completion date: 2002-08-31.
$1,177,629, same as above.Signed on 2002-10-01. Completion date: 2003-05-31.
$489,318, same as above.Signed on 2003-05-01. Completion date: 2003-05-31.
$387,883 with Defense Commissary Agency for Food Items For Resale. Signed on 2004-02-01. Completion date: 2004-03-31.
SANDOVAL PLUMBING REPAIR INC (4750 CENTER PARK BLVD; small business) : $4,105,538 in 22 contractsfrom 2001 to 2006
Contracts for Construction of Structures and Facilities -- Miscellaneous Buildings, Maintenance, Repair or Alteration of Real Property -- Miscellaneous Buildings, Maintenance, Repair or Alteration of Real Property -- Other Warehouse Buildings by Army, Air Force Signed by year:2000: $0; 2001: $9,450; 2002: $3,975,730; 2003: $21,623; 2004: $13,281; 2005: $0; 2006: $85,454.
Biggest contracts:
$1,977,319 with Army for Construction of Structures and Facilities -- Miscellaneous Buildings. Signed on 2002-12-05. Completion date: 2003-06-16.
$1,977,319, same as above.Signed on 2002-06-20. Completion date: 2003-04-30.
$85,454, same as above.Signed on 2006-03-07. Completion date: 2005-09-30.
$21,092 with Army for Maintenance, Repair or Alteration of Real Property -- Miscellaneous Buildings. Signed on 2002-07-11. Completion date: 2002-07-08.
LONE STAR RELOCATION SERVICES, (7801 IH 35 NORTH; small business) : $3,308,384 in 10 contractsfrom 2002 to 2006
Contracts for Packing/Crating Services by Air Force Signed by year:2000: $0; 2001: $0; 2002: $494,979; 2003: $885,359; 2004: $920,232; 2005: $0; 2006: $1,007,814.
Biggest contracts:
$1,007,814 with Air Force for Packing/Crating Services. Signed on 2006-01-01. Completion date: 2006-12-31.
$920,232, same as above.Signed on 2004-01-01. Completion date: 2004-12-31.
$442,364, same as above.Signed on 2003-05-16. Completion date: 2003-12-31.
$345,859, same as above.Signed on 2003-12-23. Completion date: 2003-12-31.
WILFRED BAKER ENGINEERING, INC (3330 OAKWELL COURT, SUITE; small business) : $2,203,601 in 48 contractsfrom 2000 to 2006
Contracts for Other Defense -- Basic Research (R&D), Other Research and Development -- Applied Research and Exploratory Development (R&D), Other Architect and Engineering Services, Engineering and Technical Services, and moreby Navy, Army, Department of State, Bureau of the Public Debt, and others Signed by year:2000: $363,998; 2001: $139,748; 2002: $218,007; 2003: $773,681; 2004: $261,868; 2005: $394,007; 2006: $52,292.
Biggest contracts:
$262,160 with Navy for Other Defense -- Basic Research (R&D). Signed on 2003-08-26. Completion date: 2004-08-26.
$203,998 with Army for Other Research and Development -- Applied Research and Exploratory Development (R&D). Signed on 2000-03-07. Completion date: 2000-12-29.
$111,100, same as above.Signed on 2000-03-24. Completion date: 2000-07-31.
$104,269 with Army for Other Architect and Engineering Services. Signed on 2002-09-16. Completion date: 2003-03-31.
MULTILINK SECURITY INC (2800 N E LOOP 410, SUITE; small business) : $984,877 in 10 contractsfrom 1999 to 2004
Contracts for Maintenance, Repair and Rebuilding of Equipment -- Alarm, Signal, and Security Detection Systems, Construction of Structures and Facilities -- Electronic and Communications Facilities, Miscellaneous Alarm, Signal and Security Detection Systems, Communications Security Equipment and Components by Army Signed by year:2000: $236,094; 2001: $0; 2002: $424,632; 2003: $102,261; 2004: $14,756; 2005: $0; 2006: $0.
Biggest contracts:
$384,657 with Army for Maintenance, Repair and Rebuilding of Equipment -- Alarm, Signal, and Security Detection Systems. Signed on 2002-11-19. Completion date: 2003-10-01.
$236,094 with Army for Construction of Structures and Facilities -- Electronic and Communications Facilities. Signed on 2000-10-30. Completion date: 2000-10-01.
$207,134, same as above.Signed on 1999-10-15. Completion date: 1999-09-30.
$57,419 with Army for Maintenance, Repair and Rebuilding of Equipment -- Alarm, Signal, and Security Detection Systems. Signed on 2003-11-21. Completion date: 2003-12-31.
HERMAN MILLER WORKPLACE RESOUR (4400 NE LOOP 410) : $649,516 in 27 contractsfrom 2000 to 2006
Contracts for Office Furniture, Architect - Engineer Services (including landscaping, interior layout, and designing), Motor Charter for Things, Miscellaneous Furniture and Fixtures, and moreby Department of Veterans Affairs, Air Force, Army, Public Buildings Service, and others Signed by year:2000: $73,090; 2001: $77,595; 2002: $195,302; 2003: $0; 2004: $232,960; 2005: $70,569; 2006: $0.
Biggest contracts:
$133,902 with Department of Veterans Affairs for Office Furniture. Taking place in OH. Signed on 2004-09-03. Completion date: 2004-12-23.
$87,936 with Air Force for Office Furniture. Signed on 2002-06-21. Completion date: 2002-06-21.
$77,595 with Air Force for Architect - Engineer Services (including landscaping, interior layout, and designing). Signed on 2001-09-20. Completion date: 2001-10-31.
$73,090 with Air Force for Motor Charter for Things. Signed on 2000-09-22. Completion date: 2000-10-29.
CANVAS SPECIALTIES INC (5923 DISTRIBUTION) : $646,535 in 10 contractsfrom 2002 to 2005
Contracts for Medical and Surgical Instruments, Equipment, and Supplies by Defense Logistics Agency, Army Signed by year:2000: $0; 2001: $0; 2002: $85,000; 2003: $115,500; 2004: $349,249; 2005: $96,786; 2006: $0.
Biggest contracts:
$190,300 with Defense Logistics Agency for Medical and Surgical Instruments, Equipment, and Supplies. Taking place in MO. Signed on 2004-10-01. Completion date: 2004-10-27.
$115,500 with Army for Medical and Surgical Instruments, Equipment, and Supplies. Signed on 2003-02-05. Completion date: 2002-05-31.
$90,000 with Defense Logistics Agency for Medical and Surgical Instruments, Equipment, and Supplies. Taking place in MO. Signed on 2004-12-13. Completion date: 2005-01-02.
$85,000 with Army for Medical and Surgical Instruments, Equipment, and Supplies. Signed on 2002-04-26. Completion date: 2002-05-31.
HEALTH FACILITY SOLUTIONS CO (124 OAKWELL FARMS PKWY; small business) : $310,354 in 4 contractsfrom 2005 to 2006
$106,894 with Army for Other Professional Services. Signed on 2006-06-22. Completion date: 2007-06-21.
$100,000 with Army for Policy Review/Development Services. Taking place in GA. Signed on 2006-02-03. Completion date: 2007-01-22.
$93,460 with Army for Other Management Support Services. Taking place in GA. Signed on 2005-07-19. Completion date: 2006-08-19.
$10,000, same as above.Signed on 2006-05-31. Completion date: 2006-08-19.
Top industries in this zip code by the number of employees in 2005:
Administrative and Support and Waste Management and Remediation Services: Janitorial Services (over 1000 employees: 1 establishment, 100-249 employees: 1 establishment, 1-4 employees: 3 establishments)
2002 - 2018 National Fire Incident Reporting System (NFIRS) incidents
Based on the data from the years 2002 - 2018 the average number of fires per year is 115. The highest number of fire incidents - 171 took place in 2002, and the least - 9 in 2008. The data has a dropping trend.
When looking into fire subcategories, the most reports belonged to: Outside Fires (43.8%), and Mobile Property/Vehicle Fires (25.0%).
Fire incident types reported to NFIRS in Zip Code 78218


 Nearest zip codes: 78219, 78239, 78234, 78217, 78244, 78209.


 Based on the data from the years 2002 - 2018 the average number of fires per year is 115. The highest number of fire incidents - 171 took place in 2002, and the least - 9 in 2008. The data has a dropping trend.
 When looking into fire subcategories, the most reports belonged to: Outside Fires (43.8%), and Mobile Property/Vehicle Fires (25.0%).