Estimated zip code population in 2022: 16,044 Zip code population in 2010: 7,372 Zip code population in 2000: 3,960
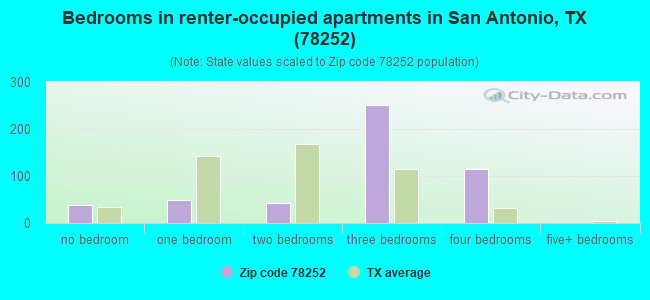
Houses and condos: 5,064 Renter-occupied apartments: 492
% of renters here:
10%
State:
38%
March 2022 cost of living index in zip code 78252: 88.2 (less than average, U.S. average is 100)
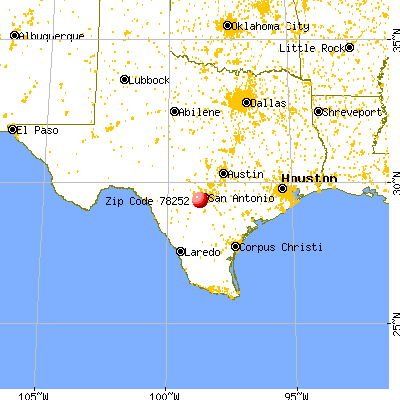
Land area: 34.6 sq. mi. Water area: 0.8 sq. mi.
Population density: 464 people per square mile
(low).
OSM Map
General Map
Google Map
MSN Map
OSM Map
General Map
Google Map
MSN Map
OSM Map
General Map
Google Map
MSN Map
OSM Map
General Map
Google Map
MSN Map
Please wait while loading the map...
Real estate property taxes paid for housing units in 2022:
This zip code:
1.6% ($4,121)
Texas:
1.5% ($4,050)
Median real estate property taxes paid for housing units with mortgages in 2022: $4,433 (1.7%) Median real estate property taxes paid for housing units with no mortgage in 2022: $3,337 (1.5%)
Averages for the 2020 tax year for zip code 78252, filed in 2021:
Average Adjusted Gross Income (AGI) in 2020: $47,180 (Individual Income Tax Returns)
Here:
$47,180
State:
$77,054
Salary/wage: $45,701 (reported on 92.5% of returns)
Here:
$45,701
State:
$62,766
(% of AGI for various income ranges: 1290.4% for AGIs below $25k, 3848.6% for AGIs $25k-50k, 6573.9% for AGIs $50k-75k, 9699.2% for AGIs $75k-100k, 14821.0% for AGIs $100k-200k)
Taxable interest for individuals: $292 (reported on 8.8% of returns)
This zip code:
$292
Texas:
$2,665
(% of AGI for various income ranges: 1.8% for AGIs below $25k, 1.2% for AGIs $25k-50k, 2.7% for AGIs $50k-75k, 5.7% for AGIs $75k-100k, 16.4% for AGIs $100k-200k)
Ordinary dividends: $942 (reported on 4.3% of returns)
Here:
$942
State:
$10,044
(% of AGI for various income ranges: 1.6% for AGIs below $25k, 0.7% for AGIs $25k-50k, 4.7% for AGIs $50k-75k, 0.9% for AGIs $75k-100k, 50.2% for AGIs $100k-200k)
Net capital gain/loss in AGI: +$3,890 (reported on 5.0% of returns)
Here:
+$3,890
State:
+$39,590
(% of AGI for various income ranges: 1.0% for AGIs below $25k, 2.6% for AGIs $25k-50k, 10.4% for AGIs $50k-75k, 12.9% for AGIs $75k-100k, 310.5% for AGIs $100k-200k)
Profit/loss from business: +$3,476 (reported on 16.2% of returns)
Here:
+$3,476
State:
+$10,888
(% of AGI for various income ranges: 70.6% for AGIs below $25k, 10.7% for AGIs $50k-75k, 117.1% for AGIs $75k-100k, 664.0% for AGIs $100k-200k)
Taxable individual retirement arrangement distribution: $10,213 (reported on 1.8% of returns)
78252:
$10,213
Texas:
$24,740
(% of AGI for various income ranges: 4.4% for AGIs below $25k, 5.4% for AGIs $25k-50k, 22.5% for AGIs $50k-75k, 147.8% for AGIs $75k-100k)
Total itemized deductions: $24,324 (reported on 4.9% of returns)
Here:
$24,324
State:
$40,428
(% of AGI for various income ranges: 100.4% for AGIs $25k-50k, 257.5% for AGIs $50k-75k, 261.1% for AGIs $75k-100k, 426.4% for AGIs $100k-200k)
Charity contributions: $5,069 (reported on 3.1% of returns)
Here:
$5,069
State:
$18,201
(% of AGI for various income ranges: 11.7% for AGIs $25k-50k, 22.8% for AGIs $50k-75k, 36.3% for AGIs $75k-100k, 104.3% for AGIs $100k-200k)
Taxes paid: $5,929 (reported on 4.9% of returns)
78252:
$5,929
State:
$7,821
(% of AGI for various income ranges: 3.7% for AGIs below $25k, 23.1% for AGIs $25k-50k, 65.6% for AGIs $50k-75k, 62.5% for AGIs $75k-100k, 85.7% for AGIs $100k-200k)
Earned income credit: $2,656 (reported on 25.2% of returns)
Here:
$2,656
State:
$2,584
(% of AGI for various income ranges: 151.9% for AGIs below $25k, 98.5% for AGIs $25k-50k, 2.1% for AGIs $50k-75k)
Percentage of individuals using paid preparers for their 2020 taxes: 95.2%
Here:
95%
State:
92%
(% for various income ranges: 94.1% for AGIs below $25k, 96.1% for AGIs $25k-50k, 95.5% for AGIs $50k-75k, 95.0% for AGIs $75k-100k, 94.8% for AGIs $100k-200k, 100.0% for AGIs over 200k)
Averages for the 2012 tax year for zip code 78252, filed in 2013:
Average Adjusted Gross Income (AGI) in 2012: $36,901 (Individual Income Tax Returns)
Here:
$36,901
State:
$65,384
Salary/wage: $35,433 (reported on 93.9% of returns)
Here:
$35,433
State:
$52,524
(% of AGI for various income ranges: 84.4% for AGIs below $25k, 95.6% for AGIs $25k-50k, 94.1% for AGIs $50k-75k, 92.2% for AGIs $75k-100k, 69.1% for AGIs $100k-200k)
Taxable interest for individuals: $469 (reported on 8.3% of returns)
This zip code:
$469
Texas:
$2,372
(% of AGI for various income ranges: 0.2% for AGIs below $25k, 0.4% for AGIs $100k-200k)
Ordinary dividends: $1,775 (reported on 2.6% of returns)
Here:
$1,775
State:
$9,721
Net capital gain/loss in AGI: +$7,700 (reported on 1.6% of returns)
Here:
+$7,700
State:
+$35,319
Profit/loss from business: +$5,811 (reported on 11.5% of returns)
Here:
+$5,811
State:
+$13,732
(% of AGI for various income ranges: 10.0% for AGIs below $25k, 0.2% for AGIs $25k-50k, 1.4% for AGIs $75k-100k)
Taxable individual retirement arrangement distribution: $5,086 (reported on 2.2% of returns)
78252:
$5,086
Texas:
$19,511
Total itemized deductions: $14,586 (27% of AGI, reported on 21.1% of returns)
Here:
$14,586
State:
$24,724
Here:
27.1% of AGI
State:
15.9% of AGI
(% of AGI for various income ranges: 4.2% for AGIs below $25k, 10.2% for AGIs $25k-50k, 8.5% for AGIs $50k-75k, 8.3% for AGIs $75k-100k, 8.0% for AGIs $100k-200k)
Charity contributions: $1,984 (reported on 11.8% of returns)
Here:
$1,984
State:
$6,808
(% of AGI for various income ranges: 0.2% for AGIs below $25k, 0.7% for AGIs $25k-50k, 0.7% for AGIs $50k-75k, 1.0% for AGIs $75k-100k, 0.8% for AGIs $100k-200k)
Taxes paid: $3,402 (reported on 20.1% of returns)
78252:
$3,402
State:
$6,921
(% of AGI for various income ranges: 0.9% for AGIs below $25k, 2.2% for AGIs $25k-50k, 1.8% for AGIs $50k-75k, 1.9% for AGIs $75k-100k, 2.2% for AGIs $100k-200k)
Earned income credit: $2,642 (reported on 33.5% of returns)
Here:
$2,642
State:
$2,570
(% of AGI for various income ranges: 10.8% for AGIs below $25k, 2.0% for AGIs $25k-50k)
Percentage of individuals using paid preparers for their 2012 taxes: 45.7%
Here:
46%
State:
51%
(% for various income ranges: 48.8% for AGIs below $25k, 41.6% for AGIs $25k-50k, 44.9% for AGIs $50k-75k, 44.4% for AGIs $75k-100k, 62.5% for AGIs $100k-200k)
Averages for the 2004 tax year for zip code 78252, filed in 2005:
Average Adjusted Gross Income (AGI) in 2004: $22,881 (Individual Income Tax Returns)
Here:
$22,881
State:
$47,881
Salary/wage: $22,642 (reported on 87.1% of returns)
Here:
$22,642
State:
$41,947
(% of AGI for various income ranges: 97.0% for AGIs below $10k, 85.6% for AGIs $10k-25k, 90.4% for AGIs $25k-50k, 86.1% for AGIs $50k-75k, 75.6% for AGIs $75k-100k)
Taxable interest for individuals: $588 (reported on 16.6% of returns)
This zip code:
$588
Texas:
$2,255
(% of AGI for various income ranges: 0.6% for AGIs below $10k, 0.4% for AGIs $10k-25k, 0.4% for AGIs $25k-50k, 0.4% for AGIs $50k-75k, 0.5% for AGIs $75k-100k)
Taxable dividends: $500 (reported on 2.9% of returns)
Here:
$500
State:
$4,261
Net capital gain/loss: +$118 (reported on 2.8% of returns)
Here:
+$118
State:
+$16,110
Profit/loss from business: +$7,205 (reported on 13.5% of returns)
Here:
+$7,205
State:
+$11,013
Profit/loss from farming: +$1,375 (reported on 2.6% of returns)
Here:
+$1,375
State:
-$9,403
Total itemized deductions: $15,727 (27% of AGI, reported on 5.4% of returns)
Here:
$15,727
State:
$19,631
Here:
27.5% of AGI
State:
18.9% of AGI
Charity contributions deductions: $1,560 (3% of AGI, reported on 4.1% of returns)
Here:
$1,560
State:
$4,753
Here:
2.8% of AGI
State:
4.2% of AGI
Total tax: $2,590 (reported on 52.9% of returns)
78252:
$2,590
State:
$9,058
(% of AGI for various income ranges: 3.9% for AGIs below $10k, 3.0% for AGIs $10k-25k, 5.2% for AGIs $25k-50k, 7.9% for AGIs $50k-75k, 12.2% for AGIs $75k-100k)
Earned income credit: $2,383 (reported on 42.6% of returns)
Here:
$2,383
State:
$2,024
Percentage of individuals using paid preparers for their 2004 taxes: 70.3%
Here:
70%
State:
57%
(% for various income ranges: 64.4% for AGIs below $10k, 74.6% for AGIs $10k-25k, 66.1% for AGIs $25k-50k, 66.7% for AGIs $50k-75k, 91.3% for AGIs $75k-100k)
Likely homosexual households (counted as self-reported same-sex unmarried-partner households)
Lesbian couples: 0.0% of all households
Gay men: 0.3% of all households
Household received Food Stamps/SNAP in the past 12 months: 837 Household did not receive Food Stamps/SNAP in the past 12 months: 3,979
Women who had a birth in the past 12 months: 230 (201 now married, 31 unmarried) Women who did not have a birth in the past 12 months: 3,354 (1,746 now married, 1,599 unmarried)
Housing units in zip code 78252 with a mortgage: 3,290 (57 second mortgage, 45 both second mortgage and home equity loan) Houses without a mortgage: 8
Median monthly owner costs for units with a mortgage: $1,741 Median monthly owner costs for units without a mortgage: $557
Residents with income below the poverty level in 2022:
This zip code:
5.7%
Whole state:
14.0%
Residents with income below 50% of the poverty level in 2022:
This zip code:
3.0%
Whole state:
7.4%
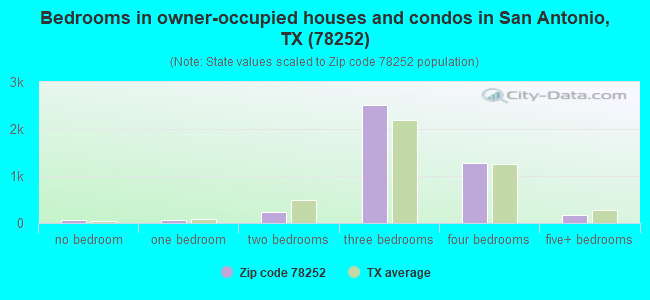
Median number of rooms in houses and condos:
Here:
6.0
State:
6.3
Median number of rooms in apartments:
Here:
5.1
State:
4.0
Notable locations in this zip code not listed on our city pages
Churches in zip code 78252 include: Southwest Baptist Church (A), Medina River Church (B), Fellowship Independent Baptist Church (C), Saint John Vianney Chapel Mission (D). Display/hide their locations on the map
Creeks: Sherer Creek (A), Potranca Creek (B), Lucas Creek (C), Little Sous Creek (D), East Branch Big Sous Creek (E), Polecat Creek (F). Display/hide their locations on the map
In group quarters: 1,948 (-1 institutionalized population)
Size of family households: 1,466 2-persons, 632 3-persons, 808 4-persons, 433 5-persons, 141 6-persons, 160 7-or-more-persons
Size of nonfamily households: 825 1-person, 184 2-persons, 135 4-persons
2,483 married couples with children.
1,084 single-parent households (79 men, 1,005 women).
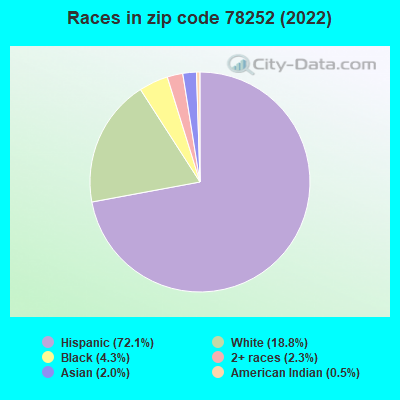
58.4% of residents of 78252 zip code speak English at home.
39.2% of residents speak Spanish at home (68% very well, 19% well, 10% not well, 2% not at all).
0.6% of residents speak other Indo-European language at home (87% very well, 13% well).
1.1% of residents speak Asian or Pacific Island language at home (55% very well, 18% well, 28% not well).
0.2% of residents speak other language at home (74% very well, 12% well, 15% not well).
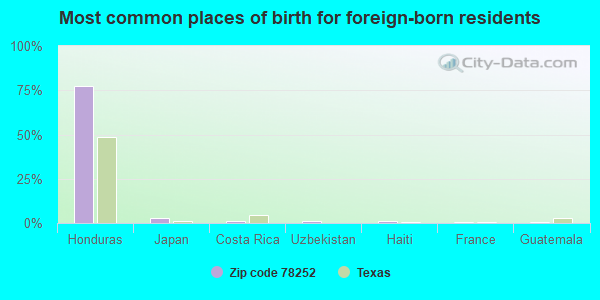
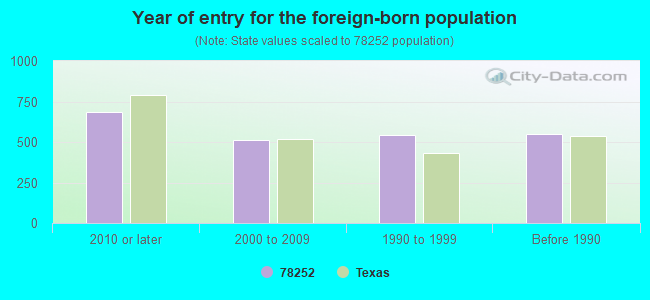
Foreign born population: 1,975 (12.3%) (36.0% of them are naturalized citizens)
Facilities with environmental interests located in this zip code:
ALAMO ENVIRONMENTAL INC (8189 NELSON RD in SAN ANTONIO, TX)
Conditionally Exempt Small Quantity Generators, less than 100 kg/month of hazardous waste (Resource Conservation and Recovery Act (tracking hazardous waste)) TRANSPORTER (Resource Conservation and Recovery Act (tracking hazardous waste))
Housing units lacking complete plumbing facilities: 0.8%
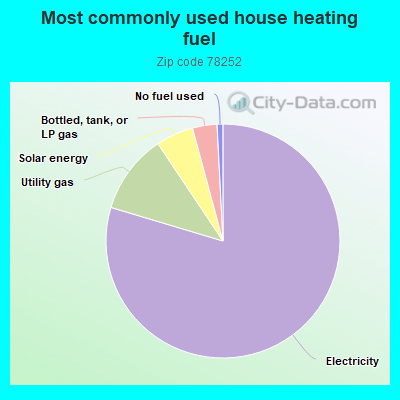
79.8%Electricity
11.0%Utility gas
5.2%Solar energy
3.4%Bottled, tank, or LP gas
0.8%No fuel used
Population in 1990: 1,378. Population change in the 1990s: +2,582 (+187.4%).
Place of birth for U.S.-born residents:
This state: 11,107
Northeast: 325
Midwest: 585
South: 825
West: 829
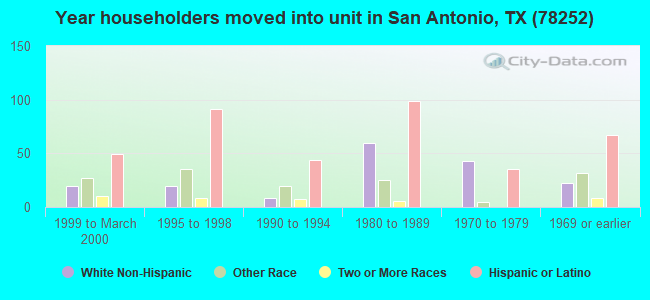
57% of the 78252 zip code residents lived in the same house 5 years ago. Out of people who lived in different houses, 71% lived in this county. Out of people who lived in different counties, 50% lived in Texas.
82% of the 78252 zip code residents lived in the same house 1 year ago. Out of people who lived in different houses, 39% moved from this county. Out of people who lived in different houses, 39% moved from different county within same state. Out of people who lived in different houses, 21% moved from different state. Out of people who lived in different houses, 1% moved from abroad.
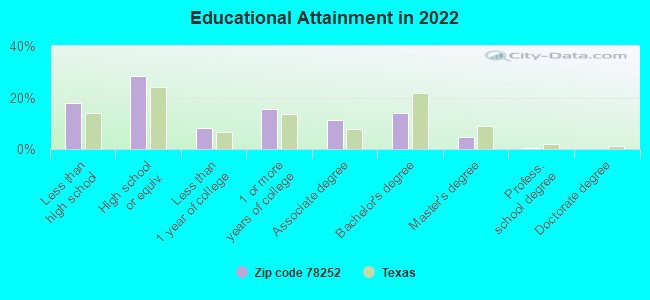
Private vs. public school enrollment:
Students in private schools in grades 1 to 8 (elementary and middle school): 127
Here:
7.4%
Texas:
8.8%
Students in private schools in grades 9 to 12 (high school): 76
Here:
7.9%
Texas:
8.0%
Students in private undergraduate colleges: 102
Here:
12.0%
Texas:
16.2%
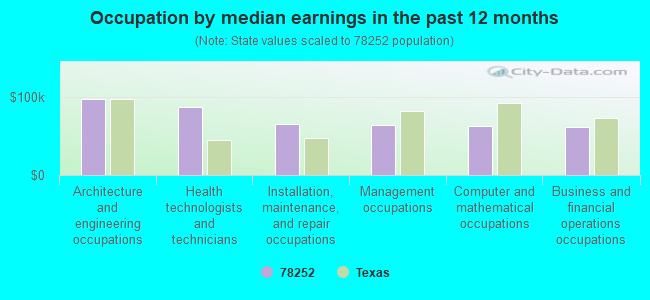
Occupation by median earnings in the past 12 months ($)
98,064Architecture and engineering occupations
87,254Health technologists and technicians
65,723Installation, maintenance, and repair occupations
65,034Management occupations
62,990Computer and mathematical occupations
61,646Business and financial operations occupations
Companies with federal contracts located in this zip code:
COUNTRY CORNER (8791 PEARSALL ROAD in SAN ANTONIO, TX; small business) : -$2,260 in 2 contractsin 2006
$0 with Air Force for Live Animals, Not Raised for Food. Signed on 2006-02-01. Completion date: 2002-09-30.
-$2,260, same as above.Signed on 2006-02-01. Completion date: 2002-09-30.
Top industries in this zip code by the number of employees in 2005:
Health Care and Social Assistance: Child Day Care Services (20-49 employees: 1 establishment, 1-4 employees: 2 establishments)
Administrative and Support and Waste Management and Remediation Services: Solid Waste Landfill (20-49: 1)
Accommodation and Food Services: Full-Service Restaurants (10-19: 1, 1-4: 1)
Administrative and Support and Waste Management and Remediation Services: Landscaping Services (10-19: 1)
Accommodation and Food Services: Drinking Places (Alcoholic Beverages) (5-9: 1)
Construction: Tile and Terrazzo Contractors (5-9: 1)
Real Estate and Rental and Leasing: Lessors of Nonresidential Buildings (except Miniwarehouses) (5-9: 1)
People in group quarters in 2010:
2,109 people in state prisons
16 people in workers' group living quarters and job corps centers
People in group quarters in 2000:
2,035 people in state prisons
Fatal accident statistics in 2014:
Fatal accident count: 3
Vehicles involved in fatal accidents: 6
Fatal accidents caused by drunken drivers: 3
Fatalities: 5
Persons involved in fatal accidents: 9
Pedestrians involved in fatal accidents: 0
Fatal accident statistics in 2013:
Fatal accident count: 2
Vehicles involved in fatal accidents: 3
Fatal accidents caused by drunken drivers: 1
Fatalities: 2
Persons involved in fatal accidents: 3
Pedestrians involved in fatal accidents: 0
Home Mortgage Disclosure Act Aggregated Statistics For Year 2009 (Based on 6 partial tracts)
A) FHA, FSA/RHS & VA Home Purchase Loans
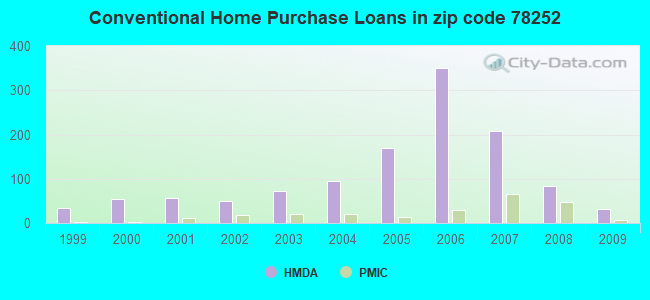
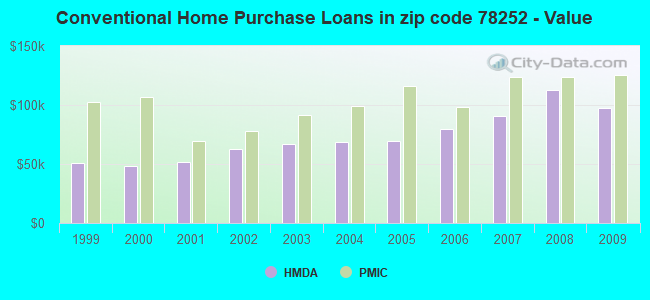
B) Conventional Home Purchase Loans
C) Refinancings
D) Home Improvement Loans
F) Non-occupant Loans on < 5 Family Dwellings (A B C & D)
G) Loans On Manufactured Home Dwelling (A B C & D)
Number
Average Value
Number
Average Value
Number
Average Value
Number
Average Value
Number
Average Value
Number
Average Value
LOANS ORIGINATED
407
$127,486
31
$97,353
95
$122,977
7
$40,549
13
$69,052
6
$78,103
APPLICATIONS APPROVED, NOT ACCEPTED
13
$121,554
2
$46,050
19
$116,504
3
$23,503
1
$38,590
3
$58,227
APPLICATIONS DENIED
151
$140,045
11
$86,425
88
$98,076
31
$30,063
13
$73,462
7
$47,539
APPLICATIONS WITHDRAWN
18
$115,463
1
$190,560
35
$121,222
1
$9,530
3
$55,213
1
$130,850
FILES CLOSED FOR INCOMPLETENESS
5
$168,880
1
$142,770
7
$110,547
0
$0
0
$0
1
$45,730
Aggregated Statistics For Year 2008 (Based on 6 partial tracts)
A) FHA, FSA/RHS & VA Home Purchase Loans
B) Conventional Home Purchase Loans
C) Refinancings
D) Home Improvement Loans
F) Non-occupant Loans on < 5 Family Dwellings (A B C & D)
G) Loans On Manufactured Home Dwelling (A B C & D)
Number
Average Value
Number
Average Value
Number
Average Value
Number
Average Value
Number
Average Value
Number
Average Value
LOANS ORIGINATED
431
$127,673
84
$113,008
84
$108,317
24
$36,532
48
$90,935
4
$60,735
APPLICATIONS APPROVED, NOT ACCEPTED
11
$120,116
9
$97,347
22
$95,317
7
$39,893
6
$80,173
5
$70,298
APPLICATIONS DENIED
119
$133,001
61
$91,317
106
$88,751
76
$34,786
34
$85,266
28
$53,586
APPLICATIONS WITHDRAWN
24
$138,224
11
$89,840
31
$116,803
6
$56,072
10
$85,491
1
$18,420
FILES CLOSED FOR INCOMPLETENESS
10
$149,456
6
$105,723
5
$98,916
1
$38,590
1
$132,480
1
$30,490
Aggregated Statistics For Year 2007 (Based on 6 partial tracts)
A) FHA, FSA/RHS & VA Home Purchase Loans
B) Conventional Home Purchase Loans
C) Refinancings
D) Home Improvement Loans
F) Non-occupant Loans on < 5 Family Dwellings (A B C & D)
G) Loans On Manufactured Home Dwelling (A B C & D)
Number
Average Value
Number
Average Value
Number
Average Value
Number
Average Value
Number
Average Value
Number
Average Value
LOANS ORIGINATED
235
$139,675
207
$91,038
67
$86,960
26
$30,058
63
$82,121
9
$56,938
APPLICATIONS APPROVED, NOT ACCEPTED
16
$154,989
38
$86,872
13
$70,398
9
$27,366
8
$92,944
8
$48,165
APPLICATIONS DENIED
38
$138,775
92
$81,907
161
$84,507
70
$29,347
54
$73,503
40
$57,774
APPLICATIONS WITHDRAWN
15
$148,867
41
$100,715
51
$82,944
2
$68,065
22
$86,117
2
$59,840
FILES CLOSED FOR INCOMPLETENESS
4
$134,888
12
$115,987
10
$79,317
2
$56,160
3
$59,593
0
$0
Aggregated Statistics For Year 2006 (Based on 6 partial tracts)
A) FHA, FSA/RHS & VA Home Purchase Loans
B) Conventional Home Purchase Loans
C) Refinancings
D) Home Improvement Loans
F) Non-occupant Loans on < 5 Family Dwellings (A B C & D)
G) Loans On Manufactured Home Dwelling (A B C & D)
Number
Average Value
Number
Average Value
Number
Average Value
Number
Average Value
Number
Average Value
Number
Average Value
LOANS ORIGINATED
242
$130,623
350
$79,367
69
$76,551
22
$17,060
109
$80,331
16
$62,837
APPLICATIONS APPROVED, NOT ACCEPTED
12
$128,719
64
$73,026
25
$92,723
4
$32,825
16
$76,910
13
$57,670
APPLICATIONS DENIED
74
$131,825
138
$68,902
122
$80,190
54
$23,999
30
$65,948
48
$42,933
APPLICATIONS WITHDRAWN
13
$130,903
51
$89,571
62
$99,689
4
$35,192
14
$86,551
1
$53,360
FILES CLOSED FOR INCOMPLETENESS
1
$118,150
10
$78,477
9
$106,563
1
$72,030
0
$0
2
$53,165
Aggregated Statistics For Year 2005 (Based on 6 partial tracts)
A) FHA, FSA/RHS & VA Home Purchase Loans
B) Conventional Home Purchase Loans
C) Refinancings
D) Home Improvement Loans
F) Non-occupant Loans on < 5 Family Dwellings (A B C & D)
G) Loans On Manufactured Home Dwelling (A B C & D)
Number
Average Value
Number
Average Value
Number
Average Value
Number
Average Value
Number
Average Value
Number
Average Value
LOANS ORIGINATED
78
$115,255
169
$69,444
82
$74,288
25
$43,760
64
$79,420
7
$52,567
APPLICATIONS APPROVED, NOT ACCEPTED
5
$100,664
20
$71,664
19
$64,122
8
$29,050
8
$78,330
10
$47,392
APPLICATIONS DENIED
17
$110,496
114
$62,313
134
$69,895
55
$27,235
33
$69,484
49
$40,032
APPLICATIONS WITHDRAWN
9
$103,977
23
$91,190
73
$89,366
15
$123,554
9
$80,359
3
$51,663
FILES CLOSED FOR INCOMPLETENESS
1
$174,920
4
$86,818
23
$99,496
2
$28,705
5
$93,378
0
$0
Aggregated Statistics For Year 2004 (Based on 6 partial tracts)
A) FHA, FSA/RHS & VA Home Purchase Loans
B) Conventional Home Purchase Loans
C) Refinancings
D) Home Improvement Loans
F) Non-occupant Loans on < 5 Family Dwellings (A B C & D)
G) Loans On Manufactured Home Dwelling (A B C & D)
Number
Average Value
Number
Average Value
Number
Average Value
Number
Average Value
Number
Average Value
Number
Average Value
LOANS ORIGINATED
117
$111,714
95
$68,441
87
$71,706
16
$32,534
21
$65,081
11
$48,853
APPLICATIONS APPROVED, NOT ACCEPTED
6
$109,755
36
$59,405
21
$70,491
9
$32,641
3
$59,277
16
$39,659
APPLICATIONS DENIED
12
$96,174
87
$51,286
121
$69,832
34
$17,736
14
$45,253
57
$41,823
APPLICATIONS WITHDRAWN
17
$118,400
15
$75,911
57
$68,186
2
$34,570
5
$59,916
0
$0
FILES CLOSED FOR INCOMPLETENESS
3
$61,470
3
$91,740
10
$73,626
3
$42,443
6
$57,008
0
$0
Aggregated Statistics For Year 2003 (Based on 6 partial tracts)
A) FHA, FSA/RHS & VA Home Purchase Loans
B) Conventional Home Purchase Loans
C) Refinancings
D) Home Improvement Loans
F) Non-occupant Loans on < 5 Family Dwellings (A B C & D)
Number
Average Value
Number
Average Value
Number
Average Value
Number
Average Value
Number
Average Value
LOANS ORIGINATED
113
$100,515
72
$67,193
139
$62,272
5
$14,594
16
$57,522
APPLICATIONS APPROVED, NOT ACCEPTED
2
$65,205
22
$53,450
20
$55,286
2
$17,175
3
$52,200
APPLICATIONS DENIED
16
$104,789
59
$51,344
92
$60,646
24
$11,052
7
$39,723
APPLICATIONS WITHDRAWN
13
$89,925
14
$90,677
54
$66,040
3
$55,020
4
$38,022
FILES CLOSED FOR INCOMPLETENESS
4
$91,570
3
$97,377
7
$53,220
0
$0
1
$45,730
Aggregated Statistics For Year 2002 (Based on 6 partial tracts)
A) FHA, FSA/RHS & VA Home Purchase Loans
B) Conventional Home Purchase Loans
C) Refinancings
D) Home Improvement Loans
F) Non-occupant Loans on < 5 Family Dwellings (A B C & D)
Number
Average Value
Number
Average Value
Number
Average Value
Number
Average Value
Number
Average Value
LOANS ORIGINATED
149
$90,877
50
$62,746
72
$55,159
6
$19,275
17
$43,659
APPLICATIONS APPROVED, NOT ACCEPTED
5
$86,690
19
$51,613
27
$47,718
1
$4,470
4
$41,025
APPLICATIONS DENIED
10
$73,956
53
$46,615
57
$49,843
27
$11,725
4
$38,178
APPLICATIONS WITHDRAWN
64
$87,812
11
$64,693
21
$50,588
1
$13,380
1
$82,320
FILES CLOSED FOR INCOMPLETENESS
3
$83,970
6
$54,985
10
$66,863
0
$0
3
$44,587
Aggregated Statistics For Year 2001 (Based on 6 partial tracts)
A) FHA, FSA/RHS & VA Home Purchase Loans
B) Conventional Home Purchase Loans
C) Refinancings
D) Home Improvement Loans
F) Non-occupant Loans on < 5 Family Dwellings (A B C & D)
Number
Average Value
Number
Average Value
Number
Average Value
Number
Average Value
Number
Average Value
LOANS ORIGINATED
162
$80,216
56
$51,409
55
$57,639
12
$17,325
11
$42,732
APPLICATIONS APPROVED, NOT ACCEPTED
3
$87,813
31
$52,397
16
$64,606
4
$27,905
1
$13,340
APPLICATIONS DENIED
6
$80,080
81
$48,181
57
$48,649
27
$12,751
10
$43,794
APPLICATIONS WITHDRAWN
69
$82,327
9
$61,137
23
$52,048
4
$22,288
6
$53,110
FILES CLOSED FOR INCOMPLETENESS
34
$74,910
5
$56,194
6
$59,537
0
$0
1
$73,310
Aggregated Statistics For Year 2000 (Based on 6 partial tracts)
A) FHA, FSA/RHS & VA Home Purchase Loans
B) Conventional Home Purchase Loans
C) Refinancings
D) Home Improvement Loans
F) Non-occupant Loans on < 5 Family Dwellings (A B C & D)
Number
Average Value
Number
Average Value
Number
Average Value
Number
Average Value
Number
Average Value
LOANS ORIGINATED
133
$76,239
54
$48,122
33
$56,194
5
$14,030
8
$44,112
APPLICATIONS APPROVED, NOT ACCEPTED
13
$70,015
28
$45,219
11
$70,371
8
$12,444
1
$45,730
APPLICATIONS DENIED
17
$73,251
92
$42,483
38
$39,882
16
$15,304
11
$37,209
APPLICATIONS WITHDRAWN
55
$79,423
12
$83,316
9
$71,576
3
$28,563
1
$12,700
FILES CLOSED FOR INCOMPLETENESS
32
$77,038
6
$63,140
13
$50,902
0
$0
1
$51,450
Aggregated Statistics For Year 1999 (Based on 3 partial tracts)
A) FHA, FSA/RHS & VA Home Purchase Loans
B) Conventional Home Purchase Loans
C) Refinancings
D) Home Improvement Loans
F) Non-occupant Loans on < 5 Family Dwellings (A B C & D)
2002 - 2018 National Fire Incident Reporting System (NFIRS) incidents
Based on the data from the years 2002 - 2018 the average number of fires per year is 25. The highest number of reported fire incidents - 55 took place in 2017, and the least - 5 in 2015. The data has a rising trend.
When looking into fire subcategories, the most reports belonged to: Outside Fires (58.9%), and Mobile Property/Vehicle Fires (17.2%).
Fire incident types reported to NFIRS in Zip Code 78252


+$1,375
-$9,403
 Nearest zip codes: 78245, 78002, 78242, 78227, 78236, 78243.
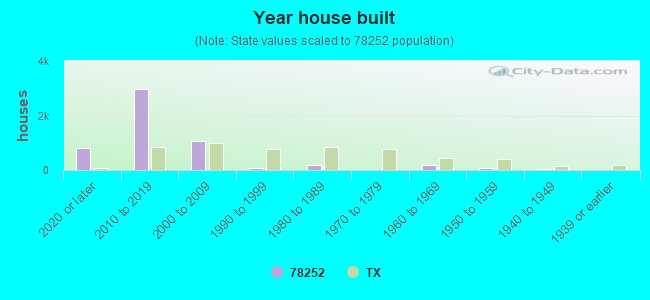


 Based on the data from the years 2002 - 2018 the average number of fires per year is 25. The highest number of reported fire incidents - 55 took place in 2017, and the least - 5 in 2015. The data has a rising trend.
 When looking into fire subcategories, the most reports belonged to: Outside Fires (58.9%), and Mobile Property/Vehicle Fires (17.2%).