Estimated zip code population in 2022: 16,027 Zip code population in 2010: 15,652 Zip code population in 2000: 13,690
Houses and condos: 6,578 Renter-occupied apartments: 1,093
% of renters here:
20%
State:
38%
March 2022 cost of living index in zip code 79549: 78.0 (low, U.S. average is 100)
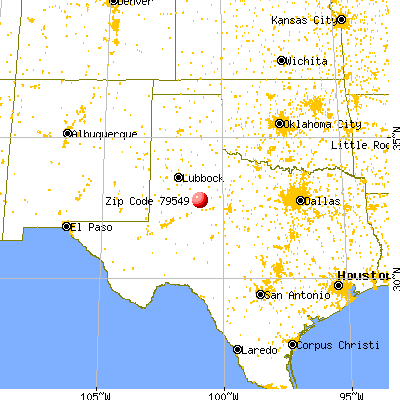
Land area: 956.4 sq. mi. Water area: 1.2 sq. mi.
Population density: 17 people per square mile
(very low).
OSM Map
General Map
Google Map
MSN Map
OSM Map
General Map
Google Map
MSN Map
OSM Map
General Map
Google Map
MSN Map
OSM Map
General Map
Google Map
MSN Map
Please wait while loading the map...
Real estate property taxes paid for housing units in 2022:
This zip code:
1.4% ($1,792)
Texas:
1.5% ($4,050)
Median real estate property taxes paid for housing units with mortgages in 2022: $3,140 (1.6%) Median real estate property taxes paid for housing units with no mortgage in 2022: $1,320 (1.3%)
Business Search- 14 Million verified businesses
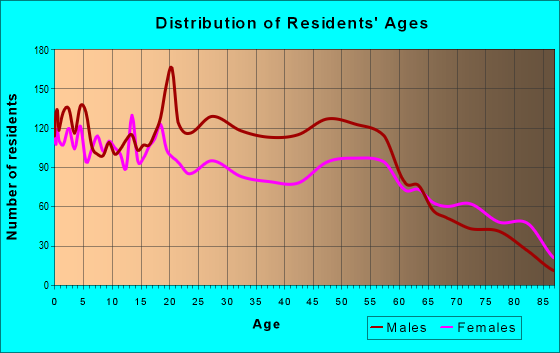
Males: 8,629
(53.8%)
Females: 7,398
(46.2%)
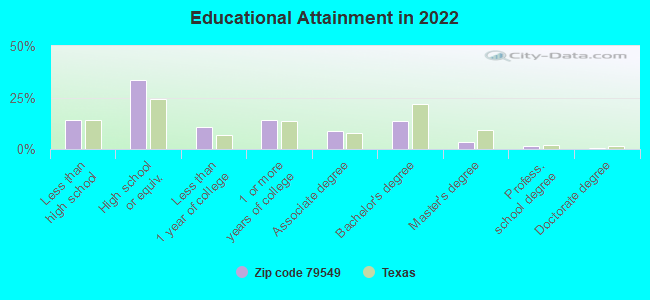
For population 25 years and over in 79549:
High school or higher: 85.0%
Bachelor's degree or higher: 18.7%
Graduate or professional degree: 5.0%
Unemployed: 1.7%
Mean travel time to work (commute): 17.7 minutes
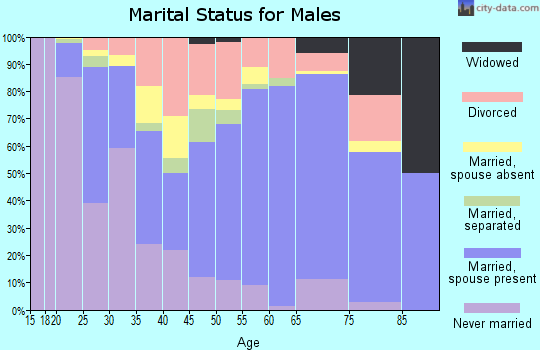
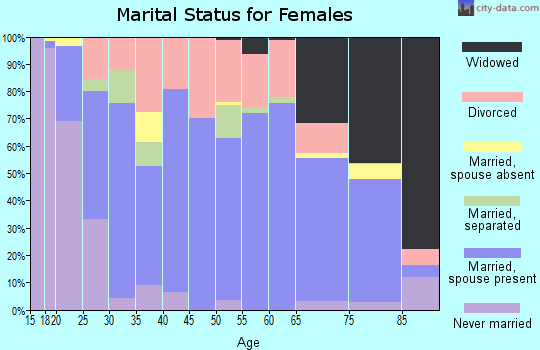
For population 15 years and over in 79549:
Never married: 31.3%
Now married: 49.1%
Separated: 1.8%
Widowed: 5.3%
Divorced: 12.5%
Zip code 79549 compared to state average:
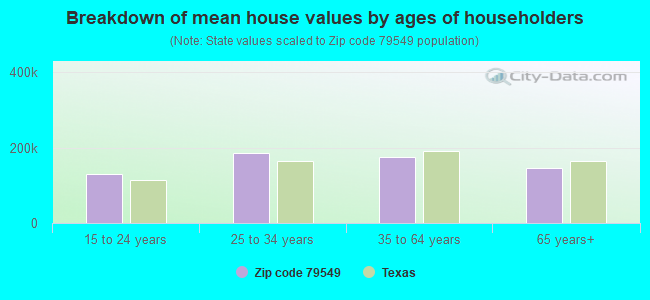
Median house value below state average.
Unemployed percentage below state average.
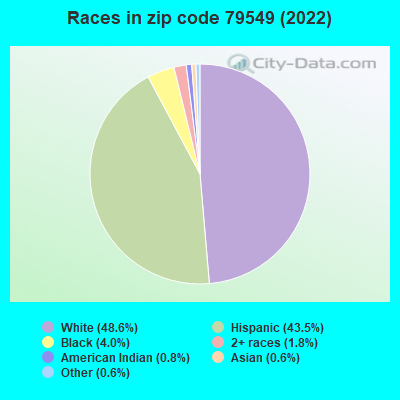
Black race population percentage significantly below state average.
Foreign-born population percentage significantly below state average.
Renting percentage below state average.
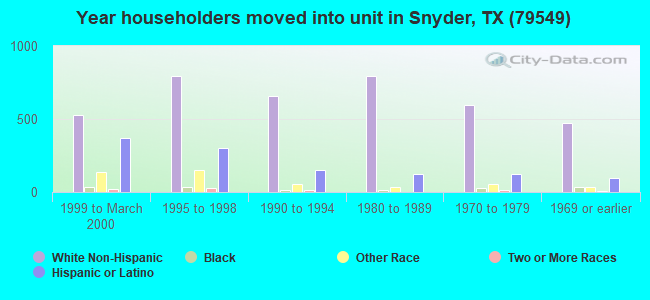
Length of stay since moving in significantly above state average.
House age above state average.
Percentage of population with a bachelor's degree or higher below state average.
Averages for the 2020 tax year for zip code 79549, filed in 2021:
Average Adjusted Gross Income (AGI) in 2020: $62,268 (Individual Income Tax Returns)
Here:
$62,268
State:
$77,054
Salary/wage: $51,671 (reported on 85.0% of returns)
Here:
$51,671
State:
$62,766
(% of AGI for various income ranges: 1231.8% for AGIs below $25k, 3657.3% for AGIs $25k-50k, 6345.8% for AGIs $50k-75k, 9392.6% for AGIs $75k-100k, 16995.1% for AGIs $100k-200k, 51235.0% for AGIs over 200k)
Taxable interest for individuals: $1,546 (reported on 22.7% of returns)
This zip code:
$1,546
Texas:
$2,665
(% of AGI for various income ranges: 6.3% for AGIs below $25k, 12.5% for AGIs $25k-50k, 29.7% for AGIs $50k-75k, 51.3% for AGIs $75k-100k, 73.2% for AGIs $100k-200k, 1678.3% for AGIs over 200k)
Ordinary dividends: $6,009 (reported on 13.1% of returns)
Here:
$6,009
State:
$10,044
(% of AGI for various income ranges: 11.7% for AGIs below $25k, 26.5% for AGIs $25k-50k, 74.0% for AGIs $50k-75k, 97.1% for AGIs $75k-100k, 197.4% for AGIs $100k-200k, 3638.3% for AGIs over 200k)
Net capital gain/loss in AGI: +$14,700 (reported on 12.4% of returns)
Here:
+$14,700
State:
+$39,590
(% of AGI for various income ranges: 6.9% for AGIs below $25k, 29.0% for AGIs $25k-50k, 51.5% for AGIs $50k-75k, 237.9% for AGIs $75k-100k, 419.4% for AGIs $100k-200k, 11073.3% for AGIs over 200k)
Profit/loss from business: +$8,235 (reported on 17.2% of returns)
Here:
+$8,235
State:
+$10,888
(% of AGI for various income ranges: 74.6% for AGIs below $25k, 113.9% for AGIs $50k-75k, 266.1% for AGIs $75k-100k, 382.6% for AGIs $100k-200k, 5656.7% for AGIs over 200k)
Taxable individual retirement arrangement distribution: $19,762 (reported on 6.5% of returns)
79549:
$19,762
Texas:
$24,740
(% of AGI for various income ranges: 34.6% for AGIs below $25k, 75.1% for AGIs $25k-50k, 164.3% for AGIs $50k-75k, 390.8% for AGIs $75k-100k, 517.4% for AGIs $100k-200k, 1563.3% for AGIs over 200k)
Total itemized deductions: $35,295 (reported on 3.5% of returns)
Here:
$35,295
State:
$40,428
(% of AGI for various income ranges: 75.9% for AGIs $25k-50k, 146.0% for AGIs $50k-75k, 163.9% for AGIs $75k-100k, 353.0% for AGIs $100k-200k, 4926.7% for AGIs over 200k)
Charity contributions: $21,971 (reported on 2.5% of returns)
Here:
$21,971
State:
$18,201
(% of AGI for various income ranges: 9.3% for AGIs below $25k, 52.7% for AGIs $50k-75k, 142.6% for AGIs $100k-200k, 3188.3% for AGIs over 200k)
Taxes paid: $5,444 (reported on 3.2% of returns)
79549:
$5,444
State:
$7,821
(% of AGI for various income ranges: 7.6% for AGIs $25k-50k, 27.9% for AGIs $50k-75k, 60.6% for AGIs $100k-200k, 706.7% for AGIs over 200k)
Earned income credit: $2,647 (reported on 20.9% of returns)
Here:
$2,647
State:
$2,584
(% of AGI for various income ranges: 133.3% for AGIs below $25k, 98.4% for AGIs $25k-50k, 2.7% for AGIs $50k-75k)
Percentage of individuals using paid preparers for their 2020 taxes: 94.9%
Here:
95%
State:
92%
(% for various income ranges: 93.9% for AGIs below $25k, 94.8% for AGIs $25k-50k, 95.5% for AGIs $50k-75k, 96.2% for AGIs $75k-100k, 96.0% for AGIs $100k-200k, 94.1% for AGIs over 200k)
Averages for the 2012 tax year for zip code 79549, filed in 2013:
Average Adjusted Gross Income (AGI) in 2012: $60,555 (Individual Income Tax Returns)
Here:
$60,555
State:
$65,384
Salary/wage: $47,601 (reported on 87.1% of returns)
Here:
$47,601
State:
$52,524
(% of AGI for various income ranges: 82.7% for AGIs below $25k, 87.8% for AGIs $25k-50k, 81.8% for AGIs $50k-75k, 81.6% for AGIs $75k-100k, 78.4% for AGIs $100k-200k, 24.1% for AGIs over 200k)
Taxable interest for individuals: $1,236 (reported on 26.9% of returns)
This zip code:
$1,236
Texas:
$2,372
(% of AGI for various income ranges: 0.8% for AGIs below $25k, 0.3% for AGIs $25k-50k, 0.5% for AGIs $50k-75k, 0.3% for AGIs $75k-100k, 0.4% for AGIs $100k-200k, 1.0% for AGIs over 200k)
Ordinary dividends: $6,960 (reported on 13.6% of returns)
Here:
$6,960
State:
$9,721
(% of AGI for various income ranges: 1.2% for AGIs below $25k, 0.4% for AGIs $25k-50k, 0.8% for AGIs $50k-75k, 0.6% for AGIs $75k-100k, 0.9% for AGIs $100k-200k, 4.2% for AGIs over 200k)
Net capital gain/loss in AGI: +$11,280 (reported on 10.3% of returns)
Here:
+$11,280
State:
+$35,319
(% of AGI for various income ranges: 0.4% for AGIs $25k-50k, 0.2% for AGIs $50k-75k, 0.3% for AGIs $75k-100k, 1.0% for AGIs $100k-200k, 6.7% for AGIs over 200k)
Profit/loss from business: +$20,590 (reported on 14.5% of returns)
Here:
+$20,590
State:
+$13,732
(% of AGI for various income ranges: 5.2% for AGIs below $25k, 1.7% for AGIs $25k-50k, 2.2% for AGIs $50k-75k, 2.4% for AGIs $75k-100k, 4.3% for AGIs $100k-200k, 11.0% for AGIs over 200k)
Taxable individual retirement arrangement distribution: $16,047 (reported on 7.9% of returns)
79549:
$16,047
Texas:
$19,511
(% of AGI for various income ranges: 2.0% for AGIs below $25k, 1.4% for AGIs $25k-50k, 2.2% for AGIs $50k-75k, 2.3% for AGIs $75k-100k, 2.3% for AGIs $100k-200k, 2.0% for AGIs over 200k)
Total itemized deductions: $23,165 (17% of AGI, reported on 14.0% of returns)
Here:
$23,165
State:
$24,724
Here:
16.7% of AGI
State:
15.9% of AGI
(% of AGI for various income ranges: 3.8% for AGIs below $25k, 4.3% for AGIs $25k-50k, 5.3% for AGIs $50k-75k, 4.9% for AGIs $75k-100k, 5.5% for AGIs $100k-200k, 6.6% for AGIs over 200k)
Charity contributions: $10,773 (reported on 10.3% of returns)
Here:
$10,773
State:
$6,808
(% of AGI for various income ranges: 0.3% for AGIs below $25k, 0.8% for AGIs $25k-50k, 1.2% for AGIs $50k-75k, 1.3% for AGIs $75k-100k, 1.7% for AGIs $100k-200k, 3.9% for AGIs over 200k)
Taxes paid: $4,418 (reported on 13.6% of returns)
79549:
$4,418
State:
$6,921
(% of AGI for various income ranges: 0.5% for AGIs below $25k, 0.7% for AGIs $25k-50k, 0.9% for AGIs $50k-75k, 1.0% for AGIs $75k-100k, 1.4% for AGIs $100k-200k, 1.0% for AGIs over 200k)
Earned income credit: $2,339 (reported on 20.2% of returns)
Here:
$2,339
State:
$2,570
(% of AGI for various income ranges: 8.4% for AGIs below $25k, 1.4% for AGIs $25k-50k)
Percentage of individuals using paid preparers for their 2012 taxes: 65.6%
Here:
66%
State:
51%
(% for various income ranges: 61.8% for AGIs below $25k, 60.9% for AGIs $25k-50k, 69.5% for AGIs $50k-75k, 67.7% for AGIs $75k-100k, 73.0% for AGIs $100k-200k, 88.9% for AGIs over 200k)
Averages for the 2004 tax year for zip code 79549, filed in 2005:
Average Adjusted Gross Income (AGI) in 2004: $36,174 (Individual Income Tax Returns)
Here:
$36,174
State:
$47,881
Salary/wage: $32,022 (reported on 84.0% of returns)
Here:
$32,022
State:
$41,947
(% of AGI for various income ranges: 1323.1% for AGIs below $10k, 82.8% for AGIs $10k-25k, 83.2% for AGIs $25k-50k, 78.0% for AGIs $50k-75k, 75.9% for AGIs $75k-100k, 42.2% for AGIs over 100k)
Taxable interest for individuals: $2,325 (reported on 32.5% of returns)
This zip code:
$2,325
Texas:
$2,255
(% of AGI for various income ranges: 85.5% for AGIs below $10k, 2.3% for AGIs $10k-25k, 1.1% for AGIs $25k-50k, 1.4% for AGIs $50k-75k, 1.7% for AGIs $75k-100k, 3.2% for AGIs over 100k)
Taxable dividends: $2,841 (reported on 18.2% of returns)
Here:
$2,841
State:
$4,261
(% of AGI for various income ranges: 35.1% for AGIs below $10k, 0.8% for AGIs $10k-25k, 0.7% for AGIs $25k-50k, 0.8% for AGIs $50k-75k, 0.8% for AGIs $75k-100k, 3.4% for AGIs over 100k)
Net capital gain/loss: +$4,880 (reported on 16.9% of returns)
Here:
+$4,880
State:
+$16,110
(% of AGI for various income ranges: -9.3% for AGIs below $10k, 0.3% for AGIs $10k-25k, 0.4% for AGIs $25k-50k, 1.3% for AGIs $50k-75k, 0.7% for AGIs $75k-100k, 7.8% for AGIs over 100k)
Profit/loss from business: +$9,775 (reported on 15.6% of returns)
Here:
+$9,775
State:
+$11,013
(% of AGI for various income ranges: -46.6% for AGIs below $10k, 3.2% for AGIs $10k-25k, 3.2% for AGIs $25k-50k, 2.2% for AGIs $50k-75k, 3.8% for AGIs $75k-100k, 8.7% for AGIs over 100k)
IRA payment deduction: $3,490 (reported on 2.1% of returns)
79549:
$3,490
Texas:
$3,120
(% of AGI for various income ranges: 0.2% for AGIs $10k-25k, 0.2% for AGIs $25k-50k, 0.2% for AGIs $50k-75k, 0.2% for AGIs $75k-100k, 0.2% for AGIs over 100k)
Total itemized deductions: $16,813 (21% of AGI, reported on 12.2% of returns)
Here:
$16,813
State:
$19,631
Here:
21.5% of AGI
State:
18.9% of AGI
(% of AGI for various income ranges: 59.4% for AGIs below $10k, 4.9% for AGIs $10k-25k, 4.7% for AGIs $25k-50k, 5.6% for AGIs $50k-75k, 6.0% for AGIs $75k-100k, 6.5% for AGIs over 100k)
Charity contributions deductions: $5,940 (7% of AGI, reported on 10.1% of returns)
Here:
$5,940
State:
$4,753
Here:
7.2% of AGI
State:
4.2% of AGI
(% of AGI for various income ranges: 0.7% for AGIs $10k-25k, 1.0% for AGIs $25k-50k, 1.7% for AGIs $50k-75k, 1.8% for AGIs $75k-100k, 2.8% for AGIs over 100k)
Total tax: $5,357 (reported on 66.7% of returns)
79549:
$5,357
State:
$9,058
(% of AGI for various income ranges: 45.4% for AGIs below $10k, 3.2% for AGIs $10k-25k, 5.9% for AGIs $25k-50k, 8.8% for AGIs $50k-75k, 11.6% for AGIs $75k-100k, 17.8% for AGIs over 100k)
Earned income credit: $1,916 (reported on 25.4% of returns)
Here:
$1,916
State:
$2,024
Percentage of individuals using paid preparers for their 2004 taxes: 66.5%
Here:
66%
State:
57%
(% for various income ranges: 63.2% for AGIs below $10k, 67.3% for AGIs $10k-25k, 65.3% for AGIs $25k-50k, 67.0% for AGIs $50k-75k, 68.4% for AGIs $75k-100k, 81.9% for AGIs over 100k)
Household received Food Stamps/SNAP in the past 12 months: 361 Household did not receive Food Stamps/SNAP in the past 12 months: 5,142
Women who had a birth in the past 12 months: 358 (282 now married, 78 unmarried) Women who did not have a birth in the past 12 months: 2,840 (1,323 now married, 1,515 unmarried)
Housing units in zip code 79549 with a mortgage: 1,813 (79 second mortgage, 85 both second mortgage and home equity loan) Median monthly owner costs for units with a mortgage: $1,372 Median monthly owner costs for units without a mortgage: $486
Residents with income below the poverty level in 2022:
This zip code:
12.2%
Whole state:
14.0%
Residents with income below 50% of the poverty level in 2022:
This zip code:
6.9%
Whole state:
7.4%
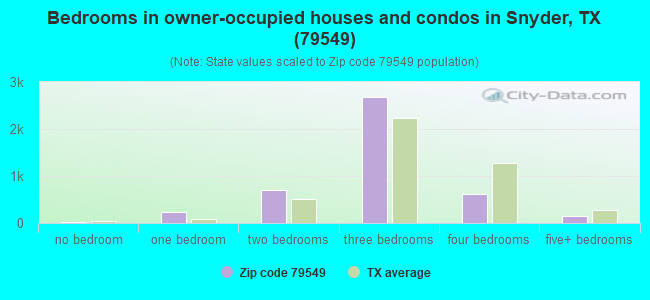
Median number of rooms in houses and condos:
Here:
5.9
State:
6.3
Median number of rooms in apartments:
Here:
4.5
State:
4.0
Notable locations in this zip code not listed on our city pages
Notable locations in zip code 79549: O Bar O Ranch (A), Bowden Ranch (B), Ennis Creek School (C), Fuller Brothers L P Ranch (D), Fuller Ranch (E), Furr Ranch (F), Iron Trap Windmill (G), Lloyd Mountain School (H), Connell Ranch (I), South Camp (J), Williams Ranch (K), Scurry County Courthouse (L), Scurry County Museum (M), Snyder Fire Department (N), Snyder Fire Department Administration (O), Snyder Emergency Medical Service (P), Southwest Medical Evacuation Snyder Base (Q). Display/hide their locations on the map
Churches in zip code 79549 include: Canyon Church (A), First Presbyterian Church (B), The Church of Jesus Christ of Latter Day Saints (C), Trinity United Methodist Church (D), Grace Lutheran Church (E), Church of God (F), Spanish Church of Christ (G), Primitive Baptist Church (H), North College Avenue Baptist Church (I). Display/hide their locations on the map
Reservoirs: SoRelle Lake (A), Taylor Tank (B), ABC Tanks (C), Bilby Wallace Ranch Lake (D), Cogdell Ranch Lake (E), So Relle Lake (F), Fowler Tank (G). Display/hide their locations on the map
Streams, rivers, and creeks: Turkey Creek (A), South Sage Creek (B), South Fork Deep Creek (C), Sand Creek (D), Salt Springs Creek (E), Rockwall Creek (F), A B C Creek (G), McKenzie Creek (H), Maverick Creek (I). Display/hide their locations on the map
In group quarters: 1,949 (-1 institutionalized population)
Size of family households: 1,551 2-persons, 544 3-persons, 864 4-persons, 496 5-persons, 72 6-persons, 39 7-or-more-persons
Size of nonfamily households: 1,815 1-person, 103 2-persons, 31 7-or-more-persons
2,675 married couples with children.
659 single-parent households (253 men, 406 women).
74.6% of residents of 79549 zip code speak English at home.
24.7% of residents speak Spanish at home (70% very well, 19% well, 9% not well, 3% not at all).
0.1% of residents speak other Indo-European language at home (100% very well).
0.6% of residents speak Asian or Pacific Island language at home (60% very well, 23% well, 10% not well, 7% not at all).
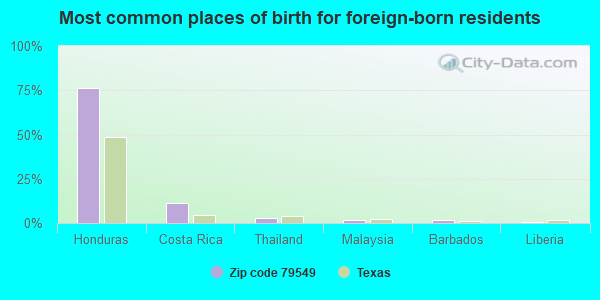
Foreign born population: 1,013 (6.3%) (53.8% of them are naturalized citizens)
This zip code:
6.3%
Whole state:
17.2%
77%Honduras
12%Costa Rica
3%Thailand
2%Malaysia
2%Barbados
1%Liberia
0%China, excluding Hong Kong and Taiwan
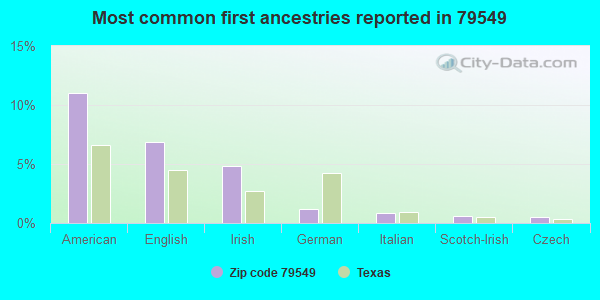
11%American
7%English
5%Irish
1%German
1%Italian
1%Scotch-Irish
1%Czech
Year of entry for the foreign-born population
4202010 or later
2472000 to 2009
1781990 to 1999
216Before 1990
Facilities with environmental interests located in this zip code:
AMERICAN TELEPHONE AND TELEGRAPH COMPANY (HWY 208 10.1 MI NE RR in DERMOTT, TX)
(Resource Conservation and Recovery Act (tracking hazardous waste)) Alternative names: AMERICAN TEL & TEL CO LONG LINES
AMOCO PIPELINE COMPANY (2931 W HIGHWAY 180 in SNYDER, TX)
(Resource Conservation and Recovery Act (tracking hazardous waste))
ARROW CONSTRUCTION (2700 21ST ST in SNYDER, TX)
(Resource Conservation and Recovery Act (tracking hazardous waste))
AMERICAN TELEPHONE AND TELEGRAPH COMPANY (11 MI W L435210 in SNYDER, TX)
(Resource Conservation and Recovery Act (tracking hazardous waste)) Alternative names: AMERICAN TEL & TEL CO LONG LINES
Housing units lacking complete plumbing facilities: 2.9% Housing units lacking complete kitchen facilities: 6.0%
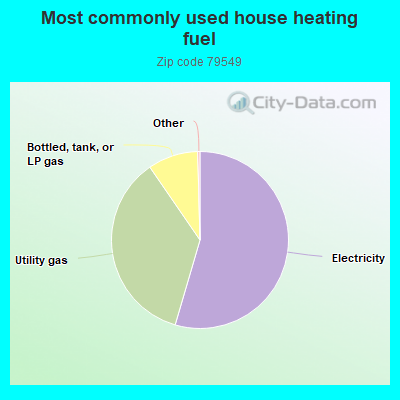
54.6%Electricity
35.9%Utility gas
9.2%Bottled, tank, or LP gas
Population in 1990: 16,206.
Place of birth for U.S.-born residents:
This state: 12,540
Northeast: 139
Midwest: 344
South: 870
West: 996
59% of the 79549 zip code residents lived in the same house 5 years ago. Out of people who lived in different houses, 62% lived in this county. Out of people who lived in different counties, 50% lived in Texas.
83% of the 79549 zip code residents lived in the same house 1 year ago. Out of people who lived in different houses, 37% moved from this county. Out of people who lived in different houses, 59% moved from different county within same state. Out of people who lived in different houses, 3% moved from different state. Out of people who lived in different houses, 0% moved from abroad.
Private vs. public school enrollment:
Students in private schools in grades 1 to 8 (elementary and middle school): 156
Here:
8.8%
Texas:
8.8%
Students in private schools in grades 9 to 12 (high school): 163
Here:
16.1%
Texas:
8.0%
Students in private undergraduate colleges: 118
Here:
15.2%
Texas:
16.2%
Occupation by median earnings in the past 12 months ($)
76,172Management occupations
72,235Business and financial operations occupations
65,474Health diagnosing and treating practitioners and other technical occupations
58,078Construction and extraction occupations
57,849Transportation occupations
52,107Health technologists and technicians
Companies with federal contracts located in this zip code:
MIDWESTERN SERVICES, INC (1913 7TH ST in SNYDER, TX; small business) : $33,178 in 2 contractsin 2006
$88,910 with Air Force for Other Environmental Services, Studies, and Analytical Support. Signed on 2006-03-09. Completion date: 2006-04-11.
-$55,732, same as above.Signed on 2006-05-03. Completion date: 2006-04-11.
ICE MELT PRODUCTS LLC (8860 ROADRUNNER PATH in SNYDER, TX; small business)
$7,700 with Army for Land Treatment Practices Services (plowing/clearing, etc.). Signed on 2004-07-26. Completion date: 2004-07-30.
Top industries in this zip code by the number of employees in 2005:
Mining: Drilling Oil and Gas Wells (100-249 employees: 1 establishment, 50-99 employees: 1 establishment)
Mining: Support Activities for Oil and Gas Operations (50-99: 1, 20-49: 1, 10-19: 3, 5-9: 2, 1-4: 8)
Health Care and Social Assistance: General Medical and Surgical Hospitals (100-249: 1)
Health Care and Social Assistance: Nursing Care Facilities (50-99: 2, 1-4: 1)
Health Care and Social Assistance: Child Day Care Services (50-99: 1, 10-19: 2, 5-9: 1)
People in group quarters in 2010:
1,296 people in state prisons
244 people in college/university student housing
83 people in group homes intended for adults
61 people in nursing facilities/skilled-nursing facilities
40 people in local jails and other municipal confinement facilities
People in group quarters in 2000:
164 people in college dormitories (includes college quarters off campus)
126 people in nursing homes
36 people in local jails and other confinement facilities (including police lockups)
24 people in wards in general hospitals for patients who have no usual home elsewhere
Fatal accident statistics in 2014:
Fatal accident count: 4
Vehicles involved in fatal accidents: 4
Fatal accidents caused by drunken drivers: 0
Fatalities: 4
Persons involved in fatal accidents: 5
Pedestrians involved in fatal accidents: 0
Fatal accident statistics in 2013:
Fatal accident count: 3
Vehicles involved in fatal accidents: 4
Fatal accidents caused by drunken drivers: 0
Fatalities: 3
Persons involved in fatal accidents: 8
Pedestrians involved in fatal accidents: 1
2002 - 2018 National Fire Incident Reporting System (NFIRS) incidents
Based on the data from the years 2002 - 2018 the average number of fire incidents per year is 136. The highest number of fire incidents - 258 took place in 2011, and the least - 10 in 2002. The data has an increasing trend.
When looking into fire subcategories, the most reports belonged to: Outside Fires (73.5%), and Structure Fires (15.9%).
Fire incident types reported to NFIRS in Zip Code 79549


 Nearest zip codes: 79526, 79528, 79546, 79527, 79517, 79330.
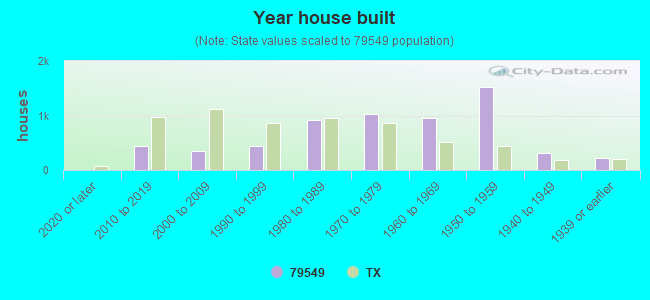


 Based on the data from the years 2002 - 2018 the average number of fire incidents per year is 136. The highest number of fire incidents - 258 took place in 2011, and the least - 10 in 2002. The data has an increasing trend.
 When looking into fire subcategories, the most reports belonged to: Outside Fires (73.5%), and Structure Fires (15.9%).