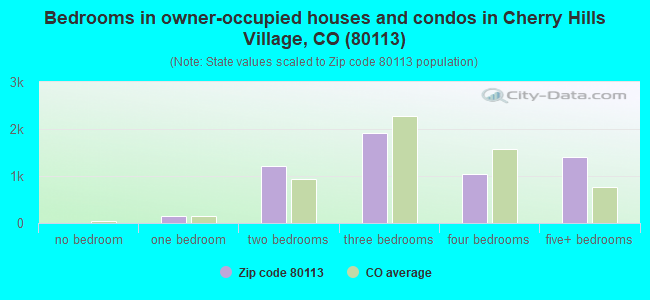
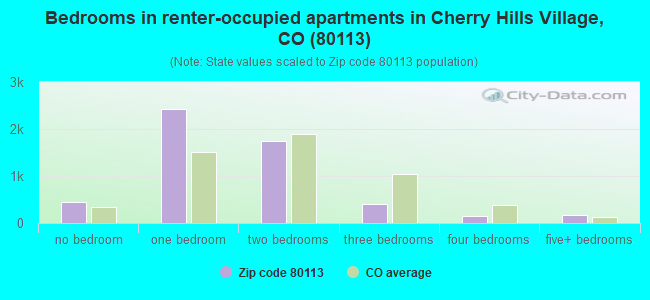
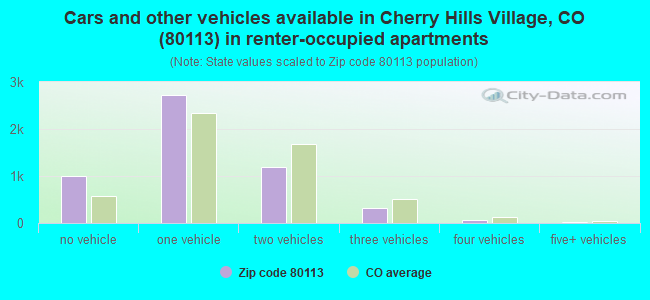
Houses and condos: 11,590 Renter-occupied apartments: 5,322
% of renters here:
48%
State:
34%
March 2022 cost of living index in zip code 80113: 98.0 (near average, U.S. average is 100)
Land area: 7.6 sq. mi. Water area: 0.1 sq. mi.
Population density: 3,049 people per square mile
(average).
OSM Map
Google Map
MSN Map
OSM Map
General Map
Google Map
MSN Map
OSM Map
Google Map
MSN Map
OSM Map
Google Map
MSN Map
Please wait while loading the map...
Real estate property taxes paid for housing units in 2022:
This zip code:
0.4% ($3,225)
Colorado:
0.5% ($2,422)
Median real estate property taxes paid for housing units with mortgages in 2022: $3,315 (0.4%) Median real estate property taxes paid for housing units with no mortgage in 2022: $3,167 (0.4%)
Estimated median house/condo value in 2022: $771,742
80113:
$771,742
Colorado:
$531,100
According to our research of Colorado and other state lists, there were 13 registered sex offenders living in 80113 zip code as of April 25, 2024. The ratio of all residents to sex offenders in zip code 80113 is 1,733 to 1. The ratio of registered sex offenders to all residents in this zip code is much lower than the state average.
Median resident age:
This zip code:
39.6 years
Colorado median age:
37.7 years
Average household size:
This zip code:
2.1 people
Colorado:
2.4 people
Averages for the 2020 tax year for zip code 80113, filed in 2021:
Average Adjusted Gross Income (AGI) in 2020: $243,595 (Individual Income Tax Returns)
Here:
$243,595
State:
$89,260
Salary/wage: $126,948 (reported on 81.7% of returns)
Here:
$126,948
State:
$70,330
(% of AGI for various income ranges: 1253.4% for AGIs below $25k, 3936.2% for AGIs $25k-50k, 7181.0% for AGIs $50k-75k, 10803.6% for AGIs $75k-100k, 18827.1% for AGIs $100k-200k, 236682.4% for AGIs over 200k)
Taxable interest for individuals: $11,632 (reported on 37.6% of returns)
This zip code:
$11,632
Colorado:
$2,176
(% of AGI for various income ranges: 26.4% for AGIs below $25k, 25.4% for AGIs $25k-50k, 47.3% for AGIs $50k-75k, 76.6% for AGIs $75k-100k, 329.6% for AGIs $100k-200k, 13889.7% for AGIs over 200k)
Ordinary dividends: $33,931 (reported on 33.9% of returns)
Here:
$33,931
State:
$8,820
(% of AGI for various income ranges: 84.3% for AGIs below $25k, 69.7% for AGIs $25k-50k, 161.3% for AGIs $50k-75k, 411.0% for AGIs $75k-100k, 1051.0% for AGIs $100k-200k, 35396.1% for AGIs over 200k)
Net capital gain/loss in AGI: +$195,404 (reported on 32.6% of returns)
Here:
+$195,404
State:
+$37,276
(% of AGI for various income ranges: 54.7% for AGIs below $25k, 68.6% for AGIs $25k-50k, 161.9% for AGIs $50k-75k, 369.4% for AGIs $75k-100k, 1437.9% for AGIs $100k-200k, 218228.5% for AGIs over 200k)
Profit/loss from business: +$31,192 (reported on 18.8% of returns)
Here:
+$31,192
State:
+$15,295
(% of AGI for various income ranges: 165.9% for AGIs below $25k, 154.9% for AGIs $25k-50k, 193.0% for AGIs $50k-75k, 423.0% for AGIs $75k-100k, 1222.8% for AGIs $100k-200k, 14155.8% for AGIs over 200k)
Taxable individual retirement arrangement distribution: $31,040 (reported on 8.7% of returns)
80113:
$31,040
Colorado:
$23,785
(% of AGI for various income ranges: 51.8% for AGIs below $25k, 72.3% for AGIs $25k-50k, 159.4% for AGIs $50k-75k, 333.6% for AGIs $75k-100k, 940.2% for AGIs $100k-200k, 5183.0% for AGIs over 200k)
Self-employed (Keogh) retirement plans: $33,935 (reported on 2.0% of returns)
80113:
$33,935
Colorado:
$23,633
(% of AGI for various income ranges: 12.5% for AGIs $25k-50k, 69.5% for AGIs $100k-200k, 2118.5% for AGIs over 200k)
Total itemized deductions: $64,412 (reported on 18.7% of returns)
Here:
$64,412
State:
$35,141
(% of AGI for various income ranges: 71.5% for AGIs below $25k, 105.1% for AGIs $25k-50k, 367.9% for AGIs $50k-75k, 790.6% for AGIs $75k-100k, 1919.4% for AGIs $100k-200k, 33408.8% for AGIs over 200k)
Charity contributions: $36,523 (reported on 15.5% of returns)
Here:
$36,523
State:
$12,103
(% of AGI for various income ranges: 5.0% for AGIs below $25k, 8.3% for AGIs $25k-50k, 51.4% for AGIs $50k-75k, 96.6% for AGIs $75k-100k, 266.2% for AGIs $100k-200k, 18687.9% for AGIs over 200k)
Taxes paid: $8,351 (reported on 18.5% of returns)
80113:
$8,351
State:
$7,710
(% of AGI for various income ranges: 13.6% for AGIs below $25k, 16.5% for AGIs $25k-50k, 77.9% for AGIs $50k-75k, 208.4% for AGIs $75k-100k, 509.2% for AGIs $100k-200k, 3274.5% for AGIs over 200k)
Earned income credit: $1,469 (reported on 8.4% of returns)
Here:
$1,469
State:
$2,053
(% of AGI for various income ranges: 50.8% for AGIs below $25k, 25.0% for AGIs $25k-50k)
Percentage of individuals using paid preparers for their 2020 taxes: 93.3%
Here:
93%
State:
93%
(% for various income ranges: 90.9% for AGIs below $25k, 93.7% for AGIs $25k-50k, 94.6% for AGIs $50k-75k, 93.5% for AGIs $75k-100k, 94.2% for AGIs $100k-200k, 93.9% for AGIs over 200k)
Averages for the 2012 tax year for zip code 80113, filed in 2013:
Average Adjusted Gross Income (AGI) in 2012: $219,413 (Individual Income Tax Returns)
Here:
$219,413
State:
$69,103
Salary/wage: $114,638 (reported on 80.7% of returns)
Here:
$114,638
State:
$54,794
(% of AGI for various income ranges: 74.9% for AGIs below $25k, 83.6% for AGIs $25k-50k, 77.1% for AGIs $50k-75k, 75.7% for AGIs $75k-100k, 62.4% for AGIs $100k-200k, 35.2% for AGIs over 200k)
Taxable interest for individuals: $13,050 (reported on 38.7% of returns)
This zip code:
$13,050
Colorado:
$1,971
(% of AGI for various income ranges: 1.9% for AGIs below $25k, 0.7% for AGIs $25k-50k, 0.9% for AGIs $50k-75k, 1.1% for AGIs $75k-100k, 1.6% for AGIs $100k-200k, 2.5% for AGIs over 200k)
Ordinary dividends: $33,124 (reported on 32.0% of returns)
Here:
$33,124
State:
$7,140
(% of AGI for various income ranges: 4.0% for AGIs below $25k, 1.9% for AGIs $25k-50k, 2.8% for AGIs $50k-75k, 3.0% for AGIs $75k-100k, 4.7% for AGIs $100k-200k, 5.2% for AGIs over 200k)
Net capital gain/loss in AGI: +$211,594 (reported on 28.6% of returns)
Here:
+$211,594
State:
+$23,009
(% of AGI for various income ranges: 0.7% for AGIs below $25k, 0.9% for AGIs $25k-50k, 1.1% for AGIs $50k-75k, 1.6% for AGIs $75k-100k, 4.7% for AGIs $100k-200k, 33.2% for AGIs over 200k)
Profit/loss from business: +$33,521 (reported on 17.2% of returns)
Here:
+$33,521
State:
+$13,514
(% of AGI for various income ranges: 9.1% for AGIs below $25k, 3.4% for AGIs $25k-50k, 3.0% for AGIs $50k-75k, 2.8% for AGIs $75k-100k, 5.6% for AGIs $100k-200k, 2.2% for AGIs over 200k)
Taxable individual retirement arrangement distribution: $41,737 (reported on 11.0% of returns)
80113:
$41,737
Colorado:
$17,927
(% of AGI for various income ranges: 2.9% for AGIs below $25k, 2.0% for AGIs $25k-50k, 2.7% for AGIs $50k-75k, 3.5% for AGIs $75k-100k, 5.3% for AGIs $100k-200k, 1.8% for AGIs over 200k)
Self-employment retirement plans: $33,460 (reported on 1.9% of returns)
80113:
$33,460
Colorado:
$19,483
(% of AGI for various income ranges: 0.3% for AGIs below $25k, 0.4% for AGIs $100k-200k, 0.3% for AGIs over 200k)
Total itemized deductions: $71,046 (14% of AGI, reported on 38.6% of returns)
Here:
$71,046
State:
$24,621
Here:
13.8% of AGI
State:
18.5% of AGI
(% of AGI for various income ranges: 13.9% for AGIs below $25k, 9.9% for AGIs $25k-50k, 14.0% for AGIs $50k-75k, 15.6% for AGIs $75k-100k, 17.8% for AGIs $100k-200k, 12.1% for AGIs over 200k)
Charity contributions: $20,090 (reported on 32.5% of returns)
Here:
$20,090
State:
$4,449
(% of AGI for various income ranges: 0.9% for AGIs below $25k, 0.9% for AGIs $25k-50k, 1.4% for AGIs $50k-75k, 2.1% for AGIs $75k-100k, 2.3% for AGIs $100k-200k, 3.3% for AGIs over 200k)
Taxes paid: $31,217 (reported on 38.4% of returns)
80113:
$31,217
State:
$7,641
(% of AGI for various income ranges: 2.2% for AGIs below $25k, 1.9% for AGIs $25k-50k, 3.3% for AGIs $50k-75k, 4.5% for AGIs $75k-100k, 5.9% for AGIs $100k-200k, 5.8% for AGIs over 200k)
Earned income credit: $1,589 (reported on 11.9% of returns)
Here:
$1,589
State:
$2,095
(% of AGI for various income ranges: 3.6% for AGIs below $25k, 0.5% for AGIs $25k-50k)
Percentage of individuals using paid preparers for their 2012 taxes: 53.0%
Here:
53%
State:
49%
(% for various income ranges: 47.6% for AGIs below $25k, 43.2% for AGIs $25k-50k, 47.9% for AGIs $50k-75k, 50.7% for AGIs $75k-100k, 65.6% for AGIs $100k-200k, 87.6% for AGIs over 200k)
Averages for the 2004 tax year for zip code 80113, filed in 2005:
Average Adjusted Gross Income (AGI) in 2004: $145,730 (Individual Income Tax Returns)
Here:
$145,730
State:
$55,014
Salary/wage: $73,391 (reported on 80.2% of returns)
Here:
$73,391
State:
$46,010
(% of AGI for various income ranges: 78.3% for AGIs $10k-25k, 85.4% for AGIs $25k-50k, 78.7% for AGIs $50k-75k, 74.0% for AGIs $75k-100k, 30.7% for AGIs over 100k)
Taxable interest for individuals: $12,104 (reported on 46.6% of returns)
This zip code:
$12,104
Colorado:
$2,127
(% of AGI for various income ranges: 2.2% for AGIs $10k-25k, 1.7% for AGIs $25k-50k, 1.8% for AGIs $50k-75k, 2.8% for AGIs $75k-100k, 4.1% for AGIs over 100k)
Taxable dividends: $18,995 (reported on 34.1% of returns)
Here:
$18,995
State:
$3,782
(% of AGI for various income ranges: 2.7% for AGIs $10k-25k, 1.7% for AGIs $25k-50k, 2.2% for AGIs $50k-75k, 3.2% for AGIs $75k-100k, 4.7% for AGIs over 100k)
Net capital gain/loss: +$158,141 (reported on 30.5% of returns)
Here:
+$158,141
State:
+$17,882
(% of AGI for various income ranges: 1.5% for AGIs $10k-25k, 0.8% for AGIs $25k-50k, 2.1% for AGIs $50k-75k, 2.4% for AGIs $75k-100k, 39.0% for AGIs over 100k)
Profit/loss from business: +$23,401 (reported on 16.4% of returns)
Here:
+$23,401
State:
+$11,247
(% of AGI for various income ranges: 6.0% for AGIs $10k-25k, 1.8% for AGIs $25k-50k, 3.2% for AGIs $50k-75k, 3.0% for AGIs $75k-100k, 2.5% for AGIs over 100k)
Profit/loss from farming: +$2,000 (reported on 0.2% of returns)
Here:
+$2,000
State:
-$7,127
IRA payment deduction: $3,123 (reported on 2.5% of returns)
80113:
$3,123
Colorado:
$2,947
(% of AGI for various income ranges: 0.2% for AGIs $10k-25k, 0.2% for AGIs $25k-50k, 0.2% for AGIs $50k-75k, 0.2% for AGIs $75k-100k, 0.0% for AGIs over 100k)
Self-employed pension: $25,208 (reported on 2.2% of returns)
Here:
$25,208
Colorado:
$13,653
Total itemized deductions: $50,128 (15% of AGI, reported on 38.4% of returns)
Here:
$50,128
State:
$20,560
Here:
14.6% of AGI
State:
21.4% of AGI
(% of AGI for various income ranges: 10.9% for AGIs $10k-25k, 13.9% for AGIs $25k-50k, 17.8% for AGIs $50k-75k, 19.7% for AGIs $75k-100k, 12.4% for AGIs over 100k)
Charity contributions deductions: $21,364 (6% of AGI, reported on 33.5% of returns)
Here:
$21,364
State:
$3,518
Here:
5.6% of AGI
State:
3.4% of AGI
(% of AGI for various income ranges: 1.0% for AGIs $10k-25k, 1.3% for AGIs $25k-50k, 2.0% for AGIs $50k-75k, 2.6% for AGIs $75k-100k, 5.5% for AGIs over 100k)
Total tax: $35,977 (reported on 79.5% of returns)
80113:
$35,977
State:
$9,173
(% of AGI for various income ranges: 5.1% for AGIs $10k-25k, 8.1% for AGIs $25k-50k, 10.2% for AGIs $50k-75k, 11.0% for AGIs $75k-100k, 21.5% for AGIs over 100k)
Earned income credit: $1,378 (reported on 10.3% of returns)
Here:
$1,378
State:
$1,595
Percentage of individuals using paid preparers for their 2004 taxes: 57.1%
Here:
57%
State:
55%
(% for various income ranges: 57.2% for AGIs below $10k, 51.7% for AGIs $10k-25k, 49.0% for AGIs $25k-50k, 56.9% for AGIs $50k-75k, 58.8% for AGIs $75k-100k, 80.1% for AGIs over 100k)
Likely homosexual households (counted as self-reported same-sex unmarried-partner households)
Lesbian couples: 0.2% of all households
Gay men: 0.3% of all households
Household received Food Stamps/SNAP in the past 12 months: 971 Household did not receive Food Stamps/SNAP in the past 12 months: 10,082
Women who had a birth in the past 12 months: 275 (242 now married, 35 unmarried) Women who did not have a birth in the past 12 months: 5,567 (2,232 now married, 3,342 unmarried)
Housing units in zip code 80113 with a mortgage: 3,606 (572 second mortgage, 7 home equity loan, 481 both second mortgage and home equity loan) Houses without a mortgage: 50
Median monthly owner costs for units with a mortgage: $2,517 Median monthly owner costs for units without a mortgage: $781
Residents with income below the poverty level in 2022:
This zip code:
7.3%
Whole state:
9.4%
Residents with income below 50% of the poverty level in 2022:
This zip code:
3.9%
Whole state:
4.6%
Median number of rooms in houses and condos:
Here:
7.6
State:
6.8
Median number of rooms in apartments:
Here:
3.5
State:
4.0
Notable locations in this zip code not listed on our city pages
Notable locations in zip code 80113: Cherry Hills Country Club (A), Glennmoor Country Club (B), Englewood High School Stadium (C), Cherry Hills Village City Hall (D), Cherry Hills Village Police Department (E), South Metro Fire Rescue Authority Station 38 (F), Swedish Medical Center Library (G). Display/hide their locations on the map
Churches in zip code 80113 include: Bethany Lutheran Church (A), First Plymouth Congregational Church (B), Colorado Community Church Englewood Campus (C), Denver First Church of the Nazarene (D), Seventh - Day Adventist Reformed Church (E), Saint Mark Coptic Orthodox Church (F), Saint Louis Catholic Church (G), Korean Emmanuel United Methodist Church (H), First Baptist Church of Englewood (I). Display/hide their locations on the map
Lakes and reservoirs: Buell Lake (A), Blackmer Number 1 Reservoir (B), Skeel Ranch Reservoir (C), Cherry Hills Lake (D), Blackmer Lake (E). Display/hide their locations on the map
Parks in zip code 80113 include: Barde Park (1), Woody Hollow Park (2), David W Brown House (3), Hopkins Farm (4), Bates-Logan Park (5), Dahlia Hollow Park (6), Elsie Duncan Park (7), Packy Romans Park (8), Three Pond Park (9). Display/hide their locations on the map
3,055 married couples with children.
957 single-parent households (252 men, 705 women).
90.6% of residents of 80113 zip code speak English at home.
6.4% of residents speak Spanish at home (84% very well, 9% well, 5% not well, 2% not at all).
2.0% of residents speak other Indo-European language at home (91% very well, 5% well, 4% not well).
0.7% of residents speak Asian or Pacific Island language at home (78% very well, 8% well, 14% not at all).
0.2% of residents speak other language at home (50% very well, 12% well, 38% not well).
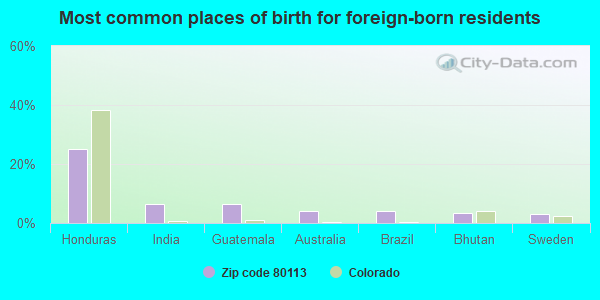
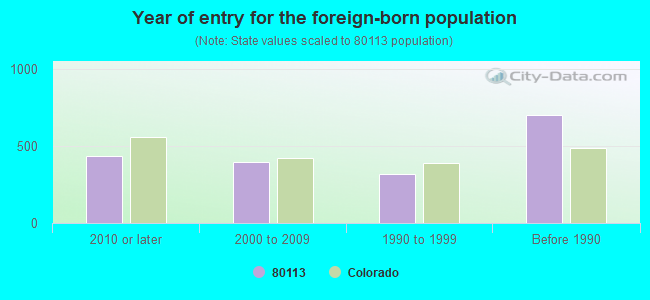
Foreign born population: 1,382 (6.0%) (61.9% of them are naturalized citizens)
This zip code:
6.0%
Whole state:
9.5%
25%Honduras
7%India
6%Guatemala
4%Australia
4%Brazil
3%Bhutan
3%Sweden
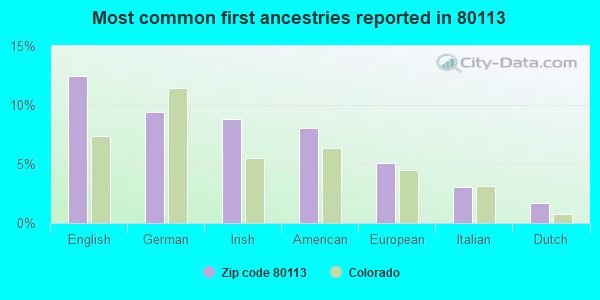
12%English
9%German
9%Irish
8%American
5%European
3%Italian
2%Dutch
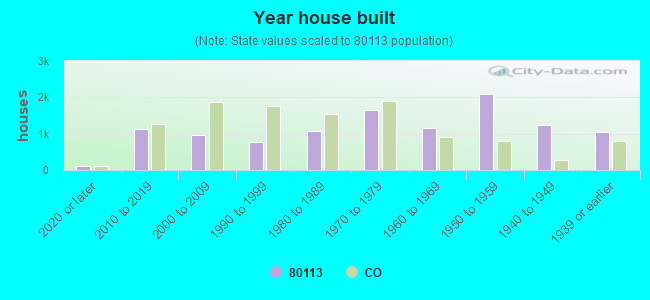
Year of entry for the foreign-born population
4372010 or later
3992000 to 2009
3161990 to 1999
701Before 1990
Facilities with environmental interests located in this zip code:
ALL SOULS CATHOLIC EDUCATION FOUNDATION (4951 SOUTH PENNSYLVANIA STREET in ENGLEWOOD, CO)
ENFORCEMENT/COMPLIANCE ACTIVITY (Integrated Compliance Information System) COMPLIANCE ACTIVITY (Tracking inspections of insecticide, fungicide, and rodenticide, and toxic substances) Alternative names: ALL SOULS SCHOOL
Housing units lacking complete plumbing facilities: 0.5% Housing units lacking complete kitchen facilities: 0.4%
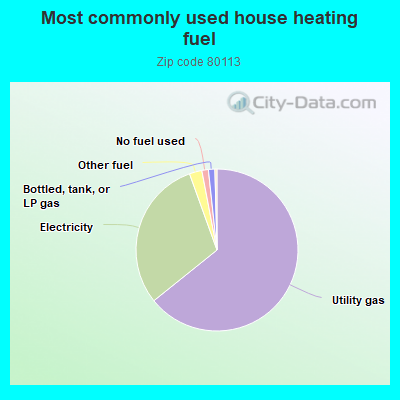
64.3%Utility gas
30.3%Electricity
2.5%Other fuel
1.3%No fuel used
1.3%Bottled, tank, or LP gas
Place of birth for U.S.-born residents:
This state: 9,405
Northeast: 1,980
Midwest: 4,266
South: 3,020
West: 2,520
84% of the 80113 zip code residents lived in the same house 1 year ago. Out of people who lived in different houses, 24% moved from this county. Out of people who lived in different houses, 57% moved from different county within same state. Out of people who lived in different houses, 18% moved from different state. Out of people who lived in different houses, 3% moved from abroad.
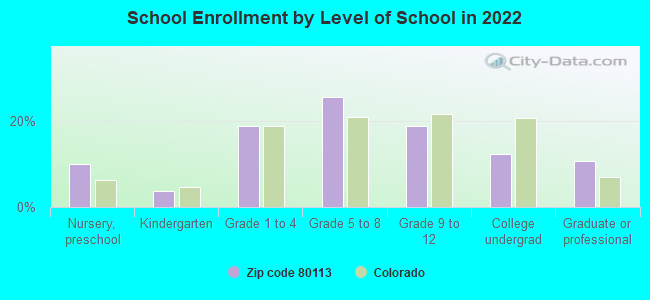
Private vs. public school enrollment:
Students in private schools in grades 1 to 8 (elementary and middle school): 503
Here:
24.9%
Colorado:
11.4%
Students in private schools in grades 9 to 12 (high school): 285
Here:
33.8%
Colorado:
8.5%
Students in private undergraduate colleges: 165
Here:
29.6%
Colorado:
14.0%
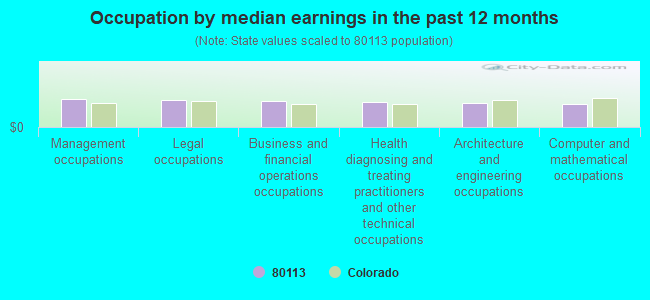
Occupation by median earnings in the past 12 months ($)
103,769Management occupations
101,970Legal occupations
98,015Business and financial operations occupations
93,476Health diagnosing and treating practitioners and other technical occupations
90,524Architecture and engineering occupations
87,977Computer and mathematical occupations
Top industries in this zip code by the number of employees in 2005:
Health Care and Social Assistance: Specialty (except Psychiatric and Substance Abuse) Hospitals (500-999 employees: 1 establishment)
Other Services (except Public Administration): Religious Organizations (100-249: 1, 50-99: 2, 20-49: 1, 10-19: 2, 5-9: 2, 1-4: 2)
Educational Services: Elementary and Secondary Schools (100-249: 1, 20-49: 1)
Health Care and Social Assistance: Offices of Physical, Occupational and Speech Therapists, and Audiologists (100-249: 1, 1-4: 2)
Finance and Insurance: Financial Transactions Processing, Reserve, and Clearinghouse Activities (100-249: 1)
Accommodation and Food Services: Full-Service Restaurants (50-99: 1, 1-4: 4)
Health Care and Social Assistance: Offices of Physicians (except Mental Health Specialists) (10-19: 2, 5-9: 4, 1-4: 8)
Professional, Scientific, and Technical Services: Offices of Lawyers (10-19: 1, 5-9: 1, 1-4: 2)
Fatal accident statistics in 2014:
Fatal accident count: 1
Vehicles involved in fatal accidents: 1
Fatal accidents caused by drunken drivers: 0
Fatalities: 1
Persons involved in fatal accidents: 1
Pedestrians involved in fatal accidents: 1
Fatal accident statistics in 2012:
Fatal accident count: 1
Vehicles involved in fatal accidents: 2
Fatal accidents caused by drunken drivers: 1
Fatalities: 1
Persons involved in fatal accidents: 1
Pedestrians involved in fatal accidents: 2
2004 - 2018 National Fire Incident Reporting System (NFIRS) incidents
According to the data from the years 2004 - 2018 the average number of fire incidents per year is 40. The highest number of fire incidents - 60 took place in 2017, and the least - 17 in 2018. The data has a dropping trend.
When looking into fire subcategories, the most reports belonged to: Outside Fires (40.7%), and Structure Fires (38.3%).
Fire incident types reported to NFIRS in Zip Code 80113


+$2,000
-$7,127


 According to the data from the years 2004 - 2018 the average number of fire incidents per year is 40. The highest number of fire incidents - 60 took place in 2017, and the least - 17 in 2018. The data has a dropping trend.
 When looking into fire subcategories, the most reports belonged to: Outside Fires (40.7%), and Structure Fires (38.3%).