Estimated zip code population in 2022: 10,637 Zip code population in 2010: 7,559 Zip code population in 2000: 2,138
Houses and condos: 5,657 Renter-occupied apartments: 2,826
% of renters here:
52%
State:
34%
March 2022 cost of living index in zip code 80230: 113.1 (more than average, U.S. average is 100)
Land area: 2.5 sq. mi. Water area: 0.0 sq. mi.
Population density: 4,274 people per square mile
(average).
OSM Map
General Map
Google Map
MSN Map
OSM Map
General Map
Google Map
MSN Map
OSM Map
General Map
Google Map
MSN Map
OSM Map
General Map
Google Map
MSN Map
Please wait while loading the map...
Real estate property taxes paid for housing units in 2022:
This zip code:
0.4% ($3,706)
Colorado:
0.5% ($2,422)
Median real estate property taxes paid for housing units with mortgages in 2022: $3,917 (0.4%) Median real estate property taxes paid for housing units with no mortgage in 2022: $2,753 (0.4%)
Estimated median house/condo value in 2022: $889,156
80230:
$889,156
Colorado:
$531,100
According to our research of Colorado and other state lists, there were 3 registered sex offenders living in 80230 zip code as of April 23, 2024. The ratio of all residents to sex offenders in zip code 80230 is 2,871 to 1. The ratio of registered sex offenders to all residents in this zip code is much lower than the state average.
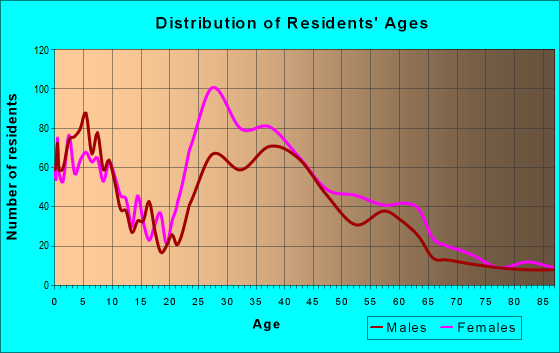
Median resident age:
This zip code:
45.4 years
Colorado median age:
37.7 years
Average household size:
This zip code:
2.0 people
Colorado:
2.4 people
Averages for the 2020 tax year for zip code 80230, filed in 2021:
Average Adjusted Gross Income (AGI) in 2020: $133,782 (Individual Income Tax Returns)
Here:
$133,782
State:
$89,260
Salary/wage: $102,270 (reported on 82.8% of returns)
Here:
$102,270
State:
$70,330
(% of AGI for various income ranges: 1158.3% for AGIs below $25k, 3760.6% for AGIs $25k-50k, 6786.2% for AGIs $50k-75k, 10093.2% for AGIs $75k-100k, 18604.7% for AGIs $100k-200k, 96513.1% for AGIs over 200k)
Taxable interest for individuals: $2,461 (reported on 39.3% of returns)
This zip code:
$2,461
Colorado:
$2,176
(% of AGI for various income ranges: 9.9% for AGIs below $25k, 16.0% for AGIs $25k-50k, 26.8% for AGIs $50k-75k, 136.4% for AGIs $75k-100k, 204.7% for AGIs $100k-200k, 1298.8% for AGIs over 200k)
Ordinary dividends: $9,789 (reported on 36.6% of returns)
Here:
$9,789
State:
$8,820
(% of AGI for various income ranges: 55.6% for AGIs below $25k, 59.9% for AGIs $25k-50k, 162.0% for AGIs $50k-75k, 343.9% for AGIs $75k-100k, 813.5% for AGIs $100k-200k, 4697.7% for AGIs over 200k)
Net capital gain/loss in AGI: +$37,048 (reported on 34.1% of returns)
Here:
+$37,048
State:
+$37,276
(% of AGI for various income ranges: 72.1% for AGIs below $25k, 79.3% for AGIs $25k-50k, 132.7% for AGIs $50k-75k, 225.0% for AGIs $75k-100k, 1287.7% for AGIs $100k-200k, 21957.7% for AGIs over 200k)
Profit/loss from business: +$23,770 (reported on 19.8% of returns)
Here:
+$23,770
State:
+$15,295
(% of AGI for various income ranges: 134.2% for AGIs below $25k, 173.0% for AGIs $25k-50k, 335.5% for AGIs $50k-75k, 390.7% for AGIs $75k-100k, 998.4% for AGIs $100k-200k, 5588.8% for AGIs over 200k)
Taxable individual retirement arrangement distribution: $37,615 (reported on 10.5% of returns)
80230:
$37,615
Colorado:
$23,785
(% of AGI for various income ranges: 49.9% for AGIs below $25k, 94.9% for AGIs $25k-50k, 214.8% for AGIs $50k-75k, 388.9% for AGIs $75k-100k, 1617.7% for AGIs $100k-200k, 3810.0% for AGIs over 200k)
Self-employed (Keogh) retirement plans: $30,009 (reported on 2.1% of returns)
80230:
$30,009
Colorado:
$23,633
(% of AGI for various income ranges: 156.1% for AGIs $75k-100k, 1101.5% for AGIs over 200k)
Total itemized deductions: $36,572 (reported on 20.9% of returns)
Here:
$36,572
State:
$35,141
(% of AGI for various income ranges: 57.6% for AGIs below $25k, 179.3% for AGIs $25k-50k, 299.6% for AGIs $50k-75k, 823.6% for AGIs $75k-100k, 2023.7% for AGIs $100k-200k, 9581.2% for AGIs over 200k)
Charity contributions: $11,515 (reported on 18.0% of returns)
Here:
$11,515
State:
$12,103
(% of AGI for various income ranges: 22.2% for AGIs $25k-50k, 35.7% for AGIs $50k-75k, 93.9% for AGIs $75k-100k, 290.0% for AGIs $100k-200k, 3391.9% for AGIs over 200k)
Taxes paid: $8,776 (reported on 20.9% of returns)
80230:
$8,776
State:
$7,710
(% of AGI for various income ranges: 38.1% for AGIs $25k-50k, 64.5% for AGIs $50k-75k, 205.7% for AGIs $75k-100k, 642.1% for AGIs $100k-200k, 2104.2% for AGIs over 200k)
Earned income credit: $2,018 (reported on 8.7% of returns)
Here:
$2,018
State:
$2,053
(% of AGI for various income ranges: 69.9% for AGIs below $25k, 44.8% for AGIs $25k-50k)
Percentage of individuals using paid preparers for their 2020 taxes: 94.8%
Here:
95%
State:
93%
(% for various income ranges: 92.1% for AGIs below $25k, 95.2% for AGIs $25k-50k, 94.8% for AGIs $50k-75k, 97.7% for AGIs $75k-100k, 95.4% for AGIs $100k-200k, 95.6% for AGIs over 200k)
Averages for the 2012 tax year for zip code 80230, filed in 2013:
Average Adjusted Gross Income (AGI) in 2012: $118,515 (Individual Income Tax Returns)
Here:
$118,515
State:
$69,103
Salary/wage: $97,223 (reported on 84.0% of returns)
Here:
$97,223
State:
$54,794
(% of AGI for various income ranges: 73.8% for AGIs below $25k, 83.6% for AGIs $25k-50k, 78.6% for AGIs $50k-75k, 78.0% for AGIs $75k-100k, 77.2% for AGIs $100k-200k, 61.4% for AGIs over 200k)
Taxable interest for individuals: $2,573 (reported on 45.2% of returns)
This zip code:
$2,573
Colorado:
$1,971
(% of AGI for various income ranges: 1.5% for AGIs below $25k, 0.7% for AGIs $25k-50k, 0.6% for AGIs $50k-75k, 0.8% for AGIs $75k-100k, 0.7% for AGIs $100k-200k, 1.2% for AGIs over 200k)
Ordinary dividends: $7,899 (reported on 37.0% of returns)
Here:
$7,899
State:
$7,140
(% of AGI for various income ranges: 3.4% for AGIs below $25k, 2.0% for AGIs $25k-50k, 2.2% for AGIs $50k-75k, 2.2% for AGIs $75k-100k, 2.6% for AGIs $100k-200k, 2.5% for AGIs over 200k)
Net capital gain/loss in AGI: +$20,475 (reported on 34.3% of returns)
Here:
+$20,475
State:
+$23,009
(% of AGI for various income ranges: 0.1% for AGIs below $25k, 0.5% for AGIs $25k-50k, 0.9% for AGIs $50k-75k, 1.3% for AGIs $75k-100k, 2.0% for AGIs $100k-200k, 9.6% for AGIs over 200k)
Profit/loss from business: +$21,285 (reported on 19.5% of returns)
Here:
+$21,285
State:
+$13,514
(% of AGI for various income ranges: 10.1% for AGIs below $25k, 3.3% for AGIs $25k-50k, 3.3% for AGIs $50k-75k, 3.3% for AGIs $75k-100k, 4.2% for AGIs $100k-200k, 3.0% for AGIs over 200k)
Taxable individual retirement arrangement distribution: $24,855 (reported on 9.9% of returns)
80230:
$24,855
Colorado:
$17,927
(% of AGI for various income ranges: 3.1% for AGIs below $25k, 2.8% for AGIs $25k-50k, 2.4% for AGIs $50k-75k, 3.2% for AGIs $75k-100k, 3.2% for AGIs $100k-200k, 1.3% for AGIs over 200k)
Self-employment retirement plans: $22,267 (reported on 3.0% of returns)
80230:
$22,267
Colorado:
$19,483
(% of AGI for various income ranges: 0.6% for AGIs $25k-50k, 0.5% for AGIs $100k-200k, 0.7% for AGIs over 200k)
Total itemized deductions: $32,084 (16% of AGI, reported on 48.4% of returns)
Here:
$32,084
State:
$24,621
Here:
15.9% of AGI
State:
18.5% of AGI
(% of AGI for various income ranges: 12.9% for AGIs below $25k, 9.3% for AGIs $25k-50k, 13.4% for AGIs $50k-75k, 14.6% for AGIs $75k-100k, 15.3% for AGIs $100k-200k, 12.4% for AGIs over 200k)
Charity contributions: $5,572 (reported on 42.7% of returns)
Here:
$5,572
State:
$4,449
(% of AGI for various income ranges: 1.1% for AGIs below $25k, 0.7% for AGIs $25k-50k, 1.3% for AGIs $50k-75k, 1.6% for AGIs $75k-100k, 1.7% for AGIs $100k-200k, 2.5% for AGIs over 200k)
Taxes paid: $11,615 (reported on 48.4% of returns)
80230:
$11,615
State:
$7,641
(% of AGI for various income ranges: 2.3% for AGIs below $25k, 1.7% for AGIs $25k-50k, 3.5% for AGIs $50k-75k, 4.2% for AGIs $75k-100k, 5.0% for AGIs $100k-200k, 5.3% for AGIs over 200k)
Earned income credit: $2,000 (reported on 9.4% of returns)
Here:
$2,000
State:
$2,095
(% of AGI for various income ranges: 5.4% for AGIs below $25k, 0.4% for AGIs $25k-50k)
Percentage of individuals using paid preparers for their 2012 taxes: 54.3%
Here:
54%
State:
49%
(% for various income ranges: 49.5% for AGIs below $25k, 39.2% for AGIs $25k-50k, 50.0% for AGIs $50k-75k, 58.8% for AGIs $75k-100k, 59.7% for AGIs $100k-200k, 77.6% for AGIs over 200k)
Averages for the 2004 tax year for zip code 80230, filed in 2005:
Average Adjusted Gross Income (AGI) in 2004: $95,055 (Individual Income Tax Returns)
Here:
$95,055
State:
$55,014
Salary/wage: $76,434 (reported on 85.7% of returns)
Here:
$76,434
State:
$46,010
(% of AGI for various income ranges: 183.0% for AGIs below $10k, 83.0% for AGIs $10k-25k, 86.3% for AGIs $25k-50k, 78.4% for AGIs $50k-75k, 78.0% for AGIs $75k-100k, 63.7% for AGIs over 100k)
Taxable interest for individuals: $6,394 (reported on 53.2% of returns)
This zip code:
$6,394
Colorado:
$2,127
(% of AGI for various income ranges: 10.5% for AGIs below $10k, 2.7% for AGIs $10k-25k, 0.9% for AGIs $25k-50k, 2.0% for AGIs $50k-75k, 1.8% for AGIs $75k-100k, 4.3% for AGIs over 100k)
Taxable dividends: $4,505 (reported on 41.0% of returns)
Here:
$4,505
State:
$3,782
(% of AGI for various income ranges: 17.4% for AGIs below $10k, 2.8% for AGIs $10k-25k, 1.4% for AGIs $25k-50k, 2.7% for AGIs $50k-75k, 2.0% for AGIs $75k-100k, 1.8% for AGIs over 100k)
Net capital gain/loss: +$35,941 (reported on 36.2% of returns)
Here:
+$35,941
State:
+$17,882
(% of AGI for various income ranges: 18.9% for AGIs below $10k, 1.5% for AGIs $10k-25k, 0.9% for AGIs $25k-50k, 0.5% for AGIs $50k-75k, 1.1% for AGIs $75k-100k, 18.4% for AGIs over 100k)
Profit/loss from business: +$22,307 (reported on 18.9% of returns)
Here:
+$22,307
State:
+$11,247
(% of AGI for various income ranges: 11.5% for AGIs below $10k, 3.0% for AGIs $10k-25k, 3.8% for AGIs $25k-50k, 4.9% for AGIs $50k-75k, 3.2% for AGIs $75k-100k, 4.6% for AGIs over 100k)
IRA payment deduction: $3,111 (reported on 2.7% of returns)
80230:
$3,111
Colorado:
$2,947
Self-employed pension: $16,695 (reported on 3.5% of returns)
Here:
$16,695
Colorado:
$13,653
Total itemized deductions: $29,423 (18% of AGI, reported on 47.6% of returns)
Here:
$29,423
State:
$20,560
Here:
17.7% of AGI
State:
21.4% of AGI
(% of AGI for various income ranges: 22.1% for AGIs below $10k, 11.6% for AGIs $10k-25k, 9.2% for AGIs $25k-50k, 15.6% for AGIs $50k-75k, 19.2% for AGIs $75k-100k, 15.0% for AGIs over 100k)
Charity contributions deductions: $4,579 (3% of AGI, reported on 44.2% of returns)
Here:
$4,579
State:
$3,518
Here:
2.6% of AGI
State:
3.4% of AGI
(% of AGI for various income ranges: 0.7% for AGIs below $10k, 1.1% for AGIs $10k-25k, 1.0% for AGIs $25k-50k, 1.9% for AGIs $50k-75k, 1.8% for AGIs $75k-100k, 2.4% for AGIs over 100k)
Total tax: $19,266 (reported on 83.6% of returns)
80230:
$19,266
State:
$9,173
(% of AGI for various income ranges: 6.3% for AGIs below $10k, 4.2% for AGIs $10k-25k, 9.4% for AGIs $25k-50k, 11.6% for AGIs $50k-75k, 12.4% for AGIs $75k-100k, 19.5% for AGIs over 100k)
Earned income credit: $1,602 (reported on 8.3% of returns)
Here:
$1,602
State:
$1,595
Percentage of individuals using paid preparers for their 2004 taxes: 55.5%
Here:
56%
State:
55%
(% for various income ranges: 52.5% for AGIs below $10k, 49.4% for AGIs $10k-25k, 43.7% for AGIs $25k-50k, 52.7% for AGIs $50k-75k, 59.5% for AGIs $75k-100k, 70.5% for AGIs over 100k)
Likely homosexual households (counted as self-reported same-sex unmarried-partner households)
Lesbian couples: 0.0% of all households
Gay men: 1.0% of all households
Household received Food Stamps/SNAP in the past 12 months: 210 Household did not receive Food Stamps/SNAP in the past 12 months: 5,202
Women who had a birth in the past 12 months: 151 (52 now married, 90 unmarried) Women who did not have a birth in the past 12 months: 2,460 (1,110 now married, 1,349 unmarried)
Housing units in zip code 80230 with a mortgage: 1,985 (343 second mortgage, 297 both second mortgage and home equity loan) Houses without a mortgage: 15
Median monthly owner costs for units with a mortgage: $2,701 Median monthly owner costs for units without a mortgage: $691
Residents with income below the poverty level in 2022:
This zip code:
8.6%
Whole state:
9.4%
Residents with income below 50% of the poverty level in 2022:
This zip code:
2.0%
Whole state:
4.6%
Median number of rooms in houses and condos:
Here:
6.9
State:
6.8
Median number of rooms in apartments:
Here:
3.3
State:
4.0
Notable locations in this zip code not listed on our city pages
Notable locations in zip code 80230: Mira Vista Golf Course (A), Wings Over the Rockies Air and Space Museum (B), Big Bear Ice Arena (C). Display/hide their locations on the map
In group quarters: 26 (-1 institutionalized population)
Size of family households: 1,702 2-persons, 655 3-persons, 535 4-persons, 50 5-persons, 14 6-persons
Size of nonfamily households: 2,095 1-person, 327 2-persons, 76 3-persons
1,264 married couples with children.
374 single-parent households (128 men, 246 women).
86.0% of residents of 80230 zip code speak English at home.
8.2% of residents speak Spanish at home (49% very well, 14% well, 37% not well).
3.4% of residents speak other Indo-European language at home (82% very well, 18% well).
2.1% of residents speak Asian or Pacific Island language at home (93% very well, 7% not well).
0.1% of residents speak other language at home (100% very well).
Foreign born population: 1,527 (14.4%) (52.6% of them are naturalized citizens)
Facilities with environmental interests located in this zip code:
BIG BEAR ICE ARENA (8580 LOWRY BOULEVARD in DENVER, CO)
AIR MINOR (AIRS/AFS) ENFORCEMENT/COMPLIANCE ACTIVITY (Integrated Compliance Information System) Business SIC classification: MEMBERSHIP SPORTS AND RECREATION CLUBS; AMUSEMENT AND RECREATION SERVICES
HUD CLEANUP FRONT RANGE ASBESTOS (1860 BERKELEY in DENVER, CO) . Federal Facility. DEPARTMENT OF HOUSING AND URBAN DEVELOPMENT
Housing units lacking complete kitchen facilities: 1.8%
66.0%Utility gas
33.5%Electricity
0.5%Solar energy
Place of birth for U.S.-born residents:
This state: 2,873
Northeast: 1,299
Midwest: 2,512
South: 1,227
West: 1,125
10% of the 80230 zip code residents lived in the same house 5 years ago. Out of people who lived in different houses, 52% lived in this county. Out of people who lived in different counties, 50% lived in Colorado.
74% of the 80230 zip code residents lived in the same house 1 year ago. Out of people who lived in different houses, 45% moved from this county. Out of people who lived in different houses, 15% moved from different county within same state. Out of people who lived in different houses, 26% moved from different state. Out of people who lived in different houses, 11% moved from abroad.
Private vs. public school enrollment:
Students in private schools in grades 1 to 8 (elementary and middle school): 327
Here:
36.6%
Colorado:
11.4%
Students in private schools in grades 9 to 12 (high school): 57
Here:
20.6%
Colorado:
8.5%
Students in private undergraduate colleges: 84
Here:
30.7%
Colorado:
14.0%
Occupation by median earnings in the past 12 months ($)
140,489Business and financial operations occupations
104,663Legal occupations
100,073Architecture and engineering occupations
92,278Management occupations
88,640Computer and mathematical occupations
74,746Health diagnosing and treating practitioners and other technical occupations
Companies with federal contracts located in this zip code:
LOWRY ECONOMIC REDEVELOPMENT A (555 UINTA WAY in DENVER, CO)
$103,836 with Army for Construction of Structures and Facilities -- Other Conservation and Development Facilities. Signed on 2000-03-23. Completion date: 2000-05-31.
BELLE BONFILS MEMORIAL BLOOD C (717 YOSEMITE CIRCLE in DENVER, CO)
-$10,350 with Air Force for Other Medical Services. Signed on 2005-07-12. Completion date: 2002-09-30.
Top industries in this zip code by the number of employees in 2005:
Real Estate and Rental and Leasing: Residential Property Managers (250-499 employees: 1 establishment, 20-49 employees: 1 establishment, 1-4 employees: 1 establishment)
Health Care and Social Assistance: Blood and Organ Banks (250-499: 1)
Educational Services: Elementary and Secondary Schools (50-99: 4)
Finance and Insurance: Insurance Agencies and Brokerages (100-249: 1)
Information: Internet Service Providers (100-249: 1)
Health Care and Social Assistance: Offices of Physicians (except Mental Health Specialists) (50-99: 1, 20-49: 1, 10-19: 1, 5-9: 1, 1-4: 1)
Accommodation and Food Services: Full-Service Restaurants (20-49: 2, 10-19: 1)
Health Care and Social Assistance: Medical Laboratories (50-99: 1, 5-9: 1)
Real Estate and Rental and Leasing: Video Tape and Disc Rental (20-49: 1)
People in group quarters in 2010:
23 people in residential treatment centers for juveniles (non-correctional)
People in group quarters in 2000:
10 people in homes for the mentally ill
Fatal accident statistics in 2013:
Fatal accident count: 3
Vehicles involved in fatal accidents: 6
Fatal accidents caused by drunken drivers: 0
Fatalities: 3
Persons involved in fatal accidents: 6
Pedestrians involved in fatal accidents: 1
Home Mortgage Disclosure Act Aggregated Statistics For Year 2009 (Based on 2 full and 2 partial tracts)
A) FHA, FSA/RHS & VA Home Purchase Loans
B) Conventional Home Purchase Loans
C) Refinancings
D) Home Improvement Loans
E) Loans on Dwellings For 5+ Families
F) Non-occupant Loans on < 5 Family Dwellings (A B C & D)
Number
Average Value
Number
Average Value
Number
Average Value
Number
Average Value
Number
Average Value
Number
Average Value
LOANS ORIGINATED
123
$208,281
208
$287,591
767
$314,953
20
$238,197
4
$38,428,125
53
$190,939
APPLICATIONS APPROVED, NOT ACCEPTED
8
$161,584
32
$305,556
57
$344,424
2
$259,635
0
$0
10
$299,532
APPLICATIONS DENIED
15
$233,921
20
$242,455
119
$323,382
6
$171,243
0
$0
12
$239,274
APPLICATIONS WITHDRAWN
3
$181,033
19
$215,274
90
$312,868
0
$0
4
$135,310
6
$162,045
FILES CLOSED FOR INCOMPLETENESS
2
$365,490
8
$414,419
13
$286,311
0
$0
0
$0
4
$298,638
Aggregated Statistics For Year 2008 (Based on 2 full and 2 partial tracts)
A) FHA, FSA/RHS & VA Home Purchase Loans
B) Conventional Home Purchase Loans
C) Refinancings
D) Home Improvement Loans
E) Loans on Dwellings For 5+ Families
F) Non-occupant Loans on < 5 Family Dwellings (A B C & D)
Number
Average Value
Number
Average Value
Number
Average Value
Number
Average Value
Number
Average Value
Number
Average Value
LOANS ORIGINATED
49
$229,669
323
$303,717
221
$295,548
9
$55,074
2
$3,020,765
42
$327,860
APPLICATIONS APPROVED, NOT ACCEPTED
3
$160,323
24
$240,808
23
$283,496
2
$120,005
0
$0
5
$265,376
APPLICATIONS DENIED
8
$276,739
42
$262,383
65
$413,839
6
$193,458
0
$0
1
$183,260
APPLICATIONS WITHDRAWN
4
$305,825
41
$333,230
57
$271,286
6
$391,452
0
$0
6
$271,483
FILES CLOSED FOR INCOMPLETENESS
0
$0
7
$243,629
9
$353,348
0
$0
0
$0
0
$0
Aggregated Statistics For Year 2007 (Based on 2 full and 2 partial tracts)
A) FHA, FSA/RHS & VA Home Purchase Loans
B) Conventional Home Purchase Loans
C) Refinancings
D) Home Improvement Loans
E) Loans on Dwellings For 5+ Families
F) Non-occupant Loans on < 5 Family Dwellings (A B C & D)
Number
Average Value
Number
Average Value
Number
Average Value
Number
Average Value
Number
Average Value
Number
Average Value
LOANS ORIGINATED
20
$187,574
415
$318,342
216
$304,478
19
$118,983
2
$237,680
43
$243,909
APPLICATIONS APPROVED, NOT ACCEPTED
0
$0
46
$289,883
25
$360,146
4
$26,268
0
$0
6
$391,690
APPLICATIONS DENIED
0
$0
33
$442,531
90
$244,393
11
$35,154
0
$0
17
$298,013
APPLICATIONS WITHDRAWN
0
$0
35
$213,362
34
$325,287
1
$482,880
0
$0
4
$312,092
FILES CLOSED FOR INCOMPLETENESS
0
$0
6
$597,677
8
$259,271
0
$0
0
$0
2
$449,370
Aggregated Statistics For Year 2006 (Based on 2 full and 2 partial tracts)
A) FHA, FSA/RHS & VA Home Purchase Loans
B) Conventional Home Purchase Loans
C) Refinancings
D) Home Improvement Loans
E) Loans on Dwellings For 5+ Families
F) Non-occupant Loans on < 5 Family Dwellings (A B C & D)
Number
Average Value
Number
Average Value
Number
Average Value
Number
Average Value
Number
Average Value
Number
Average Value
LOANS ORIGINATED
8
$232,175
579
$298,101
232
$277,235
26
$99,522
2
$13,231,450
105
$233,670
APPLICATIONS APPROVED, NOT ACCEPTED
0
$0
69
$248,301
36
$265,280
6
$40,277
0
$0
10
$160,478
APPLICATIONS DENIED
0
$0
67
$336,166
54
$265,656
4
$30,128
0
$0
14
$381,732
APPLICATIONS WITHDRAWN
0
$0
32
$219,092
66
$330,424
1
$77,580
0
$0
6
$253,233
FILES CLOSED FOR INCOMPLETENESS
0
$0
6
$610,448
14
$279,744
0
$0
0
$0
0
$0
Aggregated Statistics For Year 2005 (Based on 2 full and 2 partial tracts)
A) FHA, FSA/RHS & VA Home Purchase Loans
B) Conventional Home Purchase Loans
C) Refinancings
D) Home Improvement Loans
E) Loans on Dwellings For 5+ Families
F) Non-occupant Loans on < 5 Family Dwellings (A B C & D)
G) Loans On Manufactured Home Dwelling (A B C & D)
Number
Average Value
Number
Average Value
Number
Average Value
Number
Average Value
Number
Average Value
Number
Average Value
Number
Average Value
LOANS ORIGINATED
23
$194,041
587
$243,844
306
$304,128
38
$169,810
2
$9,986,000
97
$245,776
2
$310,565
APPLICATIONS APPROVED, NOT ACCEPTED
0
$0
88
$207,272
27
$252,392
7
$56,369
0
$0
16
$181,049
0
$0
APPLICATIONS DENIED
6
$138,805
101
$218,247
63
$342,309
8
$24,490
0
$0
13
$155,962
0
$0
APPLICATIONS WITHDRAWN
11
$127,452
108
$244,181
70
$372,821
5
$186,470
0
$0
10
$246,267
0
$0
FILES CLOSED FOR INCOMPLETENESS
0
$0
15
$357,323
18
$394,987
0
$0
0
$0
6
$261,778
0
$0
Aggregated Statistics For Year 2004 (Based on 2 full and 2 partial tracts)
A) FHA, FSA/RHS & VA Home Purchase Loans
B) Conventional Home Purchase Loans
C) Refinancings
D) Home Improvement Loans
F) Non-occupant Loans on < 5 Family Dwellings (A B C & D)
G) Loans On Manufactured Home Dwelling (A B C & D)
Number
Average Value
Number
Average Value
Number
Average Value
Number
Average Value
Number
Average Value
Number
Average Value
LOANS ORIGINATED
5
$227,030
523
$290,662
358
$313,975
21
$41,462
46
$230,944
0
$0
APPLICATIONS APPROVED, NOT ACCEPTED
2
$229,600
57
$212,485
44
$274,311
8
$44,682
6
$213,658
0
$0
APPLICATIONS DENIED
3
$150,933
65
$236,199
95
$314,173
8
$31,029
11
$259,837
2
$35,725
APPLICATIONS WITHDRAWN
1
$135,760
75
$268,731
51
$348,433
8
$49,170
8
$272,194
0
$0
FILES CLOSED FOR INCOMPLETENESS
0
$0
9
$313,686
11
$267,929
0
$0
0
$0
0
$0
Aggregated Statistics For Year 2003 (Based on 2 full and 2 partial tracts)
A) FHA, FSA/RHS & VA Home Purchase Loans
B) Conventional Home Purchase Loans
C) Refinancings
D) Home Improvement Loans
E) Loans on Dwellings For 5+ Families
F) Non-occupant Loans on < 5 Family Dwellings (A B C & D)
Number
Average Value
Number
Average Value
Number
Average Value
Number
Average Value
Number
Average Value
Number
Average Value
LOANS ORIGINATED
15
$195,097
564
$298,356
753
$268,293
13
$127,698
4
$5,482,315
45
$193,339
APPLICATIONS APPROVED, NOT ACCEPTED
1
$176,130
77
$256,024
54
$242,572
2
$17,975
0
$0
6
$210,328
APPLICATIONS DENIED
2
$216,305
51
$316,917
65
$276,545
12
$58,787
0
$0
8
$201,645
APPLICATIONS WITHDRAWN
0
$0
67
$257,166
74
$266,091
0
$0
0
$0
8
$249,791
FILES CLOSED FOR INCOMPLETENESS
0
$0
4
$257,728
7
$136,320
0
$0
0
$0
0
$0
Aggregated Statistics For Year 1999 (Based on 1 full tract)
A) FHA, FSA/RHS & VA Home Purchase Loans
B) Conventional Home Purchase Loans
C) Refinancings
D) Home Improvement Loans
F) Non-occupant Loans on < 5 Family Dwellings (A B C & D)
Detailed PMIC statistics for the following Tracts:0043.06
, 0044.05
2002 - 2018 National Fire Incident Reporting System (NFIRS) incidents
Based on the data from the years 2002 - 2018 the average number of fire incidents per year is 10. The highest number of fire incidents - 23 took place in 2014, and the least - 2 in 2002. The data has a rising trend.
When looking into fire subcategories, the most reports belonged to: Structure Fires (43.4%), and Outside Fires (39.2%).
Fire incident types reported to NFIRS in Zip Code 80230


 Nearest zip codes: 80247, 80220, 80010, 80224, 80246, 80231.


 Based on the data from the years 2002 - 2018 the average number of fire incidents per year is 10. The highest number of fire incidents - 23 took place in 2014, and the least - 2 in 2002. The data has a rising trend.
 When looking into fire subcategories, the most reports belonged to: Structure Fires (43.4%), and Outside Fires (39.2%).