Estimated zip code population in 2022: 1,308 Zip code population in 2010: 1,524 Zip code population in 2000: 974
Houses and condos: 644 Renter-occupied apartments: 87
% of renters here:
14%
State:
27%
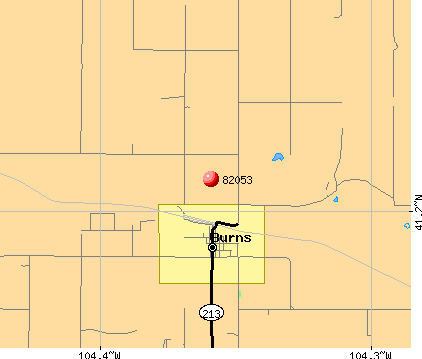
March 2022 cost of living index in zip code 82053: 85.1 (less than average, U.S. average is 100)
Land area: 226.5 sq. mi. Water area: 0.0 sq. mi.
Population density: 6 people per square mile
(very low).
OSM Map
General Map
Google Map
MSN Map
OSM Map
General Map
Google Map
MSN Map
OSM Map
General Map
Google Map
MSN Map
OSM Map
General Map
Google Map
MSN Map
Please wait while loading the map...
Real estate property taxes paid for housing units in 2022:
This zip code:
0.6% ($1,415)
Wyoming:
0.6% ($1,609)
Median real estate property taxes paid for housing units with mortgages in 2022: $1,344 (0.5%) Median real estate property taxes paid for housing units with no mortgage in 2022: $1,668 (0.7%)
Business Search- 14 Million verified businesses
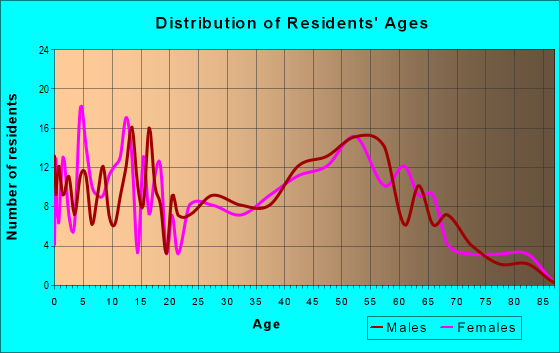
Males: 703
(53.8%)
Females: 605
(46.2%)
For population 25 years and over in 82053:
High school or higher: 89.9%
Bachelor's degree or higher: 12.6%
Graduate or professional degree: 5.7%
Unemployed: 4.1%
Mean travel time to work (commute): 43.0 minutes
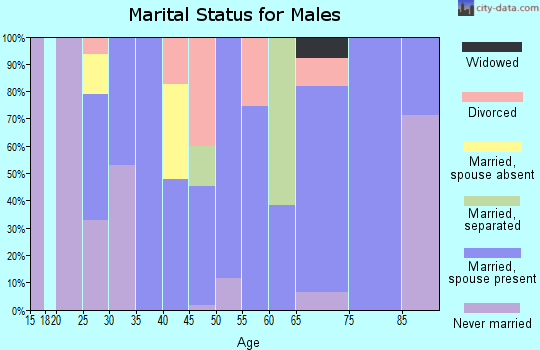
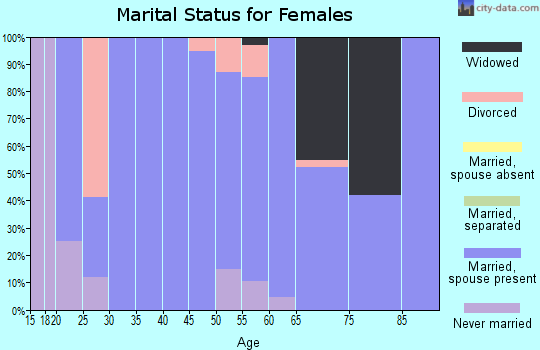
For population 15 years and over in 82053:
Never married: 25.0%
Now married: 51.5%
Separated: 0.0%
Widowed: 6.7%
Divorced: 16.8%
Zip code 82053 compared to state average:
Black race population percentage significantly below state average.
Median age significantly above state average.
Foreign-born population percentage above state average.
Renting percentage below state average.
Length of stay since moving in significantly above state average.
Percentage of population with a bachelor's degree or higher below state average.
Averages for the 2020 tax year for zip code 82053, filed in 2021:
Average Adjusted Gross Income (AGI) in 2020: $67,735 (Individual Income Tax Returns)
Here:
$67,735
State:
$93,756
Salary/wage: $57,264 (reported on 85.3% of returns)
Here:
$57,264
State:
$58,022
(% of AGI for various income ranges: 1522.5% for AGIs below $25k, 3970.0% for AGIs $25k-50k, 6892.5% for AGIs $50k-75k, 10098.3% for AGIs $75k-100k, 18315.0% for AGIs $100k-200k)
Taxable interest for individuals: $691 (reported on 33.8% of returns)
This zip code:
$691
Wyoming:
$3,185
(% of AGI for various income ranges: 33.3% for AGIs below $25k, 6.2% for AGIs $25k-50k, 28.7% for AGIs $50k-75k, 20.0% for AGIs $75k-100k, 95.0% for AGIs $100k-200k)
Ordinary dividends: $1,500 (reported on 13.2% of returns)
Here:
$1,500
State:
$18,054
(% of AGI for various income ranges: 28.3% for AGIs below $25k, 46.2% for AGIs $50k-75k, 80.0% for AGIs $100k-200k)
Net capital gain/loss in AGI: +$25,373 (reported on 16.2% of returns)
Here:
+$25,373
State:
+$61,860
(% of AGI for various income ranges: 59.2% for AGIs below $25k, 120.0% for AGIs $50k-75k, 3280.0% for AGIs $100k-200k)
Profit/loss from business: +$10,040 (reported on 14.7% of returns)
Here:
+$10,040
State:
+$12,816
(% of AGI for various income ranges: 156.7% for AGIs below $25k, 188.5% for AGIs $25k-50k, 218.8% for AGIs $50k-75k, 495.0% for AGIs $100k-200k)
Taxable individual retirement arrangement distribution: $12,220 (reported on 7.4% of returns)
82053:
$12,220
Wyoming:
$22,959
(% of AGI for various income ranges: 763.8% for AGIs $50k-75k)
Total itemized deductions: $23,700 (reported on 4.4% of returns)
Here:
$23,700
State:
$59,861
(% of AGI for various income ranges: 888.7% for AGIs $50k-75k)
Taxes paid: $3,533 (reported on 4.4% of returns)
82053:
$3,533
State:
$5,690
(% of AGI for various income ranges: 132.5% for AGIs $50k-75k)
Earned income credit: $2,300 (reported on 13.2% of returns)
Here:
$2,300
State:
$2,106
(% of AGI for various income ranges: 95.0% for AGIs below $25k, 71.5% for AGIs $25k-50k)
Percentage of individuals using paid preparers for their 2020 taxes: 95.6%
Here:
96%
State:
94%
(% for various income ranges: 88.9% for AGIs below $25k, 100.0% for AGIs $25k-50k, 91.7% for AGIs $50k-75k, 100.0% for AGIs $75k-100k, 116.7% for AGIs $100k-200k, 0.0% for AGIs over 200k)
Averages for the 2012 tax year for zip code 82053, filed in 2013:
Average Adjusted Gross Income (AGI) in 2012: $47,954 (Individual Income Tax Returns)
Here:
$47,954
State:
$69,135
Salary/wage: $41,191 (reported on 84.1% of returns)
Here:
$41,191
State:
$48,877
(% of AGI for various income ranges: 79.0% for AGIs below $25k, 76.2% for AGIs $25k-50k, 81.4% for AGIs $50k-75k, 86.4% for AGIs $75k-100k, 56.4% for AGIs $100k-200k)
Taxable interest for individuals: $988 (reported on 31.7% of returns)
This zip code:
$988
Wyoming:
$3,063
(% of AGI for various income ranges: 0.2% for AGIs below $25k, 0.7% for AGIs $25k-50k, 0.7% for AGIs $50k-75k, 0.2% for AGIs $75k-100k, 1.0% for AGIs $100k-200k)
Ordinary dividends: $4,660 (reported on 12.2% of returns)
Here:
$4,660
State:
$14,293
(% of AGI for various income ranges: 4.1% for AGIs below $25k, 3.1% for AGIs $25k-50k, 1.1% for AGIs $50k-75k)
Net capital gain/loss in AGI: +$2,857 (reported on 8.5% of returns)
Here:
+$2,857
State:
+$37,851
(% of AGI for various income ranges: 0.9% for AGIs below $25k, 1.2% for AGIs $50k-75k, 0.9% for AGIs $75k-100k)
Profit/loss from business: +$6,080 (reported on 12.2% of returns)
Here:
+$6,080
State:
+$13,804
(% of AGI for various income ranges: 4.2% for AGIs below $25k, 3.7% for AGIs $25k-50k, 2.5% for AGIs $75k-100k)
Taxable individual retirement arrangement distribution: $2,733 (reported on 3.7% of returns)
82053:
$2,733
Wyoming:
$18,551
Total itemized deductions: $17,880 (20% of AGI, reported on 24.4% of returns)
Here:
$17,880
State:
$25,377
Here:
19.8% of AGI
State:
15.6% of AGI
(% of AGI for various income ranges: 16.0% for AGIs $25k-50k, 13.4% for AGIs $50k-75k, 9.2% for AGIs $75k-100k, 7.4% for AGIs $100k-200k)
Charity contributions: $2,908 (reported on 14.6% of returns)
Here:
$2,908
State:
$7,424
(% of AGI for various income ranges: 1.2% for AGIs below $25k, 0.5% for AGIs $50k-75k, 1.2% for AGIs $75k-100k, 1.2% for AGIs $100k-200k)
Taxes paid: $3,089 (reported on 22.0% of returns)
82053:
$3,089
State:
$4,979
(% of AGI for various income ranges: 1.5% for AGIs $25k-50k, 2.0% for AGIs $50k-75k, 1.8% for AGIs $75k-100k, 1.4% for AGIs $100k-200k)
Earned income credit: $1,311 (reported on 23.2% of returns)
Here:
$1,311
State:
$1,989
(% of AGI for various income ranges: 3.5% for AGIs below $25k, 1.3% for AGIs $25k-50k)
Percentage of individuals using paid preparers for their 2012 taxes: 41.5%
Here:
41%
State:
50%
(% for various income ranges: 25.6% for AGIs below $25k, 46.7% for AGIs $25k-50k, 54.5% for AGIs $50k-75k, 66.7% for AGIs $75k-100k, 62.5% for AGIs $100k-200k)
Averages for the 2004 tax year for zip code 82053, filed in 2005:
Average Adjusted Gross Income (AGI) in 2004: $38,565 (Individual Income Tax Returns)
Here:
$38,565
State:
$50,131
Salary/wage: $36,768 (reported on 83.7% of returns)
Here:
$36,768
State:
$37,659
(% of AGI for various income ranges: 113.7% for AGIs below $10k, 69.2% for AGIs $10k-25k, 80.4% for AGIs $25k-50k, 80.6% for AGIs $50k-75k, 93.3% for AGIs $75k-100k, 63.2% for AGIs over 100k)
Taxable interest for individuals: $786 (reported on 41.3% of returns)
This zip code:
$786
Wyoming:
$2,408
(% of AGI for various income ranges: 3.0% for AGIs below $10k, 1.4% for AGIs $10k-25k, 1.8% for AGIs $25k-50k, 0.4% for AGIs $50k-75k, 0.1% for AGIs $75k-100k, 0.2% for AGIs over 100k)
Taxable dividends: $607 (reported on 15.7% of returns)
Here:
$607
State:
$6,819
(% of AGI for various income ranges: 0.8% for AGIs below $10k, 0.3% for AGIs $10k-25k, 0.6% for AGIs $25k-50k, 0.0% for AGIs $50k-75k, 0.0% for AGIs $75k-100k)
Net capital gain/loss: +$2,557 (reported on 15.5% of returns)
Here:
+$2,557
State:
+$23,705
(% of AGI for various income ranges: 1.1% for AGIs below $10k, -0.1% for AGIs $10k-25k, 1.5% for AGIs $25k-50k, 1.6% for AGIs $50k-75k, 0.9% for AGIs $75k-100k)
Profit/loss from business: +$1,398 (reported on 15.5% of returns)
Here:
+$1,398
State:
+$10,523
(% of AGI for various income ranges: -6.6% for AGIs below $10k, 6.7% for AGIs $10k-25k, -1.0% for AGIs $25k-50k, 1.2% for AGIs $50k-75k, -0.1% for AGIs $75k-100k)
Total itemized deductions: $16,250 (24% of AGI, reported on 26.9% of returns)
Here:
$16,250
State:
$18,912
Here:
24.1% of AGI
State:
17.8% of AGI
(% of AGI for various income ranges: 9.7% for AGIs $10k-25k, 12.7% for AGIs $25k-50k, 9.1% for AGIs $50k-75k, 14.4% for AGIs $75k-100k, 11.2% for AGIs over 100k)
Charity contributions deductions: $2,255 (3% of AGI, reported on 19.4% of returns)
Here:
$2,255
State:
$5,489
Here:
3.4% of AGI
State:
4.7% of AGI
(% of AGI for various income ranges: 1.5% for AGIs $25k-50k, 1.0% for AGIs $50k-75k, 1.7% for AGIs $75k-100k, 0.8% for AGIs over 100k)
Total tax: $3,949 (reported on 76.3% of returns)
82053:
$3,949
State:
$8,551
(% of AGI for various income ranges: 5.5% for AGIs below $10k, 4.2% for AGIs $10k-25k, 6.1% for AGIs $25k-50k, 7.5% for AGIs $50k-75k, 10.0% for AGIs $75k-100k, 11.8% for AGIs over 100k)
Earned income credit: $1,671 (reported on 13.4% of returns)
Here:
$1,671
State:
$1,544
Percentage of individuals using paid preparers for their 2004 taxes: 54.6%
Here:
55%
State:
59%
(% for various income ranges: 47.7% for AGIs below $10k, 60.0% for AGIs $10k-25k, 55.7% for AGIs $25k-50k, 54.6% for AGIs $50k-75k, 52.1% for AGIs $75k-100k, 55.0% for AGIs over 100k)
Household received Food Stamps/SNAP in the past 12 months: 80 Household did not receive Food Stamps/SNAP in the past 12 months: 532
Women who had a birth in the past 12 months: 9 (9 now married, 0 unmarried) Women who did not have a birth in the past 12 months: 215 (74 now married, 141 unmarried)
Housing units in zip code 82053 with a mortgage: 306 (19 second mortgage) Median monthly owner costs for units with a mortgage: $1,493 Median monthly owner costs for units without a mortgage: $388
Residents with income below the poverty level in 2022:
This zip code:
12.3%
Whole state:
11.8%
Residents with income below 50% of the poverty level in 2022:
This zip code:
4.1%
Whole state:
6.8%
Median number of rooms in houses and condos:
Here:
6.7
State:
6.7
Median number of rooms in apartments:
Here:
5.4
State:
4.4
Notable locations in this zip code not listed on our city pages
Notable locations in zip code 82053: Laramie County Fire District 6 Station 1 Burns (A), Burns Emergency Medical Services (B). Display/hide their locations on the map
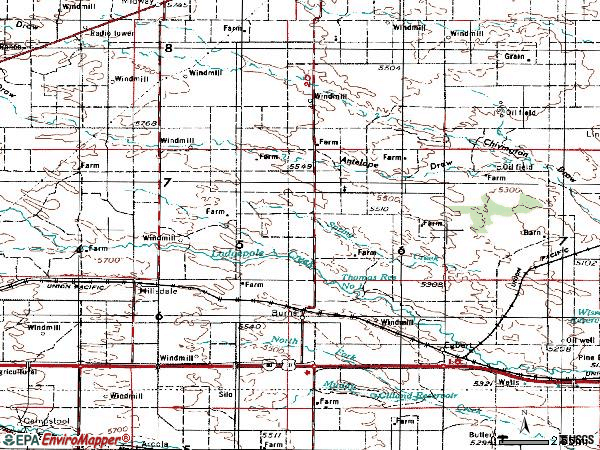
Reservoirs: Thomas Number 2 Reservoir (A), C W Reservoir (B), Bastian Reservoir Number 1 (C), Thomas Reservoir Number 1 (D), Thomas Reservoir Number 2 (E). Display/hide their locations on the map
Size of family households: 298 2-persons, 90 3-persons, 29 4-persons, 8 6-persons, 15 7-or-more-persons
Size of nonfamily households: 156 1-person, 6 2-persons
118 married couples with children.
58 single-parent households (12 men, 46 women).
94.1% of residents of 82053 zip code speak English at home.
5.3% of residents speak Spanish at home (100% well).
1.0% of residents speak Asian or Pacific Island language at home (100% very well).
Foreign born population: 77 (6.0%) (23.7% of them are naturalized citizens)
This zip code:
6.0%
Whole state:
3.1%
67%Honduras
16%Scotland
13%Syria
18%English
11%German
9%Irish
6%European
5%Polish
4%Scandinavian
3%Scotch-Irish
Year of entry for the foreign-born population
122010 or later
02000 to 2009
351990 to 1999
56Before 1990
Facilities with environmental interests located in this zip code:
BURNS JR/SR HIGH SCHOOL (305 E COUNTY ROAD 213 in BURNS, WY)
(National Center for Education Statistics) - STATE ID-1102056 Organizations: LARAMIE #2 (SCHOOL DISTRICT)
BURNS FARMERS CO-OP SUP ASSN (I-80 AT BURNS EXIT in BURNS, WY)
(Integrated Compliance Information System) - ICIS-08-1995-0134, FORMAL ENFORCEMENT ACTION Business SIC classification: EATING PLACES; DRINKING PLACES (ALCOHOLIC BEVERAGES)
CENEX RESTAURANT & LOUNGE (4850 I-80 SERVICE RD in BURNS, WY)
(Integrated Compliance Information System) - ICIS-08-1999-0261, FORMAL ENFORCEMENT ACTION Business SIC classification: EATING PLACES; DRINKING PLACES (ALCOHOLIC BEVERAGES)
BURNS WASTEWATER LAGOONS (T14N R62W in BURNS, WY)
National Pollutant Discharge Elimination System NON-MAJOR (Tracking pollutant discharge elimination systems) - permit Business SIC classification: SEWERAGE SYSTEMS Alternative names: BURNS, TOWN OF
Housing units lacking complete kitchen facilities: 0.5%
51.4%Bottled, tank, or LP gas
29.6%Utility gas
11.0%Wood
5.5%Electricity
2.9%Other fuel
Population in 1990: 1,303.
Place of birth for U.S.-born residents:
This state: 601
Northeast: 11
Midwest: 250
South: 201
West: 147
46% of the 82053 zip code residents lived in the same house 5 years ago. Out of people who lived in different houses, 52% lived in this county. Out of people who lived in different counties, 50% lived in Wyoming.
89% of the 82053 zip code residents lived in the same house 1 year ago. Out of people who lived in different houses, 37% moved from this county. Out of people who lived in different houses, 60% moved from different state.
Private vs. public school enrollment:
Students in private schools in grades 1 to 8 (elementary and middle school):
Here:
0.0%
Wyoming:
7.3%
Students in private schools in grades 9 to 12 (high school): 18
Here:
52.5%
Wyoming:
6.0%
Students in private undergraduate colleges: 13
Here:
34.9%
Wyoming:
9.2%
Occupation by median earnings in the past 12 months ($)
82,916Education, training, and library occupations
82,383Transportation occupations
68,101Production occupations
57,388Business and financial operations occupations
44,659Office and administrative support occupations
36,159Sales and related occupations
Top industries in this zip code by the number of employees in 2005:
Finance and Insurance: Insurance Agencies and Brokerages (10-19 employees: 1 establishment)
Construction: Painting and Wall Covering Contractors (5-9: 1)
Real Estate and Rental and Leasing: Commercial Air, Rail, and Water Transportation Equipment Rental and Leasing (5-9: 1)
Administrative and Support and Waste Management and Remediation Services: Solid Waste Collection (5-9: 1)
Construction: Plumbing, Heating, and Air-Conditioning Contractors (5-9: 1)
Finance and Insurance: Commercial Banking (5-9: 1)
Construction: Water and Sewer Line and Related Structures Construction (1-4: 1)
Fatal accident statistics in 2014:
Fatal accident count: 1
Vehicles involved in fatal accidents: 1
Fatal accidents caused by drunken drivers: 0
Fatalities: 1
Persons involved in fatal accidents: 5
Pedestrians involved in fatal accidents: 0
Fatal accident statistics in 2010:
Fatal accident count: 2
Vehicles involved in fatal accidents: 3
Fatal accidents caused by drunken drivers: 1
Fatalities: 2
Persons involved in fatal accidents: 4
Pedestrians involved in fatal accidents: 1
Home Mortgage Disclosure Act Aggregated Statistics For Year 2009 (Based on 2 partial tracts)
A) FHA, FSA/RHS & VA Home Purchase Loans
B) Conventional Home Purchase Loans
C) Refinancings
D) Home Improvement Loans
F) Non-occupant Loans on < 5 Family Dwellings (A B C & D)
G) Loans On Manufactured Home Dwelling (A B C & D)
Number
Average Value
Number
Average Value
Number
Average Value
Number
Average Value
Number
Average Value
Number
Average Value
LOANS ORIGINATED
20
$192,316
10
$169,405
80
$177,843
6
$52,855
3
$207,320
10
$135,770
APPLICATIONS APPROVED, NOT ACCEPTED
0
$0
1
$55,350
7
$160,020
0
$0
0
$0
1
$189,890
APPLICATIONS DENIED
4
$118,972
1
$131,850
31
$181,623
2
$59,775
1
$71,110
6
$139,153
APPLICATIONS WITHDRAWN
3
$173,107
2
$132,040
19
$180,627
2
$163,945
0
$0
2
$128,580
FILES CLOSED FOR INCOMPLETENESS
0
$0
0
$0
4
$132,425
0
$0
0
$0
1
$146,840
Aggregated Statistics For Year 2008 (Based on 2 partial tracts)
A) FHA, FSA/RHS & VA Home Purchase Loans
B) Conventional Home Purchase Loans
C) Refinancings
D) Home Improvement Loans
F) Non-occupant Loans on < 5 Family Dwellings (A B C & D)
G) Loans On Manufactured Home Dwelling (A B C & D)
Number
Average Value
Number
Average Value
Number
Average Value
Number
Average Value
Number
Average Value
Number
Average Value
LOANS ORIGINATED
12
$189,509
18
$166,467
55
$176,335
8
$59,005
4
$354,418
12
$134,732
APPLICATIONS APPROVED, NOT ACCEPTED
1
$122,620
1
$84,570
5
$154,606
1
$48,820
0
$0
1
$94,180
APPLICATIONS DENIED
2
$201,040
3
$165,420
39
$162,325
10
$82,146
1
$57,280
8
$167,839
APPLICATIONS WITHDRAWN
2
$143,765
3
$171,443
13
$159,289
4
$143,765
2
$137,615
2
$107,630
FILES CLOSED FOR INCOMPLETENESS
0
$0
0
$0
2
$162,215
0
$0
0
$0
0
$0
Aggregated Statistics For Year 2007 (Based on 2 partial tracts)
A) FHA, FSA/RHS & VA Home Purchase Loans
B) Conventional Home Purchase Loans
C) Refinancings
D) Home Improvement Loans
F) Non-occupant Loans on < 5 Family Dwellings (A B C & D)
G) Loans On Manufactured Home Dwelling (A B C & D)
Number
Average Value
Number
Average Value
Number
Average Value
Number
Average Value
Number
Average Value
Number
Average Value
LOANS ORIGINATED
12
$166,573
33
$159,736
53
$146,993
13
$49,676
3
$191,303
13
$125,698
APPLICATIONS APPROVED, NOT ACCEPTED
1
$110,710
2
$248,705
8
$133,291
1
$186,430
0
$0
2
$117,820
APPLICATIONS DENIED
2
$153,185
6
$105,325
42
$151,893
12
$107,664
2
$92,255
7
$100,713
APPLICATIONS WITHDRAWN
2
$115,130
2
$121,470
19
$147,671
2
$88,410
0
$0
2
$74,575
FILES CLOSED FOR INCOMPLETENESS
0
$0
1
$22,680
5
$189,048
0
$0
0
$0
0
$0
Aggregated Statistics For Year 2006 (Based on 2 partial tracts)
A) FHA, FSA/RHS & VA Home Purchase Loans
B) Conventional Home Purchase Loans
C) Refinancings
D) Home Improvement Loans
F) Non-occupant Loans on < 5 Family Dwellings (A B C & D)
G) Loans On Manufactured Home Dwelling (A B C & D)
Number
Average Value
Number
Average Value
Number
Average Value
Number
Average Value
Number
Average Value
Number
Average Value
LOANS ORIGINATED
15
$178,515
38
$130,423
72
$133,643
11
$51,685
5
$118,472
16
$125,723
APPLICATIONS APPROVED, NOT ACCEPTED
0
$0
4
$97,542
12
$122,592
1
$70,730
0
$0
2
$101,865
APPLICATIONS DENIED
1
$111,860
11
$122,694
52
$142,368
9
$66,288
2
$154,530
10
$89,681
APPLICATIONS WITHDRAWN
1
$216,800
7
$116,089
22
$146,142
3
$78,803
2
$79,570
3
$100,583
FILES CLOSED FOR INCOMPLETENESS
0
$0
1
$85,720
7
$151,509
0
$0
0
$0
0
$0
Aggregated Statistics For Year 2005 (Based on 2 partial tracts)
A) FHA, FSA/RHS & VA Home Purchase Loans
B) Conventional Home Purchase Loans
C) Refinancings
D) Home Improvement Loans
F) Non-occupant Loans on < 5 Family Dwellings (A B C & D)
G) Loans On Manufactured Home Dwelling (A B C & D)
Number
Average Value
Number
Average Value
Number
Average Value
Number
Average Value
Number
Average Value
Number
Average Value
LOANS ORIGINATED
13
$153,701
55
$137,678
67
$142,865
5
$54,432
5
$126,928
13
$112,334
APPLICATIONS APPROVED, NOT ACCEPTED
1
$226,030
5
$122,778
10
$133,771
1
$46,130
1
$179,130
2
$71,500
APPLICATIONS DENIED
1
$141,840
13
$104,379
63
$130,525
8
$54,152
2
$96,290
8
$95,571
APPLICATIONS WITHDRAWN
1
$152,990
5
$103,172
36
$140,242
2
$115,705
0
$0
2
$172,405
FILES CLOSED FOR INCOMPLETENESS
0
$0
1
$143,770
7
$130,970
0
$0
0
$0
0
$0
Aggregated Statistics For Year 2004 (Based on 2 partial tracts)
A) FHA, FSA/RHS & VA Home Purchase Loans
B) Conventional Home Purchase Loans
C) Refinancings
D) Home Improvement Loans
F) Non-occupant Loans on < 5 Family Dwellings (A B C & D)
G) Loans On Manufactured Home Dwelling (A B C & D)
Number
Average Value
Number
Average Value
Number
Average Value
Number
Average Value
Number
Average Value
Number
Average Value
LOANS ORIGINATED
10
$152,991
48
$119,212
68
$125,077
8
$38,104
3
$84,823
15
$93,947
APPLICATIONS APPROVED, NOT ACCEPTED
0
$0
5
$119,932
10
$115,551
2
$29,600
0
$0
4
$108,400
APPLICATIONS DENIED
2
$153,950
15
$95,049
51
$132,467
7
$47,776
2
$75,340
13
$106,302
APPLICATIONS WITHDRAWN
1
$167,600
5
$123,930
38
$123,777
2
$38,825
1
$68,420
5
$89,334
FILES CLOSED FOR INCOMPLETENESS
0
$0
0
$0
7
$159,966
2
$28,445
0
$0
0
$0
Aggregated Statistics For Year 2003 (Based on 2 partial tracts)
A) FHA, FSA/RHS & VA Home Purchase Loans
B) Conventional Home Purchase Loans
C) Refinancings
D) Home Improvement Loans
E) Loans on Dwellings For 5+ Families
F) Non-occupant Loans on < 5 Family Dwellings (A B C & D)
Number
Average Value
Number
Average Value
Number
Average Value
Number
Average Value
Number
Average Value
Number
Average Value
LOANS ORIGINATED
6
$142,612
31
$123,913
106
$120,977
3
$54,970
1
$140,310
2
$80,725
APPLICATIONS APPROVED, NOT ACCEPTED
0
$0
4
$138,095
19
$120,014
1
$80,720
0
$0
2
$135,115
APPLICATIONS DENIED
1
$101,870
7
$90,060
45
$107,239
3
$14,350
0
$0
2
$25,945
APPLICATIONS WITHDRAWN
0
$0
3
$134,413
36
$115,971
1
$51,130
0
$0
1
$127,620
FILES CLOSED FOR INCOMPLETENESS
0
$0
0
$0
5
$112,244
0
$0
0
$0
0
$0
Aggregated Statistics For Year 1999 (Based on 1 partial tract)
A) FHA, FSA/RHS & VA Home Purchase Loans
B) Conventional Home Purchase Loans
C) Refinancings
D) Home Improvement Loans
F) Non-occupant Loans on < 5 Family Dwellings (A B C & D)
Detailed PMIC statistics for the following Tracts:0020.00
2002 - 2018 National Fire Incident Reporting System (NFIRS) incidents
According to the data from the years 2002 - 2018 the average number of fire incidents per year is 13. The highest number of fire incidents - 26 took place in 2006, and the least - 0 in 2013. The data has a decreasing trend.
When looking into fire subcategories, the most reports belonged to: Outside Fires (53.5%), and Structure Fires (23.0%).
Fire incident types reported to NFIRS in Zip Code 82053


 Nearest zip codes: 82060, 82054, 82050, 82082, 82081, 82007.


 According to the data from the years 2002 - 2018 the average number of fire incidents per year is 13. The highest number of fire incidents - 26 took place in 2006, and the least - 0 in 2013. The data has a decreasing trend.
 When looking into fire subcategories, the most reports belonged to: Outside Fires (53.5%), and Structure Fires (23.0%).