Estimated zip code population in 2022: 2,329 Zip code population in 2010: 2,078 Zip code population in 2000: 1,252
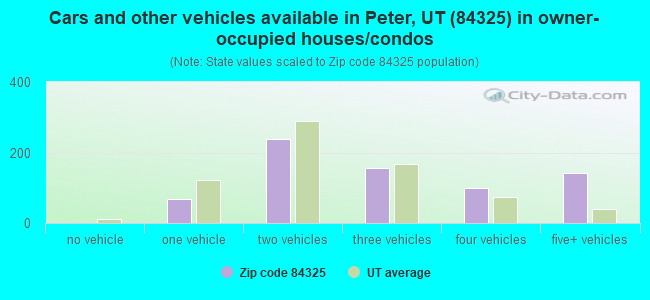
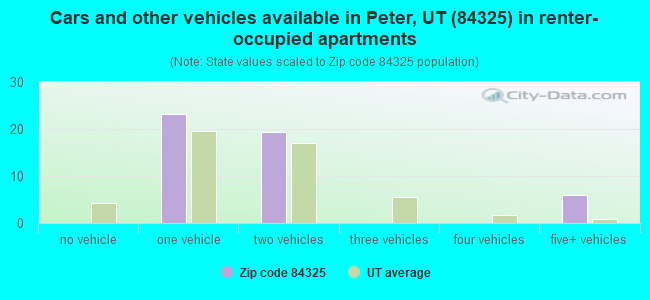
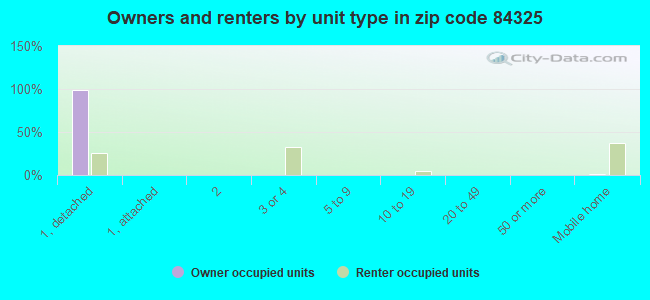
Houses and condos: 768 Renter-occupied apartments: 48
% of renters here:
6%
State:
29%
March 2022 cost of living index in zip code 84325: 83.7 (less than average, U.S. average is 100)
Land area: 36.9 sq. mi. Water area: 0.7 sq. mi.
Population density: 63 people per square mile
(very low).
OSM Map
General Map
Google Map
MSN Map
OSM Map
General Map
Google Map
MSN Map
OSM Map
General Map
Google Map
MSN Map
OSM Map
General Map
Google Map
MSN Map
Please wait while loading the map...
Real estate property taxes paid for housing units in 2022:
This zip code:
0.5% ($2,508)
Utah:
0.5% ($2,376)
Median real estate property taxes paid for housing units with mortgages in 2022: $2,636 (0.5%) Median real estate property taxes paid for housing units with no mortgage in 2022: $2,237 (0.4%)
Estimated median house/condo value in 2022: $542,419
84325:
$542,419
Utah:
$499,500
According to our research of Utah and other state lists, there were 7 registered sex offenders living in 84325 zip code as of April 25, 2024. The ratio of all residents to sex offenders in zip code 84325 is 316 to 1. The ratio of registered sex offenders to all residents in this zip code is near the state average.
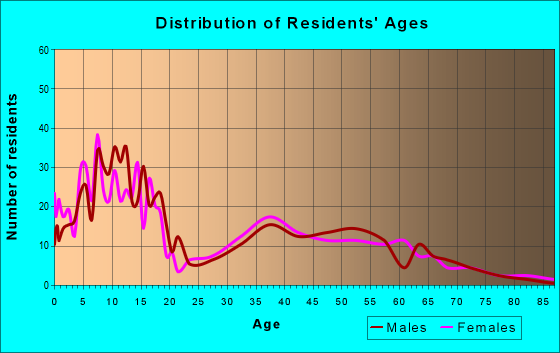
Median resident age:
This zip code:
37.4 years
Utah median age:
32.1 years
Average household size:
This zip code:
3.1 people
Utah:
3.0 people
Averages for the 2020 tax year for zip code 84325, filed in 2021:
Average Adjusted Gross Income (AGI) in 2020: $96,119 (Individual Income Tax Returns)
Here:
$96,119
State:
$81,660
Salary/wage: $66,695 (reported on 84.5% of returns)
Here:
$66,695
State:
$63,027
(% of AGI for various income ranges: 1297.0% for AGIs below $25k, 3657.7% for AGIs $25k-50k, 5060.9% for AGIs $50k-75k, 9881.2% for AGIs $75k-100k, 19290.0% for AGIs $100k-200k, 60635.0% for AGIs over 200k)
Taxable interest for individuals: $1,749 (reported on 39.8% of returns)
This zip code:
$1,749
Utah:
$2,255
(% of AGI for various income ranges: 9.5% for AGIs below $25k, 23.1% for AGIs $25k-50k, 122.7% for AGIs $50k-75k, 78.8% for AGIs $75k-100k, 63.8% for AGIs $100k-200k, 1935.0% for AGIs over 200k)
Ordinary dividends: $5,545 (reported on 19.4% of returns)
Here:
$5,545
State:
$7,362
(% of AGI for various income ranges: 6.0% for AGIs below $25k, 29.2% for AGIs $25k-50k, 38.2% for AGIs $50k-75k, 22.5% for AGIs $75k-100k, 264.6% for AGIs $100k-200k, 3275.0% for AGIs over 200k)
Net capital gain/loss in AGI: +$32,074 (reported on 22.3% of returns)
Here:
+$32,074
State:
+$43,433
(% of AGI for various income ranges: 15.5% for AGIs below $25k, 200.9% for AGIs $50k-75k, 130.0% for AGIs $75k-100k, 759.2% for AGIs $100k-200k, 30270.0% for AGIs over 200k)
Profit/loss from business: +$3,906 (reported on 17.5% of returns)
Here:
+$3,906
State:
+$9,957
(% of AGI for various income ranges: 90.5% for AGIs below $25k, 23.8% for AGIs $25k-50k, 124.5% for AGIs $50k-75k, 243.8% for AGIs $75k-100k, 122.3% for AGIs $100k-200k)
Taxable individual retirement arrangement distribution: $20,411 (reported on 8.7% of returns)
84325:
$20,411
Utah:
$21,167
(% of AGI for various income ranges: 182.0% for AGIs below $25k, 328.2% for AGIs $50k-75k, 855.4% for AGIs $100k-200k)
Total itemized deductions: $36,659 (reported on 21.4% of returns)
Here:
$36,659
State:
$41,056
(% of AGI for various income ranges: 1002.7% for AGIs $50k-75k, 943.8% for AGIs $75k-100k, 2964.6% for AGIs $100k-200k, 11765.0% for AGIs over 200k)
Charity contributions: $19,660 (reported on 19.4% of returns)
Here:
$19,660
State:
$22,261
(% of AGI for various income ranges: 307.3% for AGIs $50k-75k, 372.5% for AGIs $75k-100k, 1360.8% for AGIs $100k-200k, 7635.0% for AGIs over 200k)
Taxes paid: $8,041 (reported on 21.4% of returns)
84325:
$8,041
State:
$7,985
(% of AGI for various income ranges: 158.2% for AGIs $50k-75k, 207.5% for AGIs $75k-100k, 743.8% for AGIs $100k-200k, 2310.0% for AGIs over 200k)
Earned income credit: $2,267 (reported on 8.7% of returns)
Here:
$2,267
State:
$2,169
(% of AGI for various income ranges: 55.0% for AGIs below $25k, 72.3% for AGIs $25k-50k)
Percentage of individuals using paid preparers for their 2020 taxes: 97.1%
Here:
97%
State:
94%
(% for various income ranges: 92.9% for AGIs below $25k, 100.0% for AGIs $25k-50k, 100.0% for AGIs $50k-75k, 100.0% for AGIs $75k-100k, 95.8% for AGIs $100k-200k, 100.0% for AGIs over 200k)
Averages for the 2012 tax year for zip code 84325, filed in 2013:
Average Adjusted Gross Income (AGI) in 2012: $66,756 (Individual Income Tax Returns)
Here:
$66,756
State:
$60,327
Salary/wage: $49,624 (reported on 87.0% of returns)
Here:
$49,624
State:
$48,762
(% of AGI for various income ranges: 83.0% for AGIs below $25k, 75.2% for AGIs $25k-50k, 71.8% for AGIs $50k-75k, 83.0% for AGIs $75k-100k, 75.1% for AGIs $100k-200k, 27.5% for AGIs over 200k)
Taxable interest for individuals: $756 (reported on 46.8% of returns)
This zip code:
$756
Utah:
$1,534
(% of AGI for various income ranges: 1.4% for AGIs below $25k, 0.9% for AGIs $25k-50k, 0.2% for AGIs $50k-75k, 0.3% for AGIs $75k-100k, 0.6% for AGIs $100k-200k, 0.5% for AGIs over 200k)
Ordinary dividends: $4,754 (reported on 16.9% of returns)
Here:
$4,754
State:
$5,711
(% of AGI for various income ranges: 0.5% for AGIs below $25k, 2.1% for AGIs $25k-50k, 0.8% for AGIs $50k-75k, 3.2% for AGIs $100k-200k)
Net capital gain/loss in AGI: +$3,707 (reported on 18.2% of returns)
Here:
+$3,707
State:
+$23,734
(% of AGI for various income ranges: 0.2% for AGIs $50k-75k, 0.4% for AGIs $75k-100k, 3.5% for AGIs $100k-200k)
Profit/loss from business: +$2,320 (reported on 19.5% of returns)
Here:
+$2,320
State:
+$8,845
(% of AGI for various income ranges: 2.9% for AGIs below $25k, 3.5% for AGIs $25k-50k, 1.8% for AGIs $100k-200k)
Taxable individual retirement arrangement distribution: $14,386 (reported on 9.1% of returns)
84325:
$14,386
Utah:
$15,565
(% of AGI for various income ranges: 6.5% for AGIs $25k-50k, 4.2% for AGIs $50k-75k, 4.1% for AGIs $75k-100k)
Total itemized deductions: $25,765 (23% of AGI, reported on 48.1% of returns)
Here:
$25,765
State:
$25,197
Here:
23.3% of AGI
State:
22.4% of AGI
(% of AGI for various income ranges: 21.6% for AGIs $25k-50k, 23.2% for AGIs $50k-75k, 21.7% for AGIs $75k-100k, 21.1% for AGIs $100k-200k, 14.0% for AGIs over 200k)
Charity contributions: $10,166 (reported on 45.5% of returns)
Here:
$10,166
State:
$8,502
(% of AGI for various income ranges: 5.5% for AGIs $25k-50k, 8.0% for AGIs $50k-75k, 7.8% for AGIs $75k-100k, 8.2% for AGIs $100k-200k, 6.4% for AGIs over 200k)
Taxes paid: $6,486 (reported on 48.1% of returns)
84325:
$6,486
State:
$7,001
(% of AGI for various income ranges: 3.3% for AGIs $25k-50k, 5.0% for AGIs $50k-75k, 5.1% for AGIs $75k-100k, 5.4% for AGIs $100k-200k, 4.9% for AGIs over 200k)
Earned income credit: $2,633 (reported on 11.7% of returns)
Here:
$2,633
State:
$2,259
(% of AGI for various income ranges: 4.6% for AGIs below $25k, 2.1% for AGIs $25k-50k)
Percentage of individuals using paid preparers for their 2012 taxes: 57.1%
Here:
57%
State:
51%
(% for various income ranges: 48.1% for AGIs below $25k, 61.5% for AGIs $25k-50k, 66.7% for AGIs $50k-75k, 54.5% for AGIs $75k-100k, 54.5% for AGIs $100k-200k, 100.0% for AGIs over 200k)
Averages for the 2004 tax year for zip code 84325, filed in 2005:
Average Adjusted Gross Income (AGI) in 2004: $51,038 (Individual Income Tax Returns)
Here:
$51,038
State:
$45,498
Salary/wage: $43,290 (reported on 88.1% of returns)
Here:
$43,290
State:
$38,975
(% of AGI for various income ranges: 183.8% for AGIs below $10k, 81.2% for AGIs $10k-25k, 78.5% for AGIs $25k-50k, 84.1% for AGIs $50k-75k, 82.8% for AGIs $75k-100k, 57.5% for AGIs over 100k)
Taxable interest for individuals: $1,040 (reported on 56.5% of returns)
This zip code:
$1,040
Utah:
$1,445
(% of AGI for various income ranges: 3.0% for AGIs below $10k, 0.8% for AGIs $10k-25k, 0.4% for AGIs $25k-50k, 1.2% for AGIs $50k-75k, 0.7% for AGIs $75k-100k, 1.7% for AGIs over 100k)
Taxable dividends: $1,438 (reported on 22.0% of returns)
Here:
$1,438
State:
$3,152
(% of AGI for various income ranges: 1.8% for AGIs below $10k, 0.7% for AGIs $10k-25k, 0.5% for AGIs $25k-50k, 0.2% for AGIs $50k-75k, 0.1% for AGIs $75k-100k, 1.2% for AGIs over 100k)
Net capital gain/loss: +$2,385 (reported on 24.2% of returns)
Here:
+$2,385
State:
+$14,059
(% of AGI for various income ranges: 0.8% for AGIs below $10k, 0.5% for AGIs $10k-25k, 0.9% for AGIs $25k-50k, -0.2% for AGIs $50k-75k, 2.4% for AGIs $75k-100k, 1.8% for AGIs over 100k)
Profit/loss from business: +$2,295 (reported on 19.8% of returns)
Here:
+$2,295
State:
+$6,903
(% of AGI for various income ranges: -1.4% for AGIs $10k-25k, 3.2% for AGIs $25k-50k, 0.9% for AGIs $50k-75k, 1.0% for AGIs $75k-100k, 0.1% for AGIs over 100k)
IRA payment deduction: $3,529 (reported on 2.6% of returns)
84325:
$3,529
Utah:
$2,970
Total itemized deductions: $19,728 (25% of AGI, reported on 50.4% of returns)
Here:
$19,728
State:
$20,312
Here:
25.1% of AGI
State:
24.9% of AGI
(% of AGI for various income ranges: 13.1% for AGIs $10k-25k, 24.0% for AGIs $25k-50k, 22.1% for AGIs $50k-75k, 21.4% for AGIs $75k-100k, 16.2% for AGIs over 100k)
Charity contributions deductions: $7,448 (9% of AGI, reported on 48.7% of returns)
Here:
$7,448
State:
$6,250
Here:
9.4% of AGI
State:
7.4% of AGI
(% of AGI for various income ranges: 3.3% for AGIs $10k-25k, 7.1% for AGIs $25k-50k, 7.7% for AGIs $50k-75k, 7.3% for AGIs $75k-100k, 7.4% for AGIs over 100k)
Total tax: $6,495 (reported on 73.5% of returns)
84325:
$6,495
State:
$6,523
(% of AGI for various income ranges: 4.5% for AGIs below $10k, 3.6% for AGIs $10k-25k, 3.9% for AGIs $25k-50k, 5.4% for AGIs $50k-75k, 7.0% for AGIs $75k-100k, 17.1% for AGIs over 100k)
Earned income credit: $1,354 (reported on 9.8% of returns)
Here:
$1,354
State:
$1,703
Percentage of individuals using paid preparers for their 2004 taxes: 55.2%
Here:
55%
State:
53%
(% for various income ranges: 41.6% for AGIs below $10k, 56.1% for AGIs $10k-25k, 64.3% for AGIs $25k-50k, 55.8% for AGIs $50k-75k, 47.7% for AGIs $75k-100k, 63.6% for AGIs over 100k)
Household received Food Stamps/SNAP in the past 12 months: 11 Household did not receive Food Stamps/SNAP in the past 12 months: 735
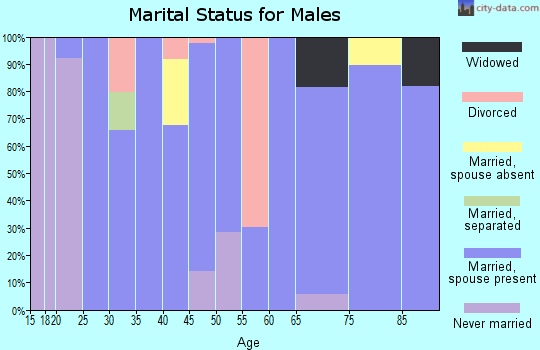
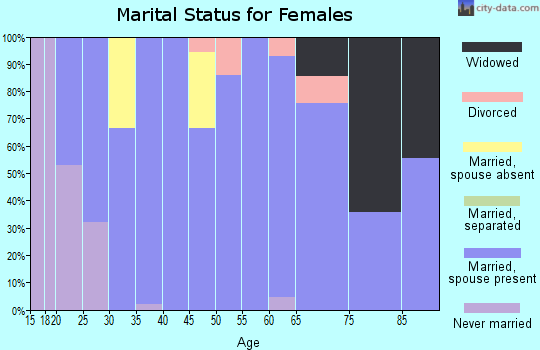
Women who had a birth in the past 12 months: 10 (10 now married, 0 unmarried) Women who did not have a birth in the past 12 months: 575 (353 now married, 219 unmarried)
Housing units in zip code 84325 with a mortgage: 457 (79 second mortgage, 82 both second mortgage and home equity loan) Houses without a mortgage: 4
Median monthly owner costs for units with a mortgage: $1,736 Median monthly owner costs for units without a mortgage: $473
Median number of rooms in houses and condos:
Here:
10.0
State:
7.6
Median number of rooms in apartments:
Here:
4.9
State:
4.3
Notable locations in this zip code not listed on our city pages
In group quarters: 10 (-1 institutionalized population)
Size of family households: 209 2-persons, 115 3-persons, 88 4-persons, 47 5-persons, 107 6-persons, 31 7-or-more-persons
Size of nonfamily households: 135 1-person, 2 2-persons
555 married couples with children.
29 single-parent households (29 women).
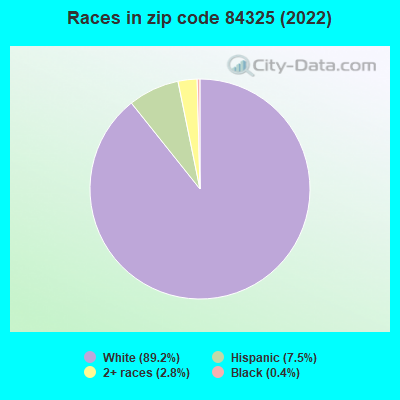
94.0% of residents of 84325 zip code speak English at home.
4.4% of residents speak Spanish at home (69% very well, 16% well, 14% not at all).
1.3% of residents speak other Indo-European language at home (100% very well).
Foreign born population: 65 (2.8%) (51.7% of them are naturalized citizens)
This zip code:
2.8%
Whole state:
8.6%
38%Honduras
17%Zimbabwe
12%Bolivia
8%Guyana
2%United Kingdom, excluding England and Scotland
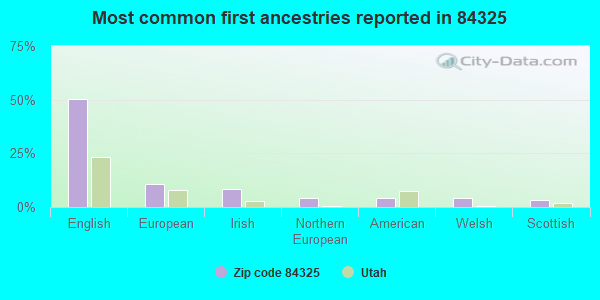
50%English
11%European
9%Irish
4%Northern European
4%American
4%Welsh
3%Scottish
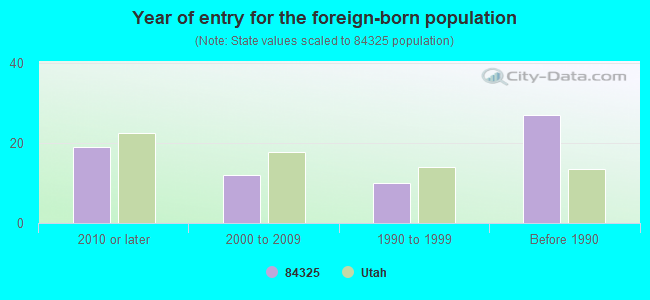
Year of entry for the foreign-born population
192010 or later
122000 to 2009
101990 to 1999
27Before 1990
Facilities with environmental interests located in this zip code:
MENDON CITY WATER SYSTEM (POB 70 in MENDON, UT)
(Integrated Compliance Information System) - ICIS-08-1996-0081, FORMAL ENFORCEMENT ACTION, ICIS-08-1997-0007, Business SIC classification: WATER SUPPLY
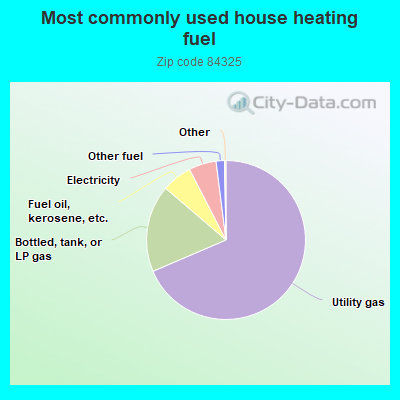
68.9%Utility gas
17.8%Bottled, tank, or LP gas
6.2%Fuel oil, kerosene, etc.
5.6%Electricity
1.7%Other fuel
Population in 1990: 1,015. Population change in the 1990s: +237 (+23.3%).
Place of birth for U.S.-born residents:
This state: 1,541
Northeast: 29
Midwest: 101
South: 88
West: 491
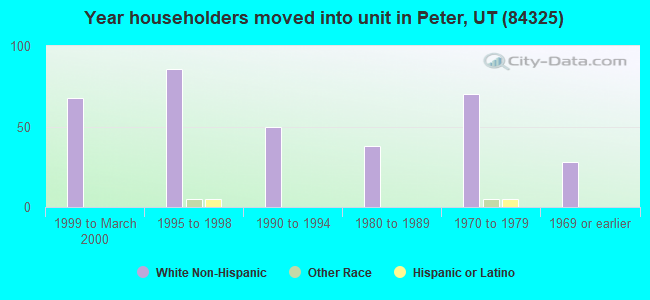
64% of the 84325 zip code residents lived in the same house 5 years ago. Out of people who lived in different houses, 62% lived in this county. Out of people who lived in different counties, 50% lived in Utah.
88% of the 84325 zip code residents lived in the same house 1 year ago. Out of people who lived in different houses, 4% moved from this county. Out of people who lived in different houses, 74% moved from different county within same state. Out of people who lived in different houses, 28% moved from different state.
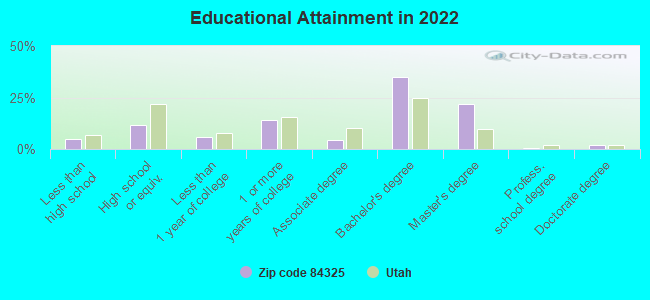
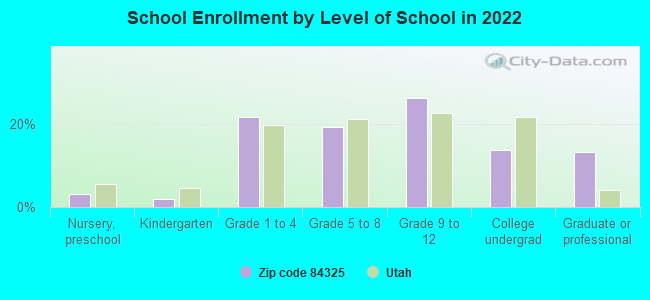
Private vs. public school enrollment:
Students in private schools in grades 1 to 8 (elementary and middle school): 13
Here:
4.3%
Utah:
7.2%
Students in private schools in grades 9 to 12 (high school): 7
Here:
3.6%
Utah:
5.3%
Students in private undergraduate colleges: 46
Here:
45.5%
Utah:
26.7%
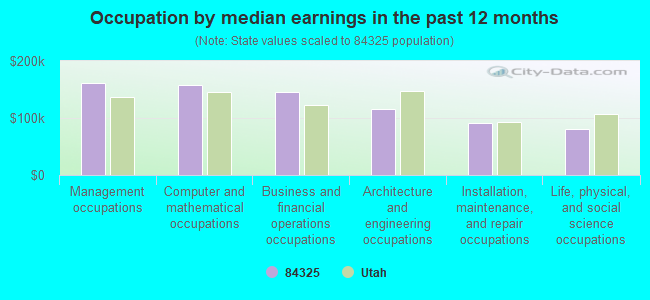
Occupation by median earnings in the past 12 months ($)
160,639Management occupations
157,654Computer and mathematical occupations
145,340Business and financial operations occupations
115,375Architecture and engineering occupations
91,294Installation, maintenance, and repair occupations
81,224Life, physical, and social science occupations
Companies with federal contracts located in this zip code:
PAUL MORRELL, INC (68 SO MAIN in MENDON, UT; small business) : $2,153,585 in 3 contractsfrom 2001 to 2002
$1,909,670 with Air Force for Maintenance, Repair and Rebuilding of Equipment -- Miscellaneous. Signed on 2001-12-10. Completion date: 2002-03-30.
$185,347, same as above.Signed on 2002-06-05. Completion date: 2002-07-30.
$58,568, same as above.Signed on 2002-06-17. Completion date: 2002-06-30.
Top industries in this zip code by the number of employees in 2005:
Construction: Commercial and Institutional Building Construction (10-19 employees: 1 establishment)
Construction: Plumbing, Heating, and Air-Conditioning Contractors (5-9: 1, 1-4: 1)
Construction: New Single-Family Housing Construction (except Operative Builders) (1-4: 4)
Real Estate and Rental and Leasing: Offices of Real Estate Agents and Brokers (1-4: 3)
Professional, Scientific, and Technical Services: All Other Professional, Scientific, and Technical Services (1-4: 2)
Construction: Poured Concrete Foundation and Structure Contractors (1-4: 2)
Construction: Electrical Contractors (1-4: 2)
Construction: All Other Specialty Trade Contractors (1-4: 2)
Professional, Scientific, and Technical Services: Engineering Services (1-4: 1)
Construction: Siding Contractors (1-4: 1)
People in group quarters in 2010:
9 people in residential treatment centers for juveniles (non-correctional)
Fatal accident statistics in 2013:
Fatal accident count: 1
Vehicles involved in fatal accidents: 2
Fatal accidents caused by drunken drivers: 0
Fatalities: 2
Persons involved in fatal accidents: 3
Pedestrians involved in fatal accidents: 0
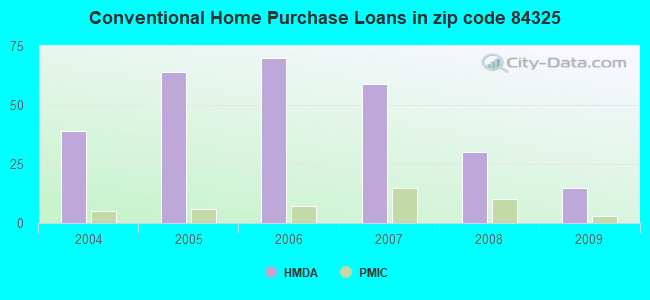
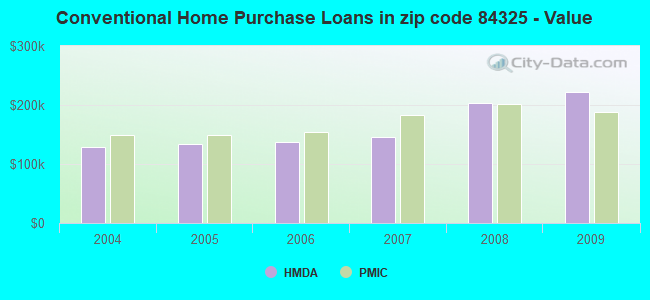
Home Mortgage Disclosure Act Aggregated Statistics For Year 2009 (Based on 4 partial tracts)
A) FHA, FSA/RHS & VA Home Purchase Loans
B) Conventional Home Purchase Loans
C) Refinancings
D) Home Improvement Loans
F) Non-occupant Loans on < 5 Family Dwellings (A B C & D)
G) Loans On Manufactured Home Dwelling (A B C & D)
Number
Average Value
Number
Average Value
Number
Average Value
Number
Average Value
Number
Average Value
Number
Average Value
LOANS ORIGINATED
22
$152,809
15
$221,282
143
$179,805
4
$121,022
1
$186,710
3
$114,110
APPLICATIONS APPROVED, NOT ACCEPTED
1
$96,270
3
$206,467
12
$209,640
2
$124,655
0
$0
0
$0
APPLICATIONS DENIED
4
$198,640
3
$205,993
40
$203,610
2
$44,030
2
$160,860
2
$129,770
APPLICATIONS WITHDRAWN
2
$166,730
1
$335,560
22
$198,993
0
$0
1
$82,170
1
$71,150
FILES CLOSED FOR INCOMPLETENESS
0
$0
0
$0
2
$233,565
1
$7,890
0
$0
0
$0
Aggregated Statistics For Year 2008 (Based on 4 partial tracts)
A) FHA, FSA/RHS & VA Home Purchase Loans
B) Conventional Home Purchase Loans
C) Refinancings
D) Home Improvement Loans
F) Non-occupant Loans on < 5 Family Dwellings (A B C & D)
G) Loans On Manufactured Home Dwelling (A B C & D)
Number
Average Value
Number
Average Value
Number
Average Value
Number
Average Value
Number
Average Value
Number
Average Value
LOANS ORIGINATED
18
$177,298
30
$203,834
81
$188,984
6
$107,373
6
$182,460
2
$97,220
APPLICATIONS APPROVED, NOT ACCEPTED
1
$267,310
3
$144,353
13
$205,560
2
$86,165
1
$107,340
1
$72,480
APPLICATIONS DENIED
4
$164,815
6
$170,645
38
$206,217
4
$66,685
5
$195,842
2
$91,820
APPLICATIONS WITHDRAWN
3
$167,523
3
$145,383
18
$212,298
2
$92,805
1
$376,930
0
$0
FILES CLOSED FOR INCOMPLETENESS
1
$165,670
0
$0
2
$227,500
0
$0
0
$0
0
$0
Aggregated Statistics For Year 2007 (Based on 4 partial tracts)
A) FHA, FSA/RHS & VA Home Purchase Loans
B) Conventional Home Purchase Loans
C) Refinancings
D) Home Improvement Loans
F) Non-occupant Loans on < 5 Family Dwellings (A B C & D)
G) Loans On Manufactured Home Dwelling (A B C & D)
Number
Average Value
Number
Average Value
Number
Average Value
Number
Average Value
Number
Average Value
Number
Average Value
LOANS ORIGINATED
11
$135,502
59
$145,855
71
$172,590
8
$74,364
10
$176,847
5
$87,884
APPLICATIONS APPROVED, NOT ACCEPTED
1
$39,880
7
$201,621
14
$216,409
2
$37,650
1
$124,460
1
$43,690
APPLICATIONS DENIED
1
$190,380
10
$163,952
35
$275,694
6
$99,772
3
$238,043
3
$61,553
APPLICATIONS WITHDRAWN
0
$0
5
$155,862
14
$194,818
1
$150,490
2
$181,495
0
$0
FILES CLOSED FOR INCOMPLETENESS
0
$0
1
$226,450
5
$182,246
1
$44,450
0
$0
0
$0
Aggregated Statistics For Year 2006 (Based on 4 partial tracts)
A) FHA, FSA/RHS & VA Home Purchase Loans
B) Conventional Home Purchase Loans
C) Refinancings
D) Home Improvement Loans
F) Non-occupant Loans on < 5 Family Dwellings (A B C & D)
G) Loans On Manufactured Home Dwelling (A B C & D)
Number
Average Value
Number
Average Value
Number
Average Value
Number
Average Value
Number
Average Value
Number
Average Value
LOANS ORIGINATED
16
$135,977
70
$136,718
71
$158,132
9
$64,986
12
$132,414
3
$109,797
APPLICATIONS APPROVED, NOT ACCEPTED
0
$0
9
$167,346
12
$131,973
1
$115,830
2
$90,435
1
$31,750
APPLICATIONS DENIED
1
$103,890
12
$170,509
27
$140,443
4
$84,322
2
$140,235
2
$82,715
APPLICATIONS WITHDRAWN
1
$124,620
11
$162,861
17
$138,763
0
$0
3
$172,367
0
$0
FILES CLOSED FOR INCOMPLETENESS
0
$0
3
$186,357
5
$127,274
0
$0
0
$0
0
$0
Aggregated Statistics For Year 2005 (Based on 4 partial tracts)
A) FHA, FSA/RHS & VA Home Purchase Loans
B) Conventional Home Purchase Loans
C) Refinancings
D) Home Improvement Loans
F) Non-occupant Loans on < 5 Family Dwellings (A B C & D)
G) Loans On Manufactured Home Dwelling (A B C & D)
Number
Average Value
Number
Average Value
Number
Average Value
Number
Average Value
Number
Average Value
Number
Average Value
LOANS ORIGINATED
11
$135,191
64
$134,142
54
$126,016
6
$65,283
9
$120,322
2
$96,775
APPLICATIONS APPROVED, NOT ACCEPTED
0
$0
8
$117,525
13
$111,370
2
$35,520
2
$146,850
1
$88,010
APPLICATIONS DENIED
1
$68,740
11
$101,232
31
$114,272
5
$37,930
2
$76,315
1
$65,680
APPLICATIONS WITHDRAWN
1
$160,020
7
$124,686
16
$145,828
3
$107,313
2
$68,505
2
$84,835
FILES CLOSED FOR INCOMPLETENESS
0
$0
1
$51,310
7
$142,393
1
$20,320
1
$51,310
1
$37,340
Aggregated Statistics For Year 2004 (Based on 4 partial tracts)
A) FHA, FSA/RHS & VA Home Purchase Loans
B) Conventional Home Purchase Loans
C) Refinancings
D) Home Improvement Loans
F) Non-occupant Loans on < 5 Family Dwellings (A B C & D)
G) Loans On Manufactured Home Dwelling (A B C & D)
Detailed PMIC statistics for the following Tracts:0003.00
, 0013.00
2002 - 2017 National Fire Incident Reporting System (NFIRS) incidents
According to the data from the years 2002 - 2017 the average number of fire incidents per year is 11. The highest number of fires - 29 took place in 2008, and the least - 4 in 2009. The data has a rising trend.
When looking into fire subcategories, the most reports belonged to: Outside Fires (53.1%), and Structure Fires (28.2%).
Fire incident types reported to NFIRS in Zip Code 84325


 Nearest zip codes: 84306, 84304, 84339, 84309, 84314, 84327.


 According to the data from the years 2002 - 2017 the average number of fire incidents per year is 11. The highest number of fires - 29 took place in 2008, and the least - 4 in 2009. The data has a rising trend.
 When looking into fire subcategories, the most reports belonged to: Outside Fires (53.1%), and Structure Fires (28.2%).