Estimated zip code population in 2022: 15,540
Zip code population in 2010: 10,822
Zip code population in 2000: 5,656
Houses and condos: 5,555
Renter-occupied apartments: 1,960
% of renters here:
38%State:
33%
March 2022 cost of living index in zip code 85305: 100.5
(near average, U.S. average is 100)
Land area: 6.3
sq. mi.
Water area: 0.0
sq. mi.
Population density: 2,453 people per square mile (low).
OSM Map
General Map
Google Map
MSN Map
OSM Map
General Map
Google Map
MSN Map
OSM Map
General Map
Google Map
MSN Map
OSM Map
General Map
Google Map
MSN Map
Please wait while loading the map...
Real estate property taxes paid for housing units in 2022:
This zip code:
0.5% ($2,199)Arizona:
0.4% ($1,786)
Median real estate property taxes paid for housing units with mortgages in 2022: $2,168 (0.5%)
Median real estate property taxes paid for housing units with no mortgage in 2022: $2,284 (0.6%)
Profiles of local businesses
Business Search - 14 Million verified businesses
Males: 7,728 Females: 7,811
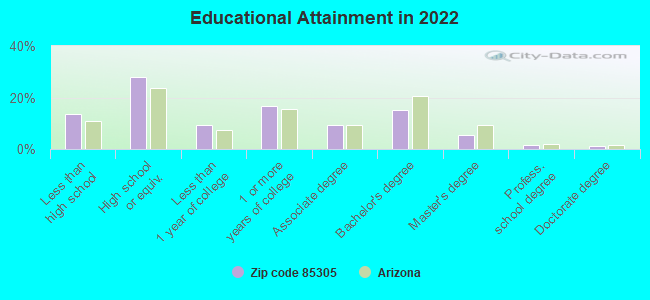
For population 25 years and over in 85305:
High school or higher: 86.4%Bachelor's degree or higher: 23.1%Graduate or professional degree: 8.1%Unemployed: 3.1%Mean travel time to work (commute): 28.9 minutes
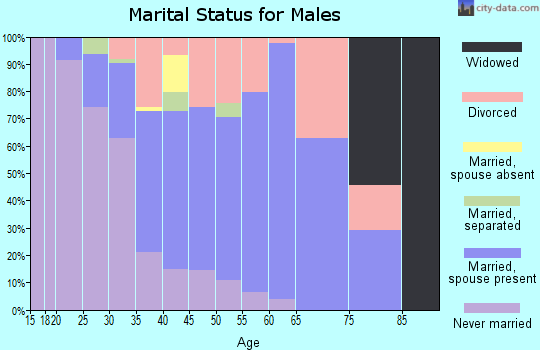
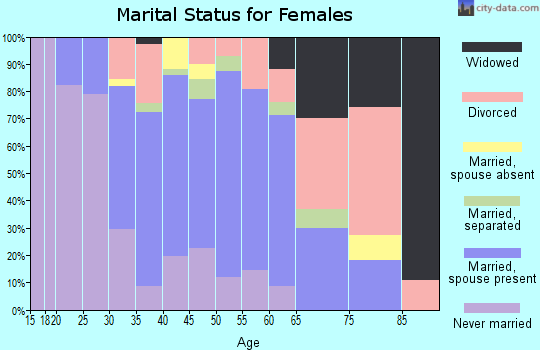
For population 15 years and over in 85305:
Never married: 43.1%Now married: 41.0%Separated: 1.5%Widowed: 4.2%Divorced: 10.2%
Zip code 85305 compared to state average:
Median age below state average. Length of stay since moving in significantly above state average. House age significantly below state average. Percentage of population with a bachelor's degree or higher below state average. 7,319 47.1% Hispanic or Latino 5,504 35.4% White 1,096 7.1% Black 873 5.6% Asian 414 2.7% Two or more races 290 1.9% American Indian 29 0.2% Some other race 11 0.07% Native Hawaiian and Other
Data:
Median household income ($)
Median household income (% change since 2000)
Household income diversity
Ratio of average income to average house value (%)
Ratio of average income to average rent
Median household income ($) - White
Median household income ($) - Black or African American
Median household income ($) - Asian
Median household income ($) - Hispanic or Latino
Median household income ($) - American Indian and Alaska Native
Median household income ($) - Multirace
Median household income ($) - Other Race
Median household income for houses/condos with a mortgage ($)
Median household income for apartments without a mortgage ($)
Races - White alone (%)
Races - White alone (% change since 2000)
Races - Black alone (%)
Races - Black alone (% change since 2000)
Races - American Indian alone (%)
Races - American Indian alone (% change since 2000)
Races - Asian alone (%)
Races - Asian alone (% change since 2000)
Races - Hispanic (%)
Races - Hispanic (% change since 2000)
Races - Native Hawaiian and Other Pacific Islander alone (%)
Races - Native Hawaiian and Other Pacific Islander alone (% change since 2000)
Races - Two or more races (%)
Races - Two or more races (% change since 2000)
Races - Other race alone (%)
Races - Other race alone (% change since 2000)
Racial diversity
Unemployment (%)
Unemployment (% change since 2000)
Unemployment (%) - White
Unemployment (%) - Black or African American
Unemployment (%) - Asian
Unemployment (%) - Hispanic or Latino
Unemployment (%) - American Indian and Alaska Native
Unemployment (%) - Multirace
Unemployment (%) - Other Race
Population density (people per square mile)
Population - Males (%)
Population - Females (%)
Population - Males (%) - White
Population - Males (%) - Black or African American
Population - Males (%) - Asian
Population - Males (%) - Hispanic or Latino
Population - Males (%) - American Indian and Alaska Native
Population - Males (%) - Multirace
Population - Males (%) - Other Race
Population - Females (%) - White
Population - Females (%) - Black or African American
Population - Females (%) - Asian
Population - Females (%) - Hispanic or Latino
Population - Females (%) - American Indian and Alaska Native
Population - Females (%) - Multirace
Population - Females (%) - Other Race
Coronavirus confirmed cases (Apr 23, 2024)
Deaths caused by coronavirus (Apr 23, 2024)
Coronavirus confirmed cases (per 100k population) (Apr 23, 2024)
Deaths caused by coronavirus (per 100k population) (Apr 23, 2024)
Daily increase in number of cases (Apr 23, 2024)
Weekly increase in number of cases (Apr 23, 2024)
Cases doubled (in days) (Apr 23, 2024)
Hospitalized patients (Apr 18, 2022)
Negative test results (Apr 18, 2022)
Total test results (Apr 18, 2022)
COVID Vaccine doses distributed (per 100k population) (Sep 19, 2023)
COVID Vaccine doses administered (per 100k population) (Sep 19, 2023)
COVID Vaccine doses distributed (Sep 19, 2023)
COVID Vaccine doses administered (Sep 19, 2023)
Likely homosexual households (%)
Likely homosexual households (% change since 2000)
Likely homosexual households - Lesbian couples (%)
Likely homosexual households - Lesbian couples (% change since 2000)
Likely homosexual households - Gay men (%)
Likely homosexual households - Gay men (% change since 2000)
Cost of living index
Median gross rent ($)
Median contract rent ($)
Median monthly housing costs ($)
Median house or condo value ($)
Median house or condo value ($ change since 2000)
Mean house or condo value by units in structure - 1, detached ($)
Mean house or condo value by units in structure - 1, attached ($)
Mean house or condo value by units in structure - 2 ($)
Mean house or condo value by units in structure by units in structure - 3 or 4 ($)
Mean house or condo value by units in structure - 5 or more ($)
Mean house or condo value by units in structure - Boat, RV, van, etc. ($)
Mean house or condo value by units in structure - Mobile home ($)
Median house or condo value ($) - White
Median house or condo value ($) - Black or African American
Median house or condo value ($) - Asian
Median house or condo value ($) - Hispanic or Latino
Median house or condo value ($) - American Indian and Alaska Native
Median house or condo value ($) - Multirace
Median house or condo value ($) - Other Race
Median resident age
Resident age diversity
Median resident age - Males
Median resident age - Females
Median resident age - White
Median resident age - Black or African American
Median resident age - Asian
Median resident age - Hispanic or Latino
Median resident age - American Indian and Alaska Native
Median resident age - Multirace
Median resident age - Other Race
Median resident age - Males - White
Median resident age - Males - Black or African American
Median resident age - Males - Asian
Median resident age - Males - Hispanic or Latino
Median resident age - Males - American Indian and Alaska Native
Median resident age - Males - Multirace
Median resident age - Males - Other Race
Median resident age - Females - White
Median resident age - Females - Black or African American
Median resident age - Females - Asian
Median resident age - Females - Hispanic or Latino
Median resident age - Females - American Indian and Alaska Native
Median resident age - Females - Multirace
Median resident age - Females - Other Race
Commute - mean travel time to work (minutes)
Travel time to work - Less than 5 minutes (%)
Travel time to work - Less than 5 minutes (% change since 2000)
Travel time to work - 5 to 9 minutes (%)
Travel time to work - 5 to 9 minutes (% change since 2000)
Travel time to work - 10 to 19 minutes (%)
Travel time to work - 10 to 19 minutes (% change since 2000)
Travel time to work - 20 to 29 minutes (%)
Travel time to work - 20 to 29 minutes (% change since 2000)
Travel time to work - 30 to 39 minutes (%)
Travel time to work - 30 to 39 minutes (% change since 2000)
Travel time to work - 40 to 59 minutes (%)
Travel time to work - 40 to 59 minutes (% change since 2000)
Travel time to work - 60 to 89 minutes (%)
Travel time to work - 60 to 89 minutes (% change since 2000)
Travel time to work - 90 or more minutes (%)
Travel time to work - 90 or more minutes (% change since 2000)
Marital status - Never married (%)
Marital status - Now married (%)
Marital status - Separated (%)
Marital status - Widowed (%)
Marital status - Divorced (%)
Median family income ($)
Median family income (% change since 2000)
Median non-family income ($)
Median non-family income (% change since 2000)
Median per capita income ($)
Median per capita income (% change since 2000)
Median family income ($) - White
Median family income ($) - Black or African American
Median family income ($) - Asian
Median family income ($) - Hispanic or Latino
Median family income ($) - American Indian and Alaska Native
Median family income ($) - Multirace
Median family income ($) - Other Race
Median year house/condo built
Median year apartment built
Year house built - Built 2005 or later (%)
Year house built - Built 2000 to 2004 (%)
Year house built - Built 1990 to 1999 (%)
Year house built - Built 1980 to 1989 (%)
Year house built - Built 1970 to 1979 (%)
Year house built - Built 1960 to 1969 (%)
Year house built - Built 1950 to 1959 (%)
Year house built - Built 1940 to 1949 (%)
Year house built - Built 1939 or earlier (%)
Average household size
Household density (households per square mile)
Average household size - White
Average household size - Black or African American
Average household size - Asian
Average household size - Hispanic or Latino
Average household size - American Indian and Alaska Native
Average household size - Multirace
Average household size - Other Race
Occupied housing units (%)
Vacant housing units (%)
Owner occupied housing units (%)
Renter occupied housing units (%)
Vacancy status - For rent (%)
Vacancy status - For sale only (%)
Vacancy status - Rented or sold, not occupied (%)
Vacancy status - For seasonal, recreational, or occasional use (%)
Vacancy status - For migrant workers (%)
Vacancy status - Other vacant (%)
Residents with income below the poverty level (%)
Residents with income below 50% of the poverty level (%)
Children below poverty level (%)
Poor families by family type - Married-couple family (%)
Poor families by family type - Male, no wife present (%)
Poor families by family type - Female, no husband present (%)
Poverty status for native-born residents (%)
Poverty status for foreign-born residents (%)
Poverty among high school graduates not in families (%)
Poverty among people who did not graduate high school not in families (%)
Residents with income below the poverty level (%) - White
Residents with income below the poverty level (%) - Black or African American
Residents with income below the poverty level (%) - Asian
Residents with income below the poverty level (%) - Hispanic or Latino
Residents with income below the poverty level (%) - American Indian and Alaska Native
Residents with income below the poverty level (%) - Multirace
Residents with income below the poverty level (%) - Other Race
Air pollution - Air Quality Index (AQI)
Air pollution - CO
Air pollution - NO2
Air pollution - SO2
Air pollution - Ozone
Air pollution - PM10
Air pollution - PM25
Air pollution - Pb
Crime - Murders per 100,000 population
Crime - Rapes per 100,000 population
Crime - Robberies per 100,000 population
Crime - Assaults per 100,000 population
Crime - Burglaries per 100,000 population
Crime - Thefts per 100,000 population
Crime - Auto thefts per 100,000 population
Crime - Arson per 100,000 population
Crime - City-data.com crime index
Crime - Violent crime index
Crime - Property crime index
Crime - Murders per 100,000 population (5 year average)
Crime - Rapes per 100,000 population (5 year average)
Crime - Robberies per 100,000 population (5 year average)
Crime - Assaults per 100,000 population (5 year average)
Crime - Burglaries per 100,000 population (5 year average)
Crime - Thefts per 100,000 population (5 year average)
Crime - Auto thefts per 100,000 population (5 year average)
Crime - Arson per 100,000 population (5 year average)
Crime - City-data.com crime index (5 year average)
Crime - Violent crime index (5 year average)
Crime - Property crime index (5 year average)
1996 Presidential Elections Results (%) - Democratic Party (Clinton)
1996 Presidential Elections Results (%) - Republican Party (Dole)
1996 Presidential Elections Results (%) - Other
2000 Presidential Elections Results (%) - Democratic Party (Gore)
2000 Presidential Elections Results (%) - Republican Party (Bush)
2000 Presidential Elections Results (%) - Other
2004 Presidential Elections Results (%) - Democratic Party (Kerry)
2004 Presidential Elections Results (%) - Republican Party (Bush)
2004 Presidential Elections Results (%) - Other
2008 Presidential Elections Results (%) - Democratic Party (Obama)
2008 Presidential Elections Results (%) - Republican Party (McCain)
2008 Presidential Elections Results (%) - Other
2012 Presidential Elections Results (%) - Democratic Party (Obama)
2012 Presidential Elections Results (%) - Republican Party (Romney)
2012 Presidential Elections Results (%) - Other
2016 Presidential Elections Results (%) - Democratic Party (Clinton)
2016 Presidential Elections Results (%) - Republican Party (Trump)
2016 Presidential Elections Results (%) - Other
2020 Presidential Elections Results (%) - Democratic Party (Biden)
2020 Presidential Elections Results (%) - Republican Party (Trump)
2020 Presidential Elections Results (%) - Other
Ancestries Reported - Arab (%)
Ancestries Reported - Czech (%)
Ancestries Reported - Danish (%)
Ancestries Reported - Dutch (%)
Ancestries Reported - English (%)
Ancestries Reported - French (%)
Ancestries Reported - French Canadian (%)
Ancestries Reported - German (%)
Ancestries Reported - Greek (%)
Ancestries Reported - Hungarian (%)
Ancestries Reported - Irish (%)
Ancestries Reported - Italian (%)
Ancestries Reported - Lithuanian (%)
Ancestries Reported - Norwegian (%)
Ancestries Reported - Polish (%)
Ancestries Reported - Portuguese (%)
Ancestries Reported - Russian (%)
Ancestries Reported - Scotch-Irish (%)
Ancestries Reported - Scottish (%)
Ancestries Reported - Slovak (%)
Ancestries Reported - Subsaharan African (%)
Ancestries Reported - Swedish (%)
Ancestries Reported - Swiss (%)
Ancestries Reported - Ukrainian (%)
Ancestries Reported - United States (%)
Ancestries Reported - Welsh (%)
Ancestries Reported - West Indian (%)
Ancestries Reported - Other (%)
Educational Attainment - No schooling completed (%)
Educational Attainment - Less than high school (%)
Educational Attainment - High school or equivalent (%)
Educational Attainment - Less than 1 year of college (%)
Educational Attainment - 1 or more years of college (%)
Educational Attainment - Associate degree (%)
Educational Attainment - Bachelor's degree (%)
Educational Attainment - Master's degree (%)
Educational Attainment - Professional school degree (%)
Educational Attainment - Doctorate degree (%)
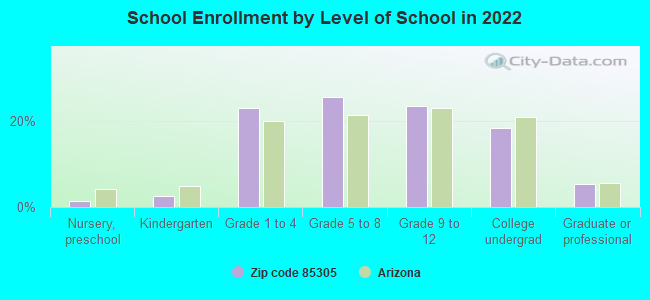
School Enrollment - Nursery, preschool (%)
School Enrollment - Kindergarten (%)
School Enrollment - Grade 1 to 4 (%)
School Enrollment - Grade 5 to 8 (%)
School Enrollment - Grade 9 to 12 (%)
School Enrollment - College undergrad (%)
School Enrollment - Graduate or professional (%)
School Enrollment - Not enrolled in school (%)
School enrollment - Public schools (%)
School enrollment - Private schools (%)
School enrollment - Not enrolled (%)
Median number of rooms in houses and condos
Median number of rooms in apartments
Housing units lacking complete plumbing facilities (%)
Housing units lacking complete kitchen facilities (%)
Density of houses
Urban houses (%)
Rural houses (%)
Households with people 60 years and over (%)
Households with people 65 years and over (%)
Households with people 75 years and over (%)
Households with one or more nonrelatives (%)
Households with no nonrelatives (%)
Population in households (%)
Family households (%)
Nonfamily households (%)
Population in families (%)
Family households with own children (%)
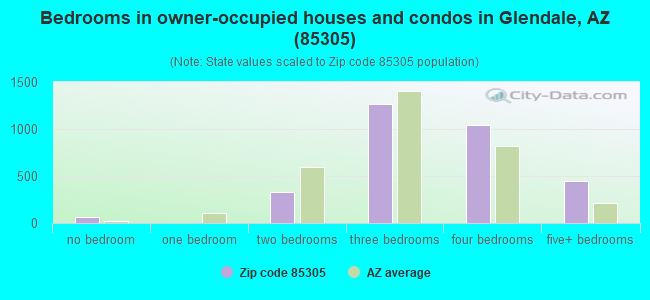
Median number of bedrooms in owner occupied houses
Mean number of bedrooms in owner occupied houses
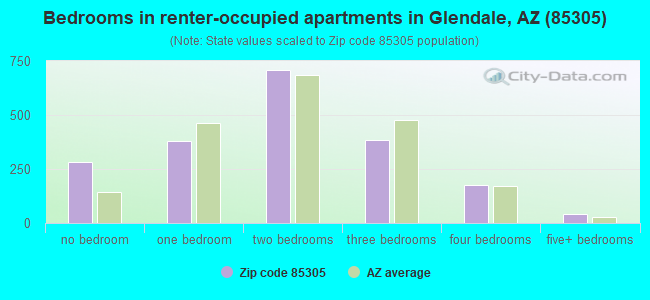
Median number of bedrooms in renter occupied houses
Mean number of bedrooms in renter occupied houses
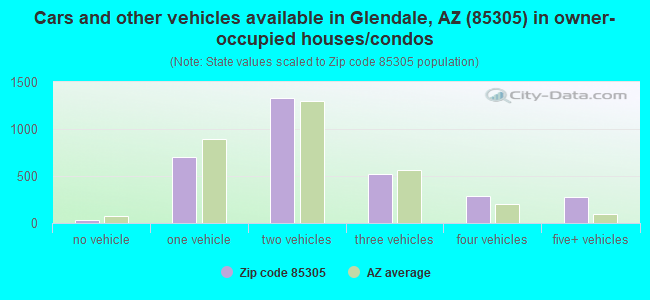
Median number of vehichles in owner occupied houses
Mean number of vehichles in owner occupied houses
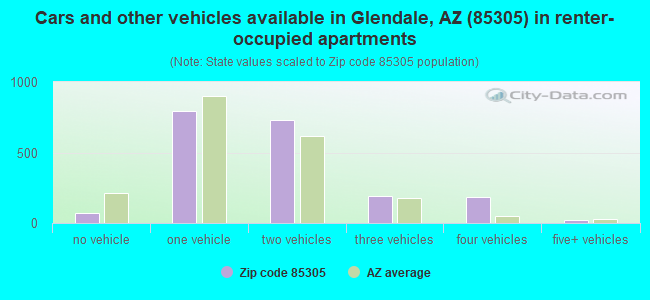
Median number of vehichles in renter occupied houses
Mean number of vehichles in renter occupied houses
Mortgage status - with mortgage (%)
Mortgage status - with second mortgage (%)
Mortgage status - with home equity loan (%)
Mortgage status - with both second mortgage and home equity loan (%)
Mortgage status - without a mortgage (%)
Average family size
Average family size - White
Average family size - Black or African American
Average family size - Asian
Average family size - Hispanic or Latino
Average family size - American Indian and Alaska Native
Average family size - Multirace
Average family size - Other Race
Geographical mobility - Same house 1 year ago (%)
Geographical mobility - Moved within same county (%)
Geographical mobility - Moved from different county within same state (%)
Geographical mobility - Moved from different state (%)
Geographical mobility - Moved from abroad (%)
Place of birth - Born in state of residence (%)
Place of birth - Born in other state (%)
Place of birth - Native, outside of US (%)
Place of birth - Foreign born (%)
Housing units in structures - 1, detached (%)
Housing units in structures - 1, attached (%)
Housing units in structures - 2 (%)
Housing units in structures - 3 or 4 (%)
Housing units in structures - 5 to 9 (%)
Housing units in structures - 10 to 19 (%)
Housing units in structures - 20 to 49 (%)
Housing units in structures - 50 or more (%)
Housing units in structures - Mobile home (%)
Housing units in structures - Boat, RV, van, etc. (%)
House/condo owner moved in on average (years ago)
Renter moved in on average (years ago)
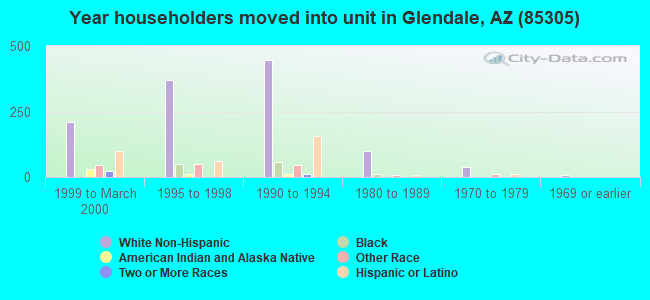
Year householder moved into unit - Moved in 1999 to March 2000 (%)
Year householder moved into unit - Moved in 1995 to 1998 (%)
Year householder moved into unit - Moved in 1990 to 1994 (%)
Year householder moved into unit - Moved in 1980 to 1989 (%)
Year householder moved into unit - Moved in 1970 to 1979 (%)
Year householder moved into unit - Moved in 1969 or earlier (%)
Means of transportation to work - Drove car alone (%)
Means of transportation to work - Carpooled (%)
Means of transportation to work - Public transportation (%)
Means of transportation to work - Bus or trolley bus (%)
Means of transportation to work - Streetcar or trolley car (%)
Means of transportation to work - Subway or elevated (%)
Means of transportation to work - Railroad (%)
Means of transportation to work - Ferryboat (%)
Means of transportation to work - Taxicab (%)
Means of transportation to work - Motorcycle (%)
Means of transportation to work - Bicycle (%)
Means of transportation to work - Walked (%)
Means of transportation to work - Other means (%)
Working at home (%)
Industry diversity
Most Common Industries - Agriculture, forestry, fishing and hunting, and mining (%)
Most Common Industries - Agriculture, forestry, fishing and hunting (%)
Most Common Industries - Mining, quarrying, and oil and gas extraction (%)
Most Common Industries - Construction (%)
Most Common Industries - Manufacturing (%)
Most Common Industries - Wholesale trade (%)
Most Common Industries - Retail trade (%)
Most Common Industries - Transportation and warehousing, and utilities (%)
Most Common Industries - Transportation and warehousing (%)
Most Common Industries - Utilities (%)
Most Common Industries - Information (%)
Most Common Industries - Finance and insurance, and real estate and rental and leasing (%)
Most Common Industries - Finance and insurance (%)
Most Common Industries - Real estate and rental and leasing (%)
Most Common Industries - Professional, scientific, and management, and administrative and waste management services (%)
Most Common Industries - Professional, scientific, and technical services (%)
Most Common Industries - Management of companies and enterprises (%)
Most Common Industries - Administrative and support and waste management services (%)
Most Common Industries - Educational services, and health care and social assistance (%)
Most Common Industries - Educational services (%)
Most Common Industries - Health care and social assistance (%)
Most Common Industries - Arts, entertainment, and recreation, and accommodation and food services (%)
Most Common Industries - Arts, entertainment, and recreation (%)
Most Common Industries - Accommodation and food services (%)
Most Common Industries - Other services, except public administration (%)
Most Common Industries - Public administration (%)
Occupation diversity
Most Common Occupations - Management, business, science, and arts occupations (%)
Most Common Occupations - Management, business, and financial occupations (%)
Most Common Occupations - Management occupations (%)
Most Common Occupations - Business and financial operations occupations (%)
Most Common Occupations - Computer, engineering, and science occupations (%)
Most Common Occupations - Computer and mathematical occupations (%)
Most Common Occupations - Architecture and engineering occupations (%)
Most Common Occupations - Life, physical, and social science occupations (%)
Most Common Occupations - Education, legal, community service, arts, and media occupations (%)
Most Common Occupations - Community and social service occupations (%)
Most Common Occupations - Legal occupations (%)
Most Common Occupations - Education, training, and library occupations (%)
Most Common Occupations - Arts, design, entertainment, sports, and media occupations (%)
Most Common Occupations - Healthcare practitioners and technical occupations (%)
Most Common Occupations - Health diagnosing and treating practitioners and other technical occupations (%)
Most Common Occupations - Health technologists and technicians (%)
Most Common Occupations - Service occupations (%)
Most Common Occupations - Healthcare support occupations (%)
Most Common Occupations - Protective service occupations (%)
Most Common Occupations - Fire fighting and prevention, and other protective service workers including supervisors (%)
Most Common Occupations - Law enforcement workers including supervisors (%)
Most Common Occupations - Food preparation and serving related occupations (%)
Most Common Occupations - Building and grounds cleaning and maintenance occupations (%)
Most Common Occupations - Personal care and service occupations (%)
Most Common Occupations - Sales and office occupations (%)
Most Common Occupations - Sales and related occupations (%)
Most Common Occupations - Office and administrative support occupations (%)
Most Common Occupations - Natural resources, construction, and maintenance occupations (%)
Most Common Occupations - Farming, fishing, and forestry occupations (%)
Most Common Occupations - Construction and extraction occupations (%)
Most Common Occupations - Installation, maintenance, and repair occupations (%)
Most Common Occupations - Production, transportation, and material moving occupations (%)
Most Common Occupations - Production occupations (%)
Most Common Occupations - Transportation occupations (%)
Most Common Occupations - Material moving occupations (%)
People in Group quarters - Institutionalized population (%)
People in Group quarters - Correctional institutions (%)
People in Group quarters - Federal prisons and detention centers (%)
People in Group quarters - Halfway houses (%)
People in Group quarters - Local jails and other confinement facilities (including police lockups) (%)
People in Group quarters - Military disciplinary barracks (%)
People in Group quarters - State prisons (%)
People in Group quarters - Other types of correctional institutions (%)
People in Group quarters - Nursing homes (%)
People in Group quarters - Hospitals/wards, hospices, and schools for the handicapped (%)
People in Group quarters - Hospitals/wards and hospices for chronically ill (%)
People in Group quarters - Hospices or homes for chronically ill (%)
People in Group quarters - Military hospitals or wards for chronically ill (%)
People in Group quarters - Other hospitals or wards for chronically ill (%)
People in Group quarters - Hospitals or wards for drug/alcohol abuse (%)
People in Group quarters - Mental (Psychiatric) hospitals or wards (%)
People in Group quarters - Schools, hospitals, or wards for the mentally retarded (%)
People in Group quarters - Schools, hospitals, or wards for the physically handicapped (%)
People in Group quarters - Institutions for the deaf (%)
People in Group quarters - Institutions for the blind (%)
People in Group quarters - Orthopedic wards and institutions for the physically handicapped (%)
People in Group quarters - Wards in general hospitals for patients who have no usual home elsewhere (%)
People in Group quarters - Wards in military hospitals for patients who have no usual home elsewhere (%)
People in Group quarters - Juvenile institutions (%)
People in Group quarters - Long-term care (%)
People in Group quarters - Homes for abused, dependent, and neglected children (%)
People in Group quarters - Residential treatment centers for emotionally disturbed children (%)
People in Group quarters - Training schools for juvenile delinquents (%)
People in Group quarters - Short-term care, detention or diagnostic centers for delinquent children (%)
People in Group quarters - Type of juvenile institution unknown (%)
People in Group quarters - Noninstitutionalized population (%)
People in Group quarters - College dormitories (includes college quarters off campus) (%)
People in Group quarters - Military quarters (%)
People in Group quarters - On base (%)
People in Group quarters - Barracks, unaccompanied personnel housing (UPH), (Enlisted/Officer), ;and similar group living quarters for military personnel (%)
People in Group quarters - Transient quarters for temporary residents (%)
People in Group quarters - Military ships (%)
People in Group quarters - Group homes (%)
People in Group quarters - Homes or halfway houses for drug/alcohol abuse (%)
People in Group quarters - Homes for the mentally ill (%)
People in Group quarters - Homes for the mentally retarded (%)
People in Group quarters - Homes for the physically handicapped (%)
People in Group quarters - Other group homes (%)
People in Group quarters - Religious group quarters (%)
People in Group quarters - Dormitories (%)
People in Group quarters - Agriculture workers' dormitories on farms (%)
People in Group quarters - Job Corps and vocational training facilities (%)
People in Group quarters - Other workers' dormitories (%)
People in Group quarters - Crews of maritime vessels (%)
People in Group quarters - Other nonhousehold living situations (%)
People in Group quarters - Other noninstitutional group quarters (%)
Residents speaking English at home (%)
Residents speaking English at home - Born in the United States (%)
Residents speaking English at home - Native, born elsewhere (%)
Residents speaking English at home - Foreign born (%)
Residents speaking Spanish at home (%)
Residents speaking Spanish at home - Born in the United States (%)
Residents speaking Spanish at home - Native, born elsewhere (%)
Residents speaking Spanish at home - Foreign born (%)
Residents speaking other language at home (%)
Residents speaking other language at home - Born in the United States (%)
Residents speaking other language at home - Native, born elsewhere (%)
Residents speaking other language at home - Foreign born (%)
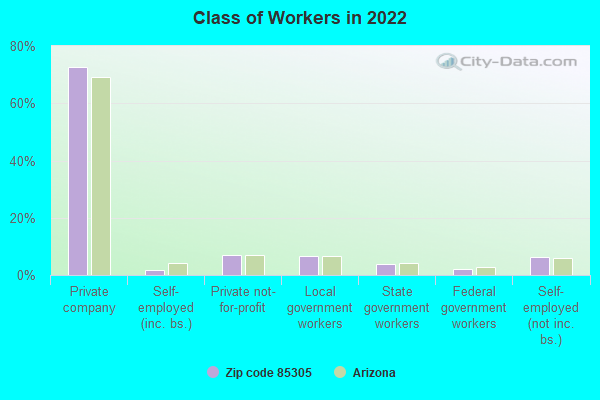
Class of Workers - Employee of private company (%)
Class of Workers - Self-employed in own incorporated business (%)
Class of Workers - Private not-for-profit wage and salary workers (%)
Class of Workers - Local government workers (%)
Class of Workers - State government workers (%)
Class of Workers - Federal government workers (%)
Class of Workers - Self-employed workers in own not incorporated business and Unpaid family workers (%)
House heating fuel used in houses and condos - Utility gas (%)
House heating fuel used in houses and condos - Bottled, tank, or LP gas (%)
House heating fuel used in houses and condos - Electricity (%)
House heating fuel used in houses and condos - Fuel oil, kerosene, etc. (%)
House heating fuel used in houses and condos - Coal or coke (%)
House heating fuel used in houses and condos - Wood (%)
House heating fuel used in houses and condos - Solar energy (%)
House heating fuel used in houses and condos - Other fuel (%)
House heating fuel used in houses and condos - No fuel used (%)
House heating fuel used in apartments - Utility gas (%)
House heating fuel used in apartments - Bottled, tank, or LP gas (%)
House heating fuel used in apartments - Electricity (%)
House heating fuel used in apartments - Fuel oil, kerosene, etc. (%)
House heating fuel used in apartments - Coal or coke (%)
House heating fuel used in apartments - Wood (%)
House heating fuel used in apartments - Solar energy (%)
House heating fuel used in apartments - Other fuel (%)
House heating fuel used in apartments - No fuel used (%)
Armed forces status - In Armed Forces (%)
Armed forces status - Civilian (%)
Armed forces status - Civilian - Veteran (%)
Armed forces status - Civilian - Nonveteran (%)
Fatal accidents locations in years 2005-2021
Fatal accidents locations in 2005
Fatal accidents locations in 2006
Fatal accidents locations in 2007
Fatal accidents locations in 2008
Fatal accidents locations in 2009
Fatal accidents locations in 2010
Fatal accidents locations in 2011
Fatal accidents locations in 2012
Fatal accidents locations in 2013
Fatal accidents locations in 2014
Fatal accidents locations in 2015
Fatal accidents locations in 2016
Fatal accidents locations in 2017
Fatal accidents locations in 2018
Fatal accidents locations in 2019
Fatal accidents locations in 2020
Fatal accidents locations in 2021
Alcohol use - People drinking some alcohol every month (%)
Alcohol use - People not drinking at all (%)
Alcohol use - Average days/month drinking alcohol
Alcohol use - Average drinks/week
Alcohol use - Average days/year people drink much
Audiometry - Average condition of hearing (%)
Audiometry - People that can hear a whisper from across a quiet room (%)
Audiometry - People that can hear normal voice from across a quiet room (%)
Audiometry - Ears ringing, roaring, buzzing (%)
Audiometry - Had a job exposure to loud noise (%)
Audiometry - Had off-work exposure to loud noise (%)
Blood Pressure & Cholesterol - Has high blood pressure (%)
Blood Pressure & Cholesterol - Checking blood pressure at home (%)
Blood Pressure & Cholesterol - Frequently checking blood cholesterol (%)
Blood Pressure & Cholesterol - Has high cholesterol level (%)
Consumer Behavior - Money monthly spent on food at supermarket/grocery store
Consumer Behavior - Money monthly spent on food at other stores
Consumer Behavior - Money monthly spent on eating out
Consumer Behavior - Money monthly spent on carryout/delivered foods
Consumer Behavior - Income spent on food at supermarket/grocery store (%)
Consumer Behavior - Income spent on food at other stores (%)
Consumer Behavior - Income spent on eating out (%)
Consumer Behavior - Income spent on carryout/delivered foods (%)
Current Health Status - General health condition (%)
Current Health Status - Blood donors (%)
Current Health Status - Has blood ever tested for HIV virus (%)
Current Health Status - Left-handed people (%)
Dermatology - People using sunscreen (%)
Diabetes - Diabetics (%)
Diabetes - Had a blood test for high blood sugar (%)
Diabetes - People taking insulin (%)
Diet Behavior & Nutrition - Diet health (%)
Diet Behavior & Nutrition - Milk product consumption (# of products/month)
Diet Behavior & Nutrition - Meals not home prepared (#/week)
Diet Behavior & Nutrition - Meals from fast food or pizza place (#/week)
Diet Behavior & Nutrition - Ready-to-eat foods (#/month)
Diet Behavior & Nutrition - Frozen meals/pizza (#/month)
Drug Use - People that ever used marijuana or hashish (%)
Drug Use - Ever used hard drugs (%)
Drug Use - Ever used any form of cocaine (%)
Drug Use - Ever used heroin (%)
Drug Use - Ever used methamphetamine (%)
Health Insurance - People covered by health insurance (%)
Kidney Conditions-Urology - Avg. # of times urinating at night
Medical Conditions - People with asthma (%)
Medical Conditions - People with anemia (%)
Medical Conditions - People with psoriasis (%)
Medical Conditions - People with overweight (%)
Medical Conditions - Elderly people having difficulties in thinking or remembering (%)
Medical Conditions - People who ever received blood transfusion (%)
Medical Conditions - People having trouble seeing even with glass/contacts (%)
Medical Conditions - People with arthritis (%)
Medical Conditions - People with gout (%)
Medical Conditions - People with congestive heart failure (%)
Medical Conditions - People with coronary heart disease (%)
Medical Conditions - People with angina pectoris (%)
Medical Conditions - People who ever had heart attack (%)
Medical Conditions - People who ever had stroke (%)
Medical Conditions - People with emphysema (%)
Medical Conditions - People with thyroid problem (%)
Medical Conditions - People with chronic bronchitis (%)
Medical Conditions - People with any liver condition (%)
Medical Conditions - People who ever had cancer or malignancy (%)
Mental Health - People who have little interest in doing things (%)
Mental Health - People feeling down, depressed, or hopeless (%)
Mental Health - People who have trouble sleeping or sleeping too much (%)
Mental Health - People feeling tired or having little energy (%)
Mental Health - People with poor appetite or overeating (%)
Mental Health - People feeling bad about themself (%)
Mental Health - People who have trouble concentrating on things (%)
Mental Health - People moving or speaking slowly or too fast (%)
Mental Health - People having thoughts they would be better off dead (%)
Oral Health - Average years since last visit a dentist
Oral Health - People embarrassed because of mouth (%)
Oral Health - People with gum disease (%)
Oral Health - General health of teeth and gums (%)
Oral Health - Average days a week using dental floss/device
Oral Health - Average days a week using mouthwash for dental problem
Oral Health - Average number of teeth
Pesticide Use - Households using pesticides to control insects (%)
Pesticide Use - Households using pesticides to kill weeds (%)
Physical Activity - People doing vigorous-intensity work activities (%)
Physical Activity - People doing moderate-intensity work activities (%)
Physical Activity - People walking or bicycling (%)
Physical Activity - People doing vigorous-intensity recreational activities (%)
Physical Activity - People doing moderate-intensity recreational activities (%)
Physical Activity - Average hours a day doing sedentary activities
Physical Activity - Average hours a day watching TV or videos
Physical Activity - Average hours a day using computer
Physical Functioning - People having limitations keeping them from working (%)
Physical Functioning - People limited in amount of work they can do (%)
Physical Functioning - People that need special equipment to walk (%)
Physical Functioning - People experiencing confusion/memory problems (%)
Physical Functioning - People requiring special healthcare equipment (%)
Prescription Medications - Average number of prescription medicines taking
Preventive Aspirin Use - Adults 40+ taking low-dose aspirin (%)
Reproductive Health - Vaginal deliveries (%)
Reproductive Health - Cesarean deliveries (%)
Reproductive Health - Deliveries resulted in a live birth (%)
Reproductive Health - Pregnancies resulted in a delivery (%)
Reproductive Health - Women breastfeeding newborns (%)
Reproductive Health - Women that had a hysterectomy (%)
Reproductive Health - Women that had both ovaries removed (%)
Reproductive Health - Women that have ever taken birth control pills (%)
Reproductive Health - Women taking birth control pills (%)
Reproductive Health - Women that have ever used Depo-Provera or injectables (%)
Reproductive Health - Women that have ever used female hormones (%)
Sexual Behavior - People 18+ that ever had sex (vaginal, anal, or oral) (%)
Sexual Behavior - Males 18+ that ever had vaginal sex with a woman (%)
Sexual Behavior - Males 18+ that ever performed oral sex on a woman (%)
Sexual Behavior - Males 18+ that ever had anal sex with a woman (%)
Sexual Behavior - Males 18+ that ever had any sex with a man (%)
Sexual Behavior - Females 18+ that ever had vaginal sex with a man (%)
Sexual Behavior - Females 18+ that ever performed oral sex on a man (%)
Sexual Behavior - Females 18+ that ever had anal sex with a man (%)
Sexual Behavior - Females 18+ that ever had any kind of sex with a woman (%)
Sexual Behavior - Average age people first had sex
Sexual Behavior - Average number of female sex partners in lifetime (males 18+)
Sexual Behavior - Average number of female vaginal sex partners in lifetime (males 18+)
Sexual Behavior - Average age people first performed oral sex on a woman (18+)
Sexual Behavior - Average number of woman performed oral sex on in lifetime (18+)
Sexual Behavior - Average number of male sex partners in lifetime (males 18+)
Sexual Behavior - Average number of male anal sex partners in lifetime (males 18+)
Sexual Behavior - Average age people first performed oral sex on a man (18+)
Sexual Behavior - Average number of male oral sex partners in lifetime (18+)
Sexual Behavior - People using protection when performing oral sex (%)
Sexual Behavior - Average number of times people have vaginal or anal sex a year
Sexual Behavior - People having sex without condom (%)
Sexual Behavior - Average number of male sex partners in lifetime (females 18+)
Sexual Behavior - Average number of male vaginal sex partners in lifetime (females 18+)
Sexual Behavior - Average number of female sex partners in lifetime (females 18+)
Sexual Behavior - Circumcised males 18+ (%)
Sleep Disorders - Average hours sleeping at night
Sleep Disorders - People that has trouble sleeping (%)
Smoking-Cigarette Use - People smoking cigarettes (%)
Taste & Smell - People 40+ having problems with smell (%)
Taste & Smell - People 40+ having problems with taste (%)
Taste & Smell - People 40+ that ever had wisdom teeth removed (%)
Taste & Smell - People 40+ that ever had tonsils teeth removed (%)
Taste & Smell - People 40+ that ever had a loss of consciousness because of a head injury (%)
Taste & Smell - People 40+ that ever had a broken nose or other serious injury to face or skull (%)
Taste & Smell - People 40+ that ever had two or more sinus infections (%)
Weight - Average height (inches)
Weight - Average weight (pounds)
Weight - Average BMI
Weight - People that are obese (%)
Weight - People that ever were obese (%)
Weight - People trying to lose weight (%)
Urban population: 15,174
Rural population: 365
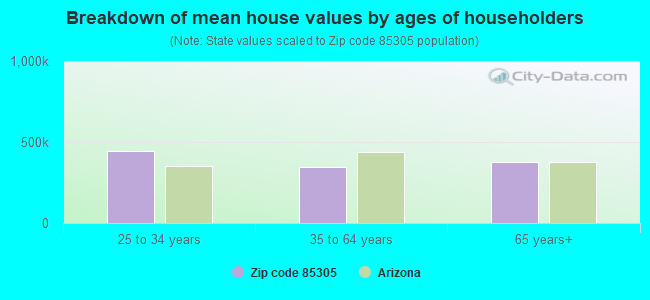
Estimated median house/condo value in 2022: $433,380
85305:
$433,380Arizona:
$402,800
According to our research of Arizona and other state lists, there were 7 registered sex offenders living in 85305 zip code as of April 23, 2024 . The ratio of all residents to sex offenders in zip code 85305 is 1,706 to 1.The ratio of registered sex offenders to all residents in this zip code is lower than the state average.
Median resident age: This zip code:
31.9 yearsArizona median age:
38.8 years
Average household size: This zip code:
3.0 peopleArizona:
2.5 people
Averages for the 2020 tax year for zip code 85305, filed in 2021:
Average Adjusted Gross Income (AGI) in 2020: $60,202 (Individual Income Tax Returns) Here:
$60,202State:
$73,499
Salary/wage: $55,035 (reported on 88.1% of returns )Here:
$55,035State:
$59,499
(% of AGI for various income ranges: 1278.6% for AGIs below $25k , 4037.9% for AGIs $25k-50k , 7654.7% for AGIs $50k-75k , 11160.9% for AGIs $75k-100k , 21440.0% for AGIs $100k-200k , 91168.0% for AGIs over 200k ) Taxable interest for individuals: $929 (reported on 15.0% of returns )This zip code:
$929Arizona:
$2,325
(% of AGI for various income ranges: 4.6% for AGIs below $25k , 6.0% for AGIs $25k-50k , 10.3% for AGIs $50k-75k , 11.9% for AGIs $75k-100k , 81.1% for AGIs $100k-200k , 570.0% for AGIs over 200k ) Ordinary dividends: $2,197 (reported on 8.8% of returns )(% of AGI for various income ranges: 5.6% for AGIs below $25k , 10.7% for AGIs $25k-50k , 28.4% for AGIs $50k-75k , 27.9% for AGIs $75k-100k , 60.6% for AGIs $100k-200k , 966.0% for AGIs over 200k ) Net capital gain/loss in AGI: +$13,326 (reported on 9.7% of returns )Here:
+$13,326State:
+$31,332
(% of AGI for various income ranges: 4.7% for AGIs below $25k , 6.5% for AGIs $25k-50k , 69.3% for AGIs $50k-75k , 62.1% for AGIs $75k-100k , 374.9% for AGIs $100k-200k , 13234.0% for AGIs over 200k ) Profit/loss from business: +$11,212 (reported on 17.1% of returns )Here:
+$11,212State:
+$13,214
(% of AGI for various income ranges: 136.7% for AGIs below $25k , 155.4% for AGIs $25k-50k , 152.0% for AGIs $50k-75k , 435.1% for AGIs $75k-100k , 355.3% for AGIs $100k-200k , 8390.0% for AGIs over 200k ) Taxable individual retirement arrangement distribution: $18,258 (reported on 3.5% of returns )85305:
$18,258Arizona:
$23,364
(% of AGI for various income ranges: 22.6% for AGIs below $25k , 20.6% for AGIs $25k-50k , 73.9% for AGIs $50k-75k , 167.2% for AGIs $75k-100k , 511.3% for AGIs $100k-200k ) Total itemized deductions: $30,900 (reported on 7.8% of returns )Here:
$30,900State:
$36,308
(% of AGI for various income ranges: 31.9% for AGIs below $25k , 105.3% for AGIs $25k-50k , 309.7% for AGIs $50k-75k , 508.8% for AGIs $75k-100k , 1150.9% for AGIs $100k-200k , 9678.0% for AGIs over 200k ) Charity contributions: $6,857 (reported on 5.9% of returns )(% of AGI for various income ranges: 11.1% for AGIs $25k-50k , 33.6% for AGIs $50k-75k , 76.0% for AGIs $75k-100k , 236.8% for AGIs $100k-200k , 1962.0% for AGIs over 200k ) Taxes paid: $6,198 (reported on 7.7% of returns )(% of AGI for various income ranges: 2.5% for AGIs below $25k , 16.3% for AGIs $25k-50k , 61.3% for AGIs $50k-75k , 114.2% for AGIs $75k-100k , 280.8% for AGIs $100k-200k , 1502.0% for AGIs over 200k ) Earned income credit: $2,356 (reported on 17.5% of returns )(% of AGI for various income ranges: 106.0% for AGIs below $25k , 69.5% for AGIs $25k-50k ) Percentage of individuals using paid preparers for their 2020 taxes: 92.6%(% for various income ranges: 91.7% for AGIs below $25k , 93.3% for AGIs $25k-50k , 93.8% for AGIs $50k-75k , 91.2% for AGIs $75k-100k , 94.1% for AGIs $100k-200k , 85.0% for AGIs over 200k )
Averages for the 2012 tax year for zip code 85305, filed in 2013:
Average Adjusted Gross Income (AGI) in 2012: $50,201 (Individual Income Tax Returns) Here:
$50,201State:
$57,644
Salary/wage: $47,619 (reported on 89.6% of returns )Here:
$47,619State:
$47,932
(% of AGI for various income ranges: 80.4% for AGIs below $25k , 89.4% for AGIs $25k-50k , 88.4% for AGIs $50k-75k , 83.8% for AGIs $75k-100k , 85.5% for AGIs $100k-200k , 72.6% for AGIs over 200k ) Taxable interest for individuals: $447 (reported on 20.1% of returns )This zip code:
$447Arizona:
$2,064
(% of AGI for various income ranges: 0.5% for AGIs below $25k , 0.1% for AGIs $25k-50k , 0.2% for AGIs $50k-75k , 0.2% for AGIs $75k-100k , 0.1% for AGIs $100k-200k , 0.2% for AGIs over 200k ) Ordinary dividends: $1,428 (reported on 9.7% of returns )(% of AGI for various income ranges: 0.7% for AGIs below $25k , 0.3% for AGIs $25k-50k , 0.3% for AGIs $50k-75k , 0.3% for AGIs $75k-100k , 0.2% for AGIs $100k-200k ) Net capital gain/loss in AGI: +$1,205 (reported on 7.9% of returns )Here:
+$1,205State:
+$15,530
(% of AGI for various income ranges: 0.2% for AGIs $50k-75k , 0.3% for AGIs $75k-100k , 0.4% for AGIs $100k-200k ) Profit/loss from business: +$10,222 (reported on 14.9% of returns )Here:
+$10,222State:
+$12,323
(% of AGI for various income ranges: 9.9% for AGIs below $25k , 2.8% for AGIs $25k-50k , 1.7% for AGIs $50k-75k , 2.2% for AGIs $75k-100k , 3.3% for AGIs $100k-200k ) Taxable individual retirement arrangement distribution: $14,684 (reported on 4.8% of returns )85305:
$14,684Arizona:
$18,280
(% of AGI for various income ranges: 1.4% for AGIs below $25k , 0.9% for AGIs $25k-50k , 1.4% for AGIs $50k-75k , 1.8% for AGIs $75k-100k , 2.1% for AGIs $100k-200k ) Total itemized deductions: $19,714 (23% of AGI, reported on 30.7% of returns )Here:
$19,714State:
$23,651
Here:
22.9% of AGIState:
20.6% of AGI
(% of AGI for various income ranges: 10.5% for AGIs below $25k , 9.0% for AGIs $25k-50k , 12.3% for AGIs $50k-75k , 13.9% for AGIs $75k-100k , 14.3% for AGIs $100k-200k , 10.2% for AGIs over 200k ) Charity contributions: $3,068 (reported on 25.1% of returns )(% of AGI for various income ranges: 0.7% for AGIs below $25k , 0.8% for AGIs $25k-50k , 1.5% for AGIs $50k-75k , 1.9% for AGIs $75k-100k , 2.1% for AGIs $100k-200k , 2.0% for AGIs over 200k ) Taxes paid: $4,950 (reported on 30.5% of returns )(% of AGI for various income ranges: 1.9% for AGIs below $25k , 1.6% for AGIs $25k-50k , 2.7% for AGIs $50k-75k , 3.3% for AGIs $75k-100k , 4.0% for AGIs $100k-200k , 4.6% for AGIs over 200k ) Earned income credit: $2,381 (reported on 20.8% of returns )(% of AGI for various income ranges: 7.8% for AGIs below $25k , 1.3% for AGIs $25k-50k ) Percentage of individuals using paid preparers for their 2012 taxes: 51.7%(% for various income ranges: 51.1% for AGIs below $25k , 48.3% for AGIs $25k-50k , 51.3% for AGIs $50k-75k , 58.5% for AGIs $75k-100k , 55.8% for AGIs $100k-200k , 66.7% for AGIs over 200k )
Averages for the 2004 tax year for zip code 85305, filed in 2005:
Average Adjusted Gross Income (AGI) in 2004: $46,713 (Individual Income Tax Returns) Here:
$46,713State:
$50,097
Salary/wage: $43,804 (reported on 92.5% of returns )Here:
$43,804State:
$42,146
(% of AGI for various income ranges: 105.8% for AGIs below $10k , 88.2% for AGIs $10k-25k , 89.7% for AGIs $25k-50k , 89.3% for AGIs $50k-75k , 90.5% for AGIs $75k-100k , 76.8% for AGIs over 100k ) Taxable interest for individuals: $932 (reported on 33.3% of returns )This zip code:
$932Arizona:
$2,374
(% of AGI for various income ranges: 1.9% for AGIs below $10k , 0.6% for AGIs $10k-25k , 0.5% for AGIs $25k-50k , 0.3% for AGIs $50k-75k , 0.6% for AGIs $75k-100k , 1.2% for AGIs over 100k ) Taxable dividends: $1,014 (reported on 13.8% of returns )(% of AGI for various income ranges: 1.2% for AGIs below $10k , 0.2% for AGIs $10k-25k , 0.2% for AGIs $25k-50k , 0.1% for AGIs $50k-75k , 0.2% for AGIs $75k-100k , 0.6% for AGIs over 100k ) Net capital gain/loss: +$7,024 (reported on 11.8% of returns )Here:
+$7,024State:
+$17,569
(% of AGI for various income ranges: -1.3% for AGIs below $10k , 0.0% for AGIs $10k-25k , 0.3% for AGIs $25k-50k , 0.8% for AGIs $50k-75k , 0.9% for AGIs $75k-100k , 5.7% for AGIs over 100k ) Profit/loss from business: +$6,342 (reported on 13.5% of returns )Here:
+$6,342State:
+$11,088
(% of AGI for various income ranges: 4.6% for AGIs below $10k , 6.5% for AGIs $10k-25k , 2.4% for AGIs $25k-50k , 1.8% for AGIs $50k-75k , 0.3% for AGIs $75k-100k , 0.9% for AGIs over 100k ) IRA payment deduction: $2,844 (reported on 2.0% of returns )85305:
$2,844Arizona:
$3,023
Total itemized deductions: $17,265 (25% of AGI, reported on 46.5% of returns )Here:
$17,265State:
$19,781
Here:
24.6% of AGIState:
21.8% of AGI
(% of AGI for various income ranges: 15.2% for AGIs below $10k , 9.4% for AGIs $10k-25k , 17.3% for AGIs $25k-50k , 19.1% for AGIs $50k-75k , 19.2% for AGIs $75k-100k , 16.2% for AGIs over 100k ) Charity contributions deductions: $2,375 (3% of AGI, reported on 40.4% of returns )Here:
3.3% of AGIState:
3.5% of AGI
(% of AGI for various income ranges: 0.7% for AGIs below $10k , 0.7% for AGIs $10k-25k , 1.6% for AGIs $25k-50k , 2.2% for AGIs $50k-75k , 2.2% for AGIs $75k-100k , 2.8% for AGIs over 100k ) Total tax: $5,474 (reported on 76.7% of returns )(% of AGI for various income ranges: 3.4% for AGIs below $10k , 4.0% for AGIs $10k-25k , 5.7% for AGIs $25k-50k , 7.5% for AGIs $50k-75k , 9.4% for AGIs $75k-100k , 15.2% for AGIs over 100k ) Earned income credit: $1,854 (reported on 16.0% of returns )Percentage of individuals using paid preparers for their 2004 taxes: 58.6%(% for various income ranges: 47.3% for AGIs below $10k , 60.1% for AGIs $10k-25k , 60.7% for AGIs $25k-50k , 61.4% for AGIs $50k-75k , 57.5% for AGIs $75k-100k , 60.7% for AGIs over 100k )
Estimated median household income in 2022: This zip code:
$98,243Arizona:
$74,568
Nearest zip codes: 85303 ,
85345 ,
85037 ,
85307 ,
85033 ,
85363 .
Phoenix Zip Code Map
Percentage of family households: This zip code:
54.0%Arizona:
43.6%
Percentage of households with unmarried partners: This zip code:
9.7%Arizona:
46.7%
Likely homosexual households (counted as self-reported same-sex unmarried-partner households)
Lesbian couples: 0.9% of all households Gay men: 0.5% of all households
Household received Food Stamps/SNAP in the past 12 months: 579Household did not receive Food Stamps/SNAP in the past 12 months: 4,531
Women who had a birth in the past 12 months: 277 (100 now married , 171 unmarried) Women who did not have a birth in the past 12 months: 3,873 (1,673 now married , 2,195 unmarried)
Housing units in zip code 85305 with a mortgage: 2,235 (156
second mortgage , 121
both second mortgage and home equity loan )
Houses without a mortgage: 8
Median monthly owner costs for units with a mortgage: $1,881
Median monthly owner costs for units without a mortgage: $508
Residents with income below the poverty level in 2022:
This zip code:
7.3%Whole state:
12.5%
Residents with income below 50% of the poverty level in 2022:
This zip code:
2.4%Whole state:
6.0%
Median number of rooms in houses and condos: Median number of rooms in apartments:
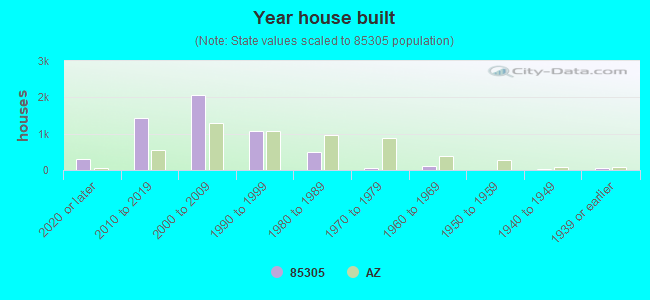
Year house built (houses)
301 2020 or later1,435 2010 to 20192,071 2000 to 20091,085 1990 to 1999499 1980 to 198959 1970 to 1979109 1960 to 19697 1950 to 195940 1940 to 194945 1939 or earlier
Zip code 85305 household income distribution in 2022 43 Less than $10,00055 $10,000 to $14,99963 $15,000 to $19,99987 $20,000 to $24,999180 $25,000 to $29,999125 $30,000 to $34,999126 $35,000 to $39,99991 $40,000 to $44,999143 $45,000 to $49,999374 $50,000 to $59,999525 $60,000 to $74,999908 $75,000 to $99,999743 $100,000 to $124,999483 $125,000 to $149,999706 $150,000 to $199,999465 $200,000 or moreEstimate of home value of owner-occupied houses/condos in 2022 in zip code 85305 24 Less than $10,00021 $10,000 to $14,99935 $20,000 to $24,99981 $25,000 to $29,99928 $35,000 to $39,99918 $40,000 to $49,99923 $70,000 to $79,99920 $125,000 to $149,99923 $150,000 to $174,9997 $175,000 to $199,99949 $200,000 to $249,999454 $250,000 to $299,999921 $300,000 to $399,999644 $400,000 to $499,999744 $500,000 to $749,999112 $750,000 to $999,9997 $1,000,000 to $1,499,999Rent paid by renters in 2022 in zip code 85305 11 $650 to $69937 $750 to $7997 $800 to $899339 $1,000 to $1,249526 $1,250 to $1,499996 $1,500 to $1,999349 $2,000 to $2,49925 $2,500 to $2,99931 No cash rent
Median gross rent in 2022: $1,916.
Median price asked for vacant for-sale houses and condos in 2022: $512,342.
Estimated median house (or condo) value in 2022 for: White Non-Hispanic householders: $444,695Black or African American householders: $447,335American Indian or Alaska Native householders: $433,756Asian householders: $424,327Some other race householders: $434,888Two or more races householders: $424,327Hispanic or Latino householders: $432,625Estimated median house or condo value in 2022: $433,380
85305:
$433,380Arizona:
$402,800
Lower value quartile - upper value quartile: $350,170 - $578,586
Mean price in 2022: Detached houses: $378,504Here:
$378,504State:
$521,408
Townhouses or other attached units: $271,552Here:
$271,552State:
$387,465
Mobile homes: $62,570Here:
$62,570State:
$141,516
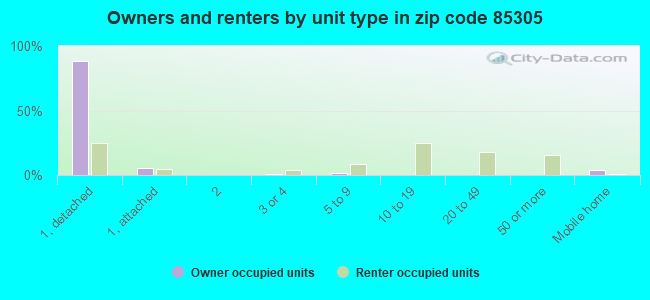
Housing units in structures:
One, detached: 3,313One, attached: 2663 or 4: 875 to 9: 21310 to 19: 51520 to 49: 36150 or more: 709Mobile homes: 126Unemployment : 3.1%
Means of transportation to work in zip code 85305 70.4% 6,085 Drove a car alone9.5% 824 Carpooled0.1% 12 Bus or trolley bus0.3% 26 Taxi0.0% 4 Motorcycle0.4% 33 Walked1.4% 121 Other means17.5% 1,513 Worked at homeTravel time to work (commute) in zip code 85305 70 Less than 5 minutes388 5 to 9 minutes637 10 to 14 minutes950 15 to 19 minutes894 20 to 24 minutes873 25 to 29 minutes1,145 30 to 34 minutes194 35 to 39 minutes562 40 to 44 minutes627 45 to 59 minutes689 60 to 89 minutes53 90 or more minutes
Neighborhoods in zip code 85305: Percentage of zip code residents living and working in this county: 97.8%
Household type by relationship:
Households: 15,540
Male householders: 2,637 (612 living alone ), Female householders: 2,472 (501 living alone )2,285 spouses (2,266 opposite-sex spouses ), 819 unmarried partners , (798 opposite-sex unmarried partners ), 5,095 children (4,730 natural , 215 adopted , 152 stepchildren ), 202 grandchildren , 458 brothers or sisters , 379 parents , 0 foster children , 522 other relatives , 629 non-relatives In group quarters: 32 (-1 institutionalized population )
Size of family households: 673 2-persons , 1,092 3-persons , 922 4-persons , 480 5-persons , 229 6-persons , 119 7-or-more-persons
Size of nonfamily households: 1,114 1-person , 419 2-persons , 36 3-persons , 9 4-persons
2,042 married couples with children. single-parent households (491 men , 672 women ).
62.5% of residents of 85305 zip code speak English at home. of residents speak Spanish at home (72% very well, 19% well, 7% not well, 3% not at all ).of residents speak other Indo-European language at home (89% very well, 5% well, 4% not well, 2% not at all ).of residents speak Asian or Pacific Island language at home (69% very well, 15% well, 14% not well, 1% not at all ).of residents speak other language at home (91% very well, 9% well ).
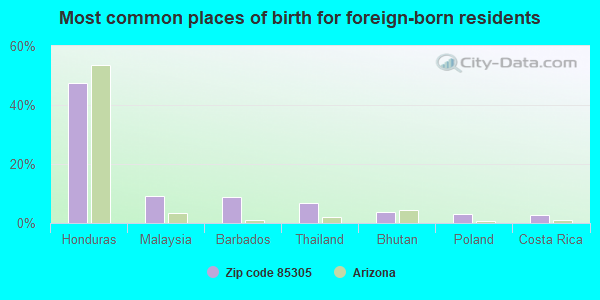
Foreign born population: 2,551 (16.4%)
(59.1%
of them are naturalized citizens )
This zip code:
16.4%Whole state:
13.1%
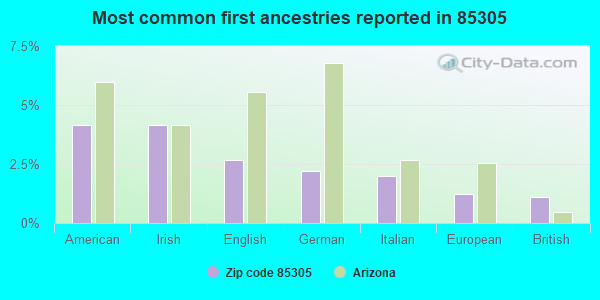
47% Honduras 9% Malaysia 9% Barbados 7% Thailand 4% Bhutan 3% Poland 3% Costa Rica 4% American 4% Irish 3% English 2% German 2% Italian 1% European 1% British
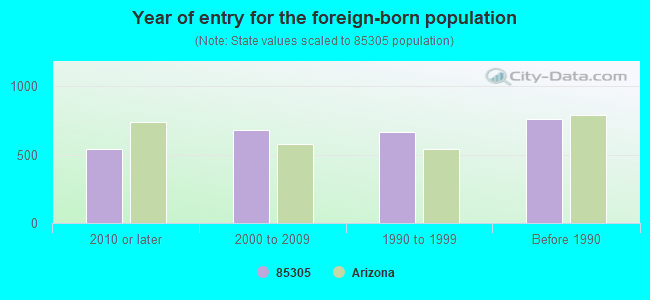
Year of entry for the foreign-born population
542 2010 or later 678 2000 to 2009 664 1990 to 1999 763 Before 1990
There are
22 Medical Specialists in Zip Code 85305 .
Facilities with environmental interests located in this zip code:
CAREER SUCCESS - GLENDALE (8632 W. NORTHERN AVENUE, BLDG. in GLENDALE, AZ)
(National Center for Education Statistics) - STATE ID-203 Organizations: CAREER SUCCESS SCHOOLS (SCHOOL DISTRICT)
DESERT MIRAGE ELEMENTARY SCHOOL (8605 W MARYLAND AVE in GLENDALE, AZ)
(National Center for Education Statistics) - STATE ID-017 Organizations: PENDERGAST ELEMENTARY DISTRICT (SCHOOL DISTRICT)
GLENDALE CITY OF (7403 N 91ST AVE in GLENDALE, AZ)
(Resource Conservation and Recovery Act (tracking hazardous waste)) Organizations: CITY OF GLENDALE (CONTACT/OPERATOR)
WALGREENS #5775 (8309 W GLENDALE AVE in GLENDALE, AZ)
(Resource Conservation and Recovery Act (tracking hazardous waste)) Business NAICS classification: ONE-HOUR PHOTOFINISHING.
GLENDALE ARENA (9400 W MARYLAND in GLENDALE, AZ)
(Resource Conservation and Recovery Act (tracking hazardous waste))
HICKMAN EGGS (7403 N 91ST AVE in GLENDALE, AZ)
National Pollutant Discharge Elimination System NON-MAJOR (Tracking pollutant discharge elimination systems) - permit Business SIC classification: CHICKEN EGGS
WALMART SUPERCENTER 3465 (5010 N 95TH PL in GLENDALE, AZ)
Conditionally Exempt Small Quantity Generators, less than 100 kg/month of hazardous waste (Resource Conservation and Recovery Act (tracking hazardous waste)) Organizations: PATRICK MINDER STORE MNGR (CONTACT/OPERATOR)
, WAL-MART STORES INC (CONTACT/OWNER)
Alternative names: WAL MART STORES INC DBA WALMART SUPERCEN
WEST VALLEY CHRISTIAN SCHOOL (6115 N 91ST AVE in GLENDALE, AZ)
COMPLIANCE ACTIVITY (Tracking inspections of insecticide, fungicide, and rodenticide, and toxic substances)
Housing units lacking complete plumbing facilities: 0.3%
Housing units lacking complete kitchen facilities: 0.7%
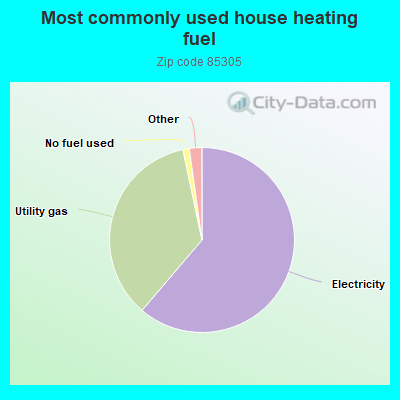
61.3% Electricity 35.5% Utility gas 1.1% No fuel used 0.6% Wood 0.6% Other fuel
Population in 1990: 1,424. Population change in the 1990s: +4,232 (+297.2%).
Place of birth for U.S.-born residents:
This state: 7,069Northeast: 541Midwest: 1,852South: 710West: 2,706
58% of the 85305 zip code residents lived in the same house 5 years ago.
Out of people who lived in different houses, 73% lived in this county.
Out of people who lived in different counties, 50% lived in Arizona.
86% of the 85305 zip code residents lived in the same house 1 year ago.
Out of people who lived in different houses, 61% moved from this county.
Out of people who lived in different houses, 3% moved from different county within same state.
Out of people who lived in different houses, 33% moved from different state.
Out of people who lived in different houses, 1% moved from abroad.
Private vs. public school enrollment:
Students in private schools in grades 1 to 8 (elementary and middle school): 115
Students in private schools in grades 9 to 12 (high school): 60
Students in private undergraduate colleges: 88
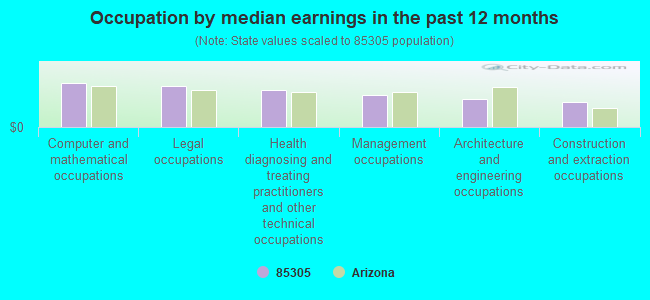
Occupation by median earnings in the past 12 months ($)
109,821 Computer and mathematical occupations 102,488 Legal occupations 91,359 Health diagnosing and treating practitioners and other technical occupations 78,850 Management occupations 69,801 Architecture and engineering occupations 62,105 Construction and extraction occupations
Companies with federal contracts located in this zip code:
ARENA MANAGEMENT GROUP, LLC (9400 W MARYLAND AVE in GLENDALE, AZ)
$12,500 with Air Force for Lease or Rental of Equipment -- Miscellaneous. Signed on 2005-09-12. Completion date: 2006-09-12.
DAVE'S DRILLING LLC (7415 N NEW RIVER RD in GLENDALE, AZ; small business) in 3 contracts from 2005 to 2006
$7,300 with Army for Lease or Rental of Equipment -- Construction, Mining, Excavating, and Highway Maintenance Equipment. Signed on 2005-11-09. Completion date: 2005-11-18.
, same as above. Signed on 2006-01-17. Completion date: 2006-01-20.
, same as above. Signed on 2006-03-31. Completion date: 2005-11-18.
Top industries in this zip code by the number of employees in 2005:
Accommodation and Food Services: Full-Service Restaurants (100-249 employees: 1 establishment, 50-99 employees: 1 establishment, 1-4 employees: 2 establishments)Information: Cable and Other Program Distribution (50-99: 1)Finance and Insurance: Investment Advice (20-49: 1)Health Care and Social Assistance: Home Health Care Services (20-49: 1)Construction: Site Preparation Contractors (20-49: 1)
People in group quarters in 2010:
10 people in group homes for juveniles (non-correctional)
6 people in workers' group living quarters and job corps centers
4 people in group homes intended for adults
2 people in residential treatment centers for adults
People in group quarters in 2000:
21 people in other noninstitutional group quarters
Fatal accident statistics in 2013:
Fatal accident count: 1Vehicles involved in fatal accidents: 2Fatal accidents caused by drunken drivers: 1Fatalities: 2Persons involved in fatal accidents: 4Pedestrians involved in fatal accidents: 0
Fatal accident statistics in 2012:
Fatal accident count: 4Vehicles involved in fatal accidents: 6Fatal accidents caused by drunken drivers: 3Fatalities: 4Persons involved in fatal accidents: 6Pedestrians involved in fatal accidents: 1
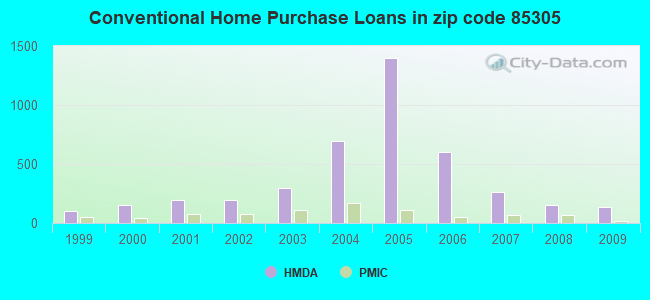
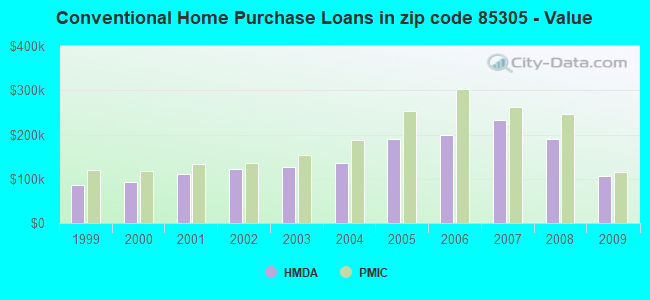
Home Mortgage Disclosure Act Aggregated Statistics For Year 2009(Based on 2 full and 2 partial tracts) A) FHA, FSA/RHS & VA B) Conventional C) Refinancings D) Home Improvement Loans E) Loans on Dwellings For 5+ Families F) Non-occupant Loans on G) Loans On Manufactured Number Average Value Number Average Value Number Average Value Number Average Value Number Average Value Number Average Value Number Average Value
LOANS ORIGINATED 254 $137,186 132 $107,204 187 $169,572 4 $62,412 0 $0 68 $102,557 0 $0 APPLICATIONS APPROVED, NOT ACCEPTED 14 $121,163 16 $112,622 34 $160,482 1 $8,540 0 $0 10 $85,914 2 $106,900 APPLICATIONS DENIED 62 $131,276 36 $116,658 170 $180,319 8 $72,628 0 $0 29 $125,023 4 $63,842 APPLICATIONS WITHDRAWN 29 $156,544 8 $111,159 61 $171,599 3 $60,433 2 $186,080 7 $143,989 0 $0 FILES CLOSED FOR INCOMPLETENESS 9 $149,962 4 $152,110 29 $186,925 1 $167,060 0 $0 2 $183,670 0 $0
Aggregated Statistics For Year 2008(Based on 2 full and 2 partial tracts) A) FHA, FSA/RHS & VA B) Conventional C) Refinancings D) Home Improvement Loans F) Non-occupant Loans on G) Loans On Manufactured Number Average Value Number Average Value Number Average Value Number Average Value Number Average Value Number Average Value
LOANS ORIGINATED 136 $180,688 153 $189,053 242 $187,604 36 $113,012 83 $181,210 3 $40,353 APPLICATIONS APPROVED, NOT ACCEPTED 5 $144,278 18 $218,308 48 $197,676 6 $137,002 12 $204,663 3 $91,710 APPLICATIONS DENIED 49 $180,834 78 $142,463 331 $225,641 62 $112,053 40 $215,600 31 $31,300 APPLICATIONS WITHDRAWN 13 $206,268 35 $309,095 86 $187,158 9 $130,054 6 $216,733 0 $0 FILES CLOSED FOR INCOMPLETENESS 4 $186,868 10 $215,832 22 $232,709 6 $126,752 0 $0 0 $0
Aggregated Statistics For Year 2007(Based on 2 full and 2 partial tracts) A) FHA, FSA/RHS & VA B) Conventional C) Refinancings D) Home Improvement Loans F) Non-occupant Loans on G) Loans On Manufactured Number Average Value Number Average Value Number Average Value Number Average Value Number Average Value Number Average Value
LOANS ORIGINATED 16 $215,816 266 $231,887 618 $205,603 80 $83,134 130 $226,384 2 $24,745 APPLICATIONS APPROVED, NOT ACCEPTED 2 $205,880 68 $196,290 151 $213,560 35 $85,569 26 $272,974 8 $78,441 APPLICATIONS DENIED 3 $150,923 118 $224,161 507 $240,058 97 $100,648 70 $251,931 14 $41,571 APPLICATIONS WITHDRAWN 0 $0 58 $256,301 217 $224,029 16 $165,259 23 $234,016 0 $0 FILES CLOSED FOR INCOMPLETENESS 0 $0 17 $207,962 76 $229,903 4 $134,282 10 $245,833 0 $0
Aggregated Statistics For Year 2006(Based on 2 full and 2 partial tracts) A) FHA, FSA/RHS & VA B) Conventional C) Refinancings D) Home Improvement Loans F) Non-occupant Loans on G) Loans On Manufactured Number Average Value Number Average Value Number Average Value Number Average Value Number Average Value Number Average Value
LOANS ORIGINATED 2 $235,400 603 $198,062 1,076 $207,664 166 $95,110 239 $196,862 8 $38,355 APPLICATIONS APPROVED, NOT ACCEPTED 0 $0 117 $197,267 193 $215,866 43 $94,171 36 $232,367 2 $134,785 APPLICATIONS DENIED 0 $0 287 $210,736 487 $214,574 115 $91,370 85 $229,668 10 $57,843 APPLICATIONS WITHDRAWN 1 $180,350 173 $182,320 316 $209,806 18 $153,456 45 $210,930 0 $0 FILES CLOSED FOR INCOMPLETENESS 0 $0 43 $232,547 144 $203,421 11 $115,192 8 $245,410 0 $0
Aggregated Statistics For Year 2005(Based on 2 full and 2 partial tracts) A) FHA, FSA/RHS & VA B) Conventional C) Refinancings D) Home Improvement Loans F) Non-occupant Loans on G) Loans On Manufactured Number Average Value Number Average Value Number Average Value Number Average Value Number Average Value Number Average Value
LOANS ORIGINATED 16 $180,304 1,401 $189,116 1,307 $168,413 163 $94,568 474 $175,052 4 $19,330 APPLICATIONS APPROVED, NOT ACCEPTED 0 $0 174 $189,328 160 $151,622 51 $57,062 58 $177,329 9 $87,310 APPLICATIONS DENIED 4 $180,515 314 $176,674 524 $166,453 137 $58,775 91 $167,869 31 $47,599 APPLICATIONS WITHDRAWN 2 $328,900 227 $189,870 318 $169,352 40 $122,806 58 $177,673 0 $0 FILES CLOSED FOR INCOMPLETENESS 0 $0 61 $163,625 156 $178,910 6 $50,712 13 $165,715 2 $67,305
Aggregated Statistics For Year 2004(Based on 2 full and 2 partial tracts) A) FHA, FSA/RHS & VA B) Conventional C) Refinancings D) Home Improvement Loans F) Non-occupant Loans on G) Loans On Manufactured Number Average Value Number Average Value Number Average Value Number Average Value Number Average Value Number Average Value
LOANS ORIGINATED 37 $144,386 691 $136,076 757 $126,614 67 $66,546 215 $114,630 4 $30,060 APPLICATIONS APPROVED, NOT ACCEPTED 0 $0 99 $134,585 161 $134,363 22 $100,797 16 $124,165 7 $100,421 APPLICATIONS DENIED 5 $152,658 144 $133,473 438 $125,763 85 $31,833 32 $152,051 25 $57,305 APPLICATIONS WITHDRAWN 1 $68,340 91 $146,571 305 $125,770 24 $96,707 29 $119,642 3 $141,470 FILES CLOSED FOR INCOMPLETENESS 0 $0 17 $137,998 86 $122,349 4 $47,510 16 $98,203 0 $0
Aggregated Statistics For Year 2003(Based on 2 full and 2 partial tracts) A) FHA, FSA/RHS & VA B) Conventional C) Refinancings D) Home Improvement Loans F) Non-occupant Loans on Number Average Value Number Average Value Number Average Value Number Average Value Number Average Value
LOANS ORIGINATED 100 $126,154 300 $127,419 1,318 $114,465 67 $26,946 92 $100,925 APPLICATIONS APPROVED, NOT ACCEPTED 4 $124,455 40 $120,402 195 $111,051 28 $32,991 4 $69,292 APPLICATIONS DENIED 15 $127,853 54 $116,773 537 $105,635 93 $24,894 21 $92,548 APPLICATIONS WITHDRAWN 9 $128,037 44 $130,133 418 $116,813 23 $30,520 9 $78,362 FILES CLOSED FOR INCOMPLETENESS 2 $123,725 14 $133,903 72 $121,716 4 $25,735 3 $98,820
Aggregated Statistics For Year 2002(Based on 2 partial tracts) A) FHA, FSA/RHS & VA B) Conventional C) Refinancings D) Home Improvement Loans F) Non-occupant Loans on Number Average Value Number Average Value Number Average Value Number Average Value Number Average Value
LOANS ORIGINATED 92 $128,555 194 $122,369 676 $106,605 42 $27,323 56 $95,462 APPLICATIONS APPROVED, NOT ACCEPTED 4 $121,498 19 $121,847 97 $107,631 9 $28,792 6 $93,970 APPLICATIONS DENIED 9 $102,513 47 $114,247 290 $99,100 55 $23,437 9 $73,932 APPLICATIONS WITHDRAWN 8 $106,191 27 $116,013 164 $117,226 6 $47,143 6 $80,840 FILES CLOSED FOR INCOMPLETENESS 1 $91,120 6 $101,248 42 $107,960 1 $10,440 2 $79,260
Aggregated Statistics For Year 2001(Based on 2 partial tracts) A) FHA, FSA/RHS & VA B) Conventional C) Refinancings D) Home Improvement Loans F) Non-occupant Loans on Number Average Value Number Average Value Number Average Value Number Average Value Number Average Value
LOANS ORIGINATED 117 $116,744 196 $110,417 518 $102,154 34 $17,560 49 $108,325 APPLICATIONS APPROVED, NOT ACCEPTED 3 $107,893 18 $92,863 93 $94,328 23 $25,340 6 $76,885 APPLICATIONS DENIED 13 $118,942 75 $64,381 315 $104,985 65 $21,890 10 $72,234 APPLICATIONS WITHDRAWN 9 $122,447 29 $126,407 123 $101,348 9 $37,862 2 $111,530 FILES CLOSED FOR INCOMPLETENESS 1 $93,970 4 $140,008 33 $107,145 3 $15,503 1 $59,800
Aggregated Statistics For Year 2000(Based on 2 partial tracts) A) FHA, FSA/RHS & VA B) Conventional C) Refinancings D) Home Improvement Loans F) Non-occupant Loans on Number Average Value Number Average Value Number Average Value Number Average Value Number Average Value
LOANS ORIGINATED 99 $107,499 155 $93,144 138 $73,584 70 $21,208 13 $84,698 APPLICATIONS APPROVED, NOT ACCEPTED 2 $98,715 34 $78,532 34 $85,707 44 $23,838 1 $11,390 APPLICATIONS DENIED 18 $109,316 105 $53,571 177 $64,808 101 $22,884 5 $73,658 APPLICATIONS WITHDRAWN 9 $110,846 34 $110,889 83 $73,317 10 $28,761 2 $129,565 FILES CLOSED FOR INCOMPLETENESS 4 $101,802 4 $129,803 30 $105,741 0 $0 0 $0
Aggregated Statistics For Year 1999(Based on 1 partial tract) A) FHA, FSA/RHS & VA B) Conventional C) Refinancings D) Home Improvement Loans E) Loans on Dwellings For 5+ Families F) Non-occupant Loans on Number Average Value Number Average Value Number Average Value Number Average Value Number Average Value Number Average Value
LOANS ORIGINATED 100 $114,676 103 $84,899 143 $78,279 47 $21,202 1 $104,000 7 $82,267 APPLICATIONS APPROVED, NOT ACCEPTED 4 $122,882 21 $73,520 37 $70,982 21 $23,480 0 $0 1 $61,050 APPLICATIONS DENIED 9 $115,668 44 $64,405 107 $65,990 67 $21,615 0 $0 4 $72,048 APPLICATIONS WITHDRAWN 9 $104,688 21 $87,194 51 $76,626 3 $47,430 0 $0 2 $86,405 FILES CLOSED FOR INCOMPLETENESS 1 $103,480 2 $98,305 22 $96,895 1 $21,210 0 $0 1 $49,670
Detailed HMDA statistics for the following Tracts:
0927.06
,
0927.10
Private Mortgage Insurance Companies Aggregated Statistics For Year 2009(Based on 2 full and 2 partial tracts) A) Conventional B) Refinancings C) Non-occupant Loans on Number Average Value Number Average Value Number Average Value
LOANS ORIGINATED 20 $114,553 1 $211,670 2 $87,800 APPLICATIONS APPROVED, NOT ACCEPTED 5 $227,618 1 $143,330 1 $77,830 APPLICATIONS DENIED 11 $131,942 1 $189,840 1 $189,840 APPLICATIONS WITHDRAWN 2 $160,415 0 $0 0 $0 FILES CLOSED FOR INCOMPLETENESS 2 $156,390 3 $257,233 1 $200,280
Aggregated Statistics For Year 2008(Based on 2 full and 2 partial tracts) A) Conventional B) Refinancings C) Non-occupant Loans on Number Average Value Number Average Value Number Average Value
LOANS ORIGINATED 68 $246,192 19 $205,702 8 $241,049 APPLICATIONS APPROVED, NOT ACCEPTED 25 $257,311 20 $294,300 1 $364,490 APPLICATIONS DENIED 4 $299,235 1 $359,750 2 $294,250 APPLICATIONS WITHDRAWN 3 $284,443 5 $259,590 2 $158,515 FILES CLOSED FOR INCOMPLETENESS 0 $0 0 $0 0 $0
Aggregated Statistics For Year 2007(Based on 2 full and 2 partial tracts) A) Conventional B) Refinancings C) Non-occupant Loans on Number Average Value Number Average Value Number Average Value
LOANS ORIGINATED 69 $261,679 49 $264,419 12 $280,891 APPLICATIONS APPROVED, NOT ACCEPTED 7 $242,996 11 $329,804 1 $329,370 APPLICATIONS DENIED 4 $276,930 4 $308,995 1 $356,900 APPLICATIONS WITHDRAWN 8 $230,912 2 $273,845 1 $329,370 FILES CLOSED FOR INCOMPLETENESS 3 $213,333 0 $0 0 $0
Aggregated Statistics For Year 2006(Based on 2 full and 2 partial tracts) A) Conventional B) Refinancings C) Non-occupant Loans on Number Average Value Number Average Value Number Average Value
LOANS ORIGINATED 55 $303,398 27 $285,317 16 $274,656 APPLICATIONS APPROVED, NOT ACCEPTED 7 $291,726 6 $250,918 2 $434,520 APPLICATIONS DENIED 0 $0 3 $320,697 2 $295,950 APPLICATIONS WITHDRAWN 0 $0 2 $267,245 0 $0 FILES CLOSED FOR INCOMPLETENESS 0 $0 2 $291,990 0 $0
Aggregated Statistics For Year 2005(Based on 2 full and 2 partial tracts) A) Conventional B) Refinancings C) Non-occupant Loans on Number Average Value Number Average Value Number Average Value
LOANS ORIGINATED 112 $252,886 53 $181,326 38 $210,813 APPLICATIONS APPROVED, NOT ACCEPTED 21 $230,807 16 $162,344 2 $169,905 APPLICATIONS DENIED 0 $0 2 $271,205 0 $0 APPLICATIONS WITHDRAWN 16 $223,927 7 $156,533 3 $210,123 FILES CLOSED FOR INCOMPLETENESS 0 $0 2 $116,795 0 $0
Aggregated Statistics For Year 2004(Based on 2 full and 2 partial tracts) A) Conventional B) Refinancings C) Non-occupant Loans on Number Average Value Number Average Value Number Average Value
LOANS ORIGINATED 168 $186,944 87 $147,239 42 $159,107 APPLICATIONS APPROVED, NOT ACCEPTED 17 $171,828 36 $133,120 9 $157,968 APPLICATIONS DENIED 7 $176,276 2 $121,745 2 $148,470 APPLICATIONS WITHDRAWN 16 $188,611 1 $162,310 3 $202,953 FILES CLOSED FOR INCOMPLETENESS 1 $116,750 1 $170,860 0 $0
Aggregated Statistics For Year 2003(Based on 2 full and 2 partial tracts) A) Conventional B) Refinancings C) Non-occupant Loans on Number Average Value Number Average Value Number Average Value
LOANS ORIGINATED 110 $154,624 194 $134,858 20 $118,426 APPLICATIONS APPROVED, NOT ACCEPTED 26 $180,748 67 $128,201 0 $0 APPLICATIONS DENIED 3 $198,383 4 $115,565 0 $0 APPLICATIONS WITHDRAWN 6 $192,023 11 $153,776 2 $110,105 FILES CLOSED FOR INCOMPLETENESS 0 $0 0 $0 0 $0
Aggregated Statistics For Year 2002(Based on 2 partial tracts) A) Conventional B) Refinancings C) Non-occupant Loans on Number Average Value Number Average Value Number Average Value
LOANS ORIGINATED 73 $134,864 98 $129,537 10 $104,697 APPLICATIONS APPROVED, NOT ACCEPTED 10 $172,565 21 $138,583 2 $102,040 APPLICATIONS DENIED 2 $200,280 3 $133,837 1 $105,360 APPLICATIONS WITHDRAWN 3 $117,067 6 $137,950 0 $0 FILES CLOSED FOR INCOMPLETENESS 0 $0 0 $0 0 $0
Aggregated Statistics For Year 2001(Based on 2 partial tracts) A) Conventional B) Refinancings C) Non-occupant Loans on Number Average Value Number Average Value Number Average Value
LOANS ORIGINATED 73 $134,370 81 $125,189 6 $86,218 APPLICATIONS APPROVED, NOT ACCEPTED 13 $130,917 17 $118,538 5 $111,056 APPLICATIONS DENIED 2 $99,665 6 $111,847 1 $99,670 APPLICATIONS WITHDRAWN 5 $176,552 1 $101,560 0 $0 FILES CLOSED FOR INCOMPLETENESS 1 $225,910 0 $0 0 $0
Aggregated Statistics For Year 2000(Based on 2 partial tracts) A) Conventional B) Refinancings C) Non-occupant Loans on Number Average Value Number Average Value Number Average Value
LOANS ORIGINATED 44 $116,665 11 $136,512 2 $58,375 APPLICATIONS APPROVED, NOT ACCEPTED 7 $127,871 9 $101,142 0 $0 APPLICATIONS DENIED 3 $169,907 0 $0 0 $0 APPLICATIONS WITHDRAWN 4 $173,940 1 $138,580 0 $0 FILES CLOSED FOR INCOMPLETENESS 1 $162,310 0 $0 0 $0
Aggregated Statistics For Year 1999(Based on 1 partial tract) A) Conventional B) Refinancings C) Non-occupant Loans on Number Average Value Number Average Value Number Average Value
LOANS ORIGINATED 53 $118,709 22 $105,385 2 $68,040 APPLICATIONS APPROVED, NOT ACCEPTED 4 $140,475 4 $93,132 1 $30,530 APPLICATIONS DENIED 7 $167,786 1 $58,470 0 $0 APPLICATIONS WITHDRAWN 5 $107,102 2 $81,230 0 $0 FILES CLOSED FOR INCOMPLETENESS 0 $0 1 $204,890 0 $0
Detailed PMIC statistics for the following Tracts:
0927.06
,
0927.10
Most common first names in zip code 85305 among deceased individuals Name Count Lived (average)
Mary 11 73.3 years Robert 7 65.9 years William 6 72.2 years John 6 78.7 years David 5 58.2 years Charles 5 66.0 years Nellie 4 82.8 years Donald 4 72.5 years James 4 69.7 years Frank 4 66.7 years
Most common last names in zip code 85305 among deceased individuals Last name Count Lived (average)
Ballesteros 2 76.0 years Kennow 2 56.5 years Fritchen 2 62.0 years Jamrozik 2 69.0 years Glover 2 70.5 years Johnson 2 67.6 years Burtis 2 72.0 years Edwards 2 63.5 years Cole 2 82.5 years Delamont 2 74.5 years
Businesses in zip code 85305
Name Count Name Count
Applebee's 1 Marriott 3 Burger King 1 McDonald's 1 Cold Stone Creamery 1 New Balance 1 Comfort Suites 1 OfficeMax 1 Cracker Barrel 1 Payless 2 Dennys 1 Quiznos 1 DressBarn 1 Skechers USA 1 Dressbarn 2 Sprint Nextel 1 Famous Footwear 1 Subway 1 FedEx 4 T-Mobile 2 GNC 1 Taco Bell 1 GameStop 1 Target 1 Hilton 1 Toys"R"Us 1 Holiday Inn 2 UPS 2 Johnny Rockets 1 Verizon Wireless 2 Justice 1 Village Inn 1 Kohl's 1 Walmart 1 Long John Silver's 1
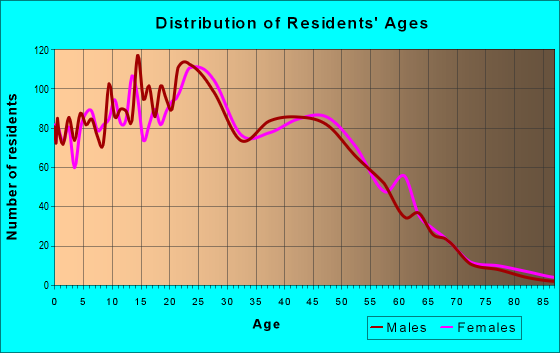
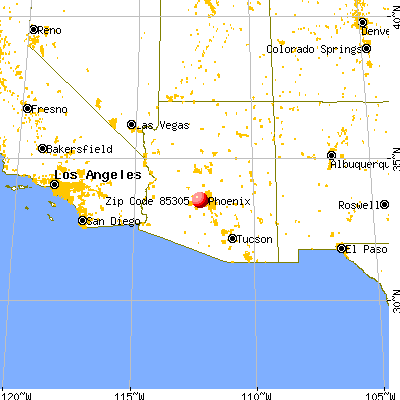


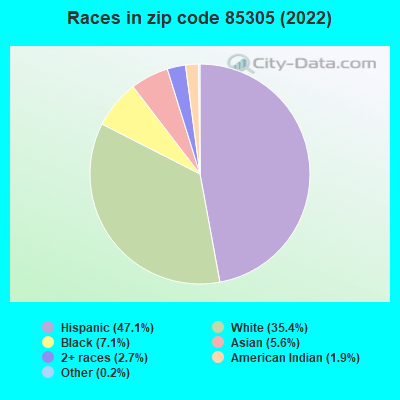


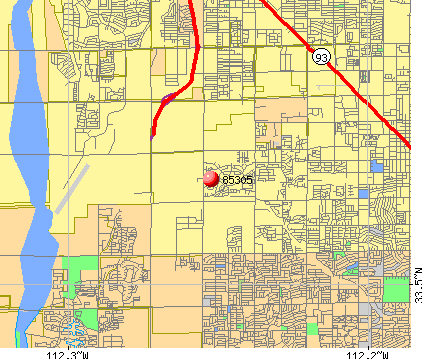 Nearest zip codes: 85303, 85345, 85037, 85307, 85033, 85363.