Estimated zip code population in 2022: 37,109 Zip code population in 2010: 26,262 Zip code population in 2000: 7,053
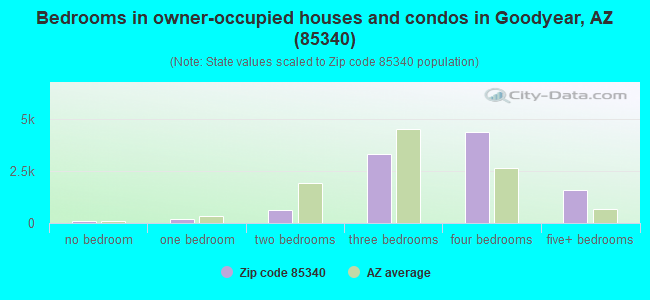
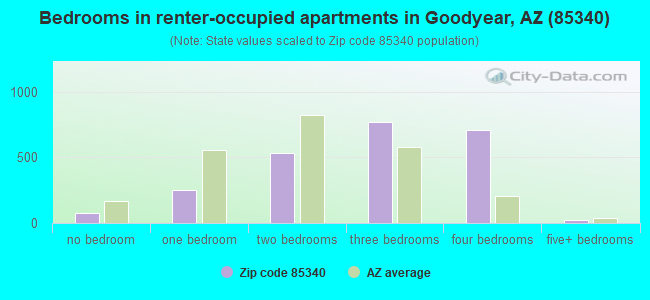
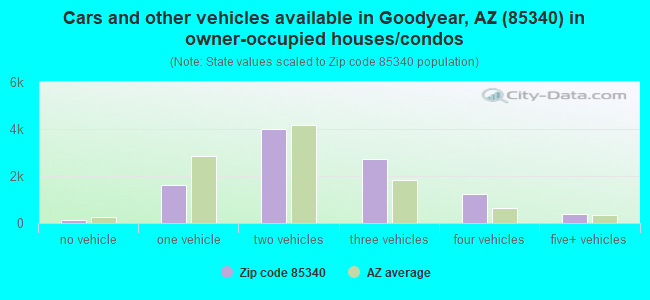
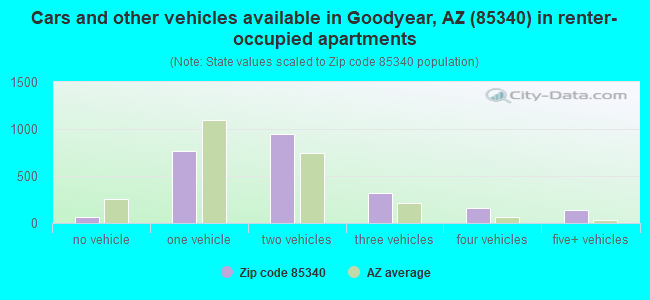
Houses and condos: 12,799 Renter-occupied apartments: 2,342
% of renters here:
19%
State:
33%
March 2022 cost of living index in zip code 85340: 101.2 (near average, U.S. average is 100)
Land area: 30.2 sq. mi. Water area: 0.1 sq. mi.
Population density: 1,227 people per square mile
(low).
OSM Map
General Map
Google Map
MSN Map
OSM Map
General Map
Google Map
MSN Map
OSM Map
General Map
Google Map
MSN Map
OSM Map
General Map
Google Map
MSN Map
Please wait while loading the map...
Real estate property taxes paid for housing units in 2022:
This zip code:
0.4% ($2,254)
Arizona:
0.4% ($1,786)
Median real estate property taxes paid for housing units with mortgages in 2022: $2,178 (0.4%) Median real estate property taxes paid for housing units with no mortgage in 2022: $2,577 (0.5%)
Estimated median house/condo value in 2022: $563,469
85340:
$563,469
Arizona:
$402,800
According to our research of Arizona and other state lists, there were 15 registered sex offenders living in 85340 zip code as of April 23, 2024. The ratio of all residents to sex offenders in zip code 85340 is 2,080 to 1. The ratio of registered sex offenders to all residents in this zip code is much lower than the state average.
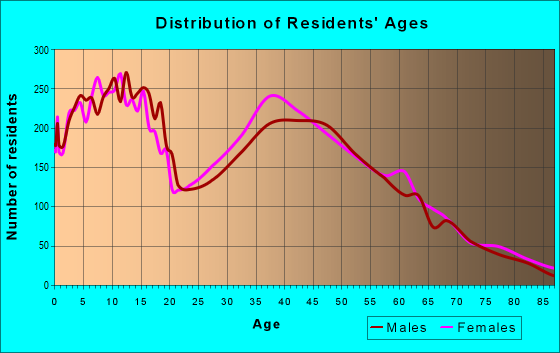
Median resident age:
This zip code:
38.8 years
Arizona median age:
38.8 years
Average household size:
This zip code:
3.0 people
Arizona:
2.5 people
Averages for the 2020 tax year for zip code 85340, filed in 2021:
Average Adjusted Gross Income (AGI) in 2020: $89,547 (Individual Income Tax Returns)
Here:
$89,547
State:
$73,499
Salary/wage: $74,280 (reported on 83.0% of returns)
Here:
$74,280
State:
$59,499
(% of AGI for various income ranges: 1210.6% for AGIs below $25k, 3685.4% for AGIs $25k-50k, 6891.6% for AGIs $50k-75k, 10147.2% for AGIs $75k-100k, 20050.1% for AGIs $100k-200k, 67362.2% for AGIs over 200k)
Taxable interest for individuals: $2,052 (reported on 27.2% of returns)
This zip code:
$2,052
Arizona:
$2,325
(% of AGI for various income ranges: 14.9% for AGIs below $25k, 18.7% for AGIs $25k-50k, 34.0% for AGIs $50k-75k, 54.1% for AGIs $75k-100k, 125.8% for AGIs $100k-200k, 1098.9% for AGIs over 200k)
Ordinary dividends: $6,667 (reported on 18.2% of returns)
Here:
$6,667
State:
$8,711
(% of AGI for various income ranges: 23.9% for AGIs below $25k, 48.0% for AGIs $25k-50k, 67.7% for AGIs $50k-75k, 133.5% for AGIs $75k-100k, 263.6% for AGIs $100k-200k, 2432.0% for AGIs over 200k)
Net capital gain/loss in AGI: +$25,366 (reported on 18.6% of returns)
Here:
+$25,366
State:
+$31,332
(% of AGI for various income ranges: 11.1% for AGIs below $25k, 39.6% for AGIs $25k-50k, 62.4% for AGIs $50k-75k, 189.0% for AGIs $75k-100k, 597.3% for AGIs $100k-200k, 14278.7% for AGIs over 200k)
Profit/loss from business: +$15,441 (reported on 18.0% of returns)
Here:
+$15,441
State:
+$13,214
(% of AGI for various income ranges: 104.1% for AGIs below $25k, 182.6% for AGIs $25k-50k, 268.9% for AGIs $50k-75k, 292.8% for AGIs $75k-100k, 705.5% for AGIs $100k-200k, 3995.6% for AGIs over 200k)
Taxable individual retirement arrangement distribution: $25,147 (reported on 7.9% of returns)
85340:
$25,147
Arizona:
$23,364
(% of AGI for various income ranges: 33.8% for AGIs below $25k, 96.5% for AGIs $25k-50k, 203.5% for AGIs $50k-75k, 275.1% for AGIs $75k-100k, 743.0% for AGIs $100k-200k, 2172.7% for AGIs over 200k)
Self-employed (Keogh) retirement plans: $23,586 (reported on 0.4% of returns)
85340:
$23,586
Arizona:
$26,938
(% of AGI for various income ranges: 20.8% for AGIs $100k-200k, 282.0% for AGIs over 200k)
Total itemized deductions: $32,904 (reported on 14.4% of returns)
Here:
$32,904
State:
$36,308
(% of AGI for various income ranges: 49.4% for AGIs below $25k, 187.7% for AGIs $25k-50k, 476.8% for AGIs $50k-75k, 757.2% for AGIs $75k-100k, 1506.6% for AGIs $100k-200k, 6497.3% for AGIs over 200k)
Charity contributions: $8,195 (reported on 12.4% of returns)
Here:
$8,195
State:
$11,955
(% of AGI for various income ranges: 3.6% for AGIs below $25k, 22.8% for AGIs $25k-50k, 74.4% for AGIs $50k-75k, 102.8% for AGIs $75k-100k, 317.4% for AGIs $100k-200k, 1826.2% for AGIs over 200k)
Taxes paid: $7,245 (reported on 14.4% of returns)
85340:
$7,245
State:
$6,820
(% of AGI for various income ranges: 7.1% for AGIs below $25k, 27.6% for AGIs $25k-50k, 84.3% for AGIs $50k-75k, 160.0% for AGIs $75k-100k, 366.5% for AGIs $100k-200k, 1490.7% for AGIs over 200k)
Earned income credit: $2,281 (reported on 11.5% of returns)
Here:
$2,281
State:
$2,383
(% of AGI for various income ranges: 78.3% for AGIs below $25k, 69.4% for AGIs $25k-50k, 1.5% for AGIs $50k-75k)
Percentage of individuals using paid preparers for their 2020 taxes: 93.4%
Here:
93%
State:
93%
(% for various income ranges: 92.6% for AGIs below $25k, 93.9% for AGIs $25k-50k, 92.9% for AGIs $50k-75k, 91.7% for AGIs $75k-100k, 94.4% for AGIs $100k-200k, 94.9% for AGIs over 200k)
Averages for the 2012 tax year for zip code 85340, filed in 2013:
Average Adjusted Gross Income (AGI) in 2012: $73,387 (Individual Income Tax Returns)
Here:
$73,387
State:
$57,644
Salary/wage: $62,160 (reported on 85.2% of returns)
Here:
$62,160
State:
$47,932
(% of AGI for various income ranges: 75.5% for AGIs below $25k, 81.4% for AGIs $25k-50k, 78.5% for AGIs $50k-75k, 78.6% for AGIs $75k-100k, 77.6% for AGIs $100k-200k, 50.9% for AGIs over 200k)
Taxable interest for individuals: $2,294 (reported on 32.4% of returns)
This zip code:
$2,294
Arizona:
$2,064
(% of AGI for various income ranges: 1.3% for AGIs below $25k, 0.5% for AGIs $25k-50k, 0.6% for AGIs $50k-75k, 0.5% for AGIs $75k-100k, 0.6% for AGIs $100k-200k, 2.4% for AGIs over 200k)
Ordinary dividends: $4,826 (reported on 19.1% of returns)
Here:
$4,826
State:
$7,268
(% of AGI for various income ranges: 1.7% for AGIs below $25k, 1.1% for AGIs $25k-50k, 0.9% for AGIs $50k-75k, 0.9% for AGIs $75k-100k, 1.0% for AGIs $100k-200k, 2.1% for AGIs over 200k)
Net capital gain/loss in AGI: +$19,812 (reported on 17.3% of returns)
Here:
+$19,812
State:
+$15,530
(% of AGI for various income ranges: 0.2% for AGIs $50k-75k, 0.4% for AGIs $75k-100k, 1.2% for AGIs $100k-200k, 18.7% for AGIs over 200k)
Profit/loss from business: +$12,568 (reported on 17.0% of returns)
Here:
+$12,568
State:
+$12,323
(% of AGI for various income ranges: 9.3% for AGIs below $25k, 2.7% for AGIs $25k-50k, 3.4% for AGIs $50k-75k, 2.4% for AGIs $75k-100k, 2.6% for AGIs $100k-200k, 2.3% for AGIs over 200k)
Taxable individual retirement arrangement distribution: $19,817 (reported on 9.8% of returns)
85340:
$19,817
Arizona:
$18,280
(% of AGI for various income ranges: 2.6% for AGIs below $25k, 2.2% for AGIs $25k-50k, 2.7% for AGIs $50k-75k, 2.7% for AGIs $75k-100k, 3.0% for AGIs $100k-200k, 2.2% for AGIs over 200k)
Self-employment retirement plans: $22,075 (reported on 0.3% of returns)
85340:
$22,075
Arizona:
$22,154
Total itemized deductions: $23,514 (20% of AGI, reported on 44.7% of returns)
Here:
$23,514
State:
$23,651
Here:
20.2% of AGI
State:
20.6% of AGI
(% of AGI for various income ranges: 12.9% for AGIs below $25k, 13.4% for AGIs $25k-50k, 15.3% for AGIs $50k-75k, 16.2% for AGIs $75k-100k, 15.9% for AGIs $100k-200k, 10.8% for AGIs over 200k)
Charity contributions: $4,036 (reported on 38.2% of returns)
Here:
$4,036
State:
$4,114
(% of AGI for various income ranges: 1.0% for AGIs below $25k, 1.4% for AGIs $25k-50k, 1.8% for AGIs $50k-75k, 2.3% for AGIs $75k-100k, 2.4% for AGIs $100k-200k, 2.3% for AGIs over 200k)
Taxes paid: $6,083 (reported on 44.6% of returns)
85340:
$6,083
State:
$6,509
(% of AGI for various income ranges: 2.0% for AGIs below $25k, 2.3% for AGIs $25k-50k, 3.2% for AGIs $50k-75k, 3.6% for AGIs $75k-100k, 4.4% for AGIs $100k-200k, 4.0% for AGIs over 200k)
Earned income credit: $2,348 (reported on 14.9% of returns)
Here:
$2,348
State:
$2,432
(% of AGI for various income ranges: 7.1% for AGIs below $25k, 1.3% for AGIs $25k-50k)
Percentage of individuals using paid preparers for their 2012 taxes: 52.5%
Here:
53%
State:
52%
(% for various income ranges: 47.0% for AGIs below $25k, 49.2% for AGIs $25k-50k, 54.6% for AGIs $50k-75k, 54.2% for AGIs $75k-100k, 58.0% for AGIs $100k-200k, 69.4% for AGIs over 200k)
Averages for the 2004 tax year for zip code 85340, filed in 2005:
Average Adjusted Gross Income (AGI) in 2004: $64,816 (Individual Income Tax Returns)
Here:
$64,816
State:
$50,097
Salary/wage: $55,704 (reported on 87.7% of returns)
Here:
$55,704
State:
$42,146
(% of AGI for various income ranges: 287.9% for AGIs below $10k, 82.2% for AGIs $10k-25k, 85.4% for AGIs $25k-50k, 85.0% for AGIs $50k-75k, 83.7% for AGIs $75k-100k, 64.0% for AGIs over 100k)
Taxable interest for individuals: $2,020 (reported on 45.1% of returns)
This zip code:
$2,020
Arizona:
$2,374
(% of AGI for various income ranges: 22.8% for AGIs below $10k, 1.6% for AGIs $10k-25k, 0.8% for AGIs $25k-50k, 0.8% for AGIs $50k-75k, 0.6% for AGIs $75k-100k, 1.9% for AGIs over 100k)
Taxable dividends: $3,077 (reported on 23.1% of returns)
Here:
$3,077
State:
$3,888
(% of AGI for various income ranges: 10.4% for AGIs below $10k, 1.2% for AGIs $10k-25k, 0.6% for AGIs $25k-50k, 0.8% for AGIs $50k-75k, 0.9% for AGIs $75k-100k, 1.4% for AGIs over 100k)
Net capital gain/loss: +$22,814 (reported on 21.2% of returns)
Here:
+$22,814
State:
+$17,569
(% of AGI for various income ranges: 8.3% for AGIs below $10k, 1.1% for AGIs $10k-25k, 0.6% for AGIs $25k-50k, 0.9% for AGIs $50k-75k, 2.0% for AGIs $75k-100k, 14.3% for AGIs over 100k)
Profit/loss from business: +$11,596 (reported on 16.2% of returns)
Here:
+$11,596
State:
+$11,088
(% of AGI for various income ranges: -32.2% for AGIs below $10k, 6.2% for AGIs $10k-25k, 3.3% for AGIs $25k-50k, 2.1% for AGIs $50k-75k, 2.7% for AGIs $75k-100k, 3.1% for AGIs over 100k)
IRA payment deduction: $3,159 (reported on 2.4% of returns)
85340:
$3,159
Arizona:
$3,023
(% of AGI for various income ranges: 0.1% for AGIs $10k-25k, 0.2% for AGIs $25k-50k, 0.1% for AGIs $50k-75k, 0.1% for AGIs $75k-100k, 0.1% for AGIs over 100k)
Self-employed pension: $14,273 (reported on 0.8% of returns)
Here:
$14,273
Arizona:
$15,785
Total itemized deductions: $21,430 (23% of AGI, reported on 56.6% of returns)
Here:
$21,430
State:
$19,781
Here:
23.0% of AGI
State:
21.8% of AGI
(% of AGI for various income ranges: 64.2% for AGIs below $10k, 17.3% for AGIs $10k-25k, 21.9% for AGIs $25k-50k, 21.6% for AGIs $50k-75k, 19.7% for AGIs $75k-100k, 16.2% for AGIs over 100k)
Charity contributions deductions: $3,715 (4% of AGI, reported on 49.8% of returns)
Here:
$3,715
State:
$3,389
Here:
3.8% of AGI
State:
3.5% of AGI
(% of AGI for various income ranges: 2.8% for AGIs below $10k, 1.3% for AGIs $10k-25k, 2.2% for AGIs $25k-50k, 2.6% for AGIs $50k-75k, 2.4% for AGIs $75k-100k, 3.5% for AGIs over 100k)
Total tax: $9,698 (reported on 80.3% of returns)
85340:
$9,698
State:
$8,323
(% of AGI for various income ranges: 10.0% for AGIs below $10k, 4.1% for AGIs $10k-25k, 6.0% for AGIs $25k-50k, 7.5% for AGIs $50k-75k, 9.5% for AGIs $75k-100k, 16.9% for AGIs over 100k)
Earned income credit: $1,790 (reported on 11.0% of returns)
Here:
$1,790
State:
$1,786
Percentage of individuals using paid preparers for their 2004 taxes: 59.7%
Here:
60%
State:
60%
(% for various income ranges: 51.9% for AGIs below $10k, 61.4% for AGIs $10k-25k, 59.5% for AGIs $25k-50k, 59.0% for AGIs $50k-75k, 59.0% for AGIs $75k-100k, 65.6% for AGIs over 100k)
Likely homosexual households (counted as self-reported same-sex unmarried-partner households)
Lesbian couples: 0.3% of all households
Gay men: 0.0% of all households
Household received Food Stamps/SNAP in the past 12 months: 747 Household did not receive Food Stamps/SNAP in the past 12 months: 11,585
Women who had a birth in the past 12 months: 495 (387 now married, 112 unmarried) Women who did not have a birth in the past 12 months: 8,473 (4,039 now married, 4,409 unmarried)
Housing units in zip code 85340 with a mortgage: 7,675 (632 second mortgage, 26 home equity loan, 454 both second mortgage and home equity loan) Houses without a mortgage: 45
Median monthly owner costs for units with a mortgage: $2,016 Median monthly owner costs for units without a mortgage: $657
Residents with income below the poverty level in 2022:
This zip code:
7.7%
Whole state:
12.5%
Residents with income below 50% of the poverty level in 2022:
This zip code:
3.5%
Whole state:
6.0%
Median number of rooms in houses and condos:
Here:
6.9
State:
6.0
Median number of rooms in apartments:
Here:
5.5
State:
4.1
Notable locations in this zip code not listed on our city pages
Notable locations in zip code 85340: Griggs (A), Litchfield Substation (B), Wigwam Country Club (C), White Tanks Proving Grounds (D), Wildlife World Zoo (E), El Mirage Land Reclamation Facility (F), Maricopa County Library District Litchfield Park Branch (G), Rural / Metro Fire Department Station 833 (H), Buckeye Fire Department Station 703 (I). Display/hide their locations on the map
Churches in zip code 85340 include: Church of Jesus Christ (A), The Church at Litchfield Park (B), Pathway Bible Church (C), Litchfield Park First Baptist Church (D), Kingdom in the Valley Christian Church (E), Trinity Lutheran Church (F), Saint Peters Episcopal Church (G). Display/hide their locations on the map
6,815 married couples with children.
1,780 single-parent households (882 men, 898 women).
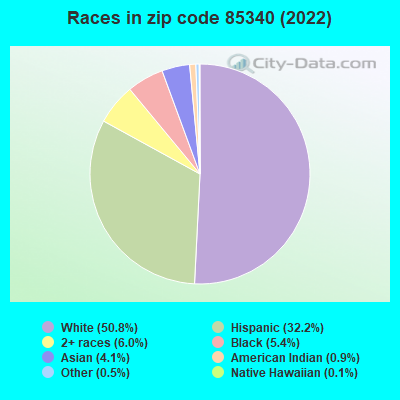
80.0% of residents of 85340 zip code speak English at home.
14.6% of residents speak Spanish at home (78% very well, 12% well, 7% not well, 3% not at all).
2.1% of residents speak other Indo-European language at home (92% very well, 8% well).
2.0% of residents speak Asian or Pacific Island language at home (50% very well, 31% well, 18% not well).
0.9% of residents speak other language at home (53% very well, 30% well, 13% not well, 4% not at all).
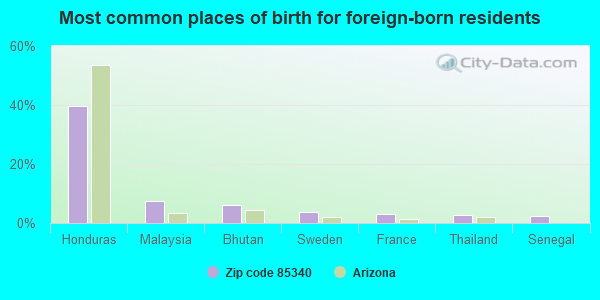
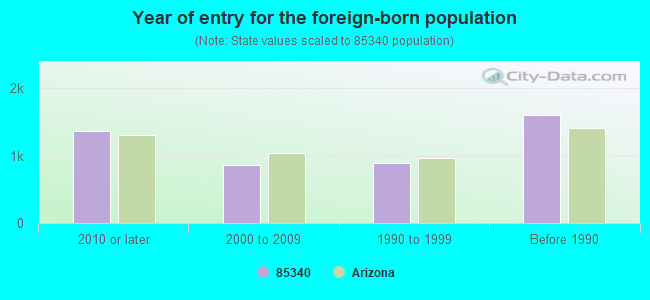
Foreign born population: 4,362 (11.8%) (55.3% of them are naturalized citizens)
This zip code:
11.8%
Whole state:
13.1%
40%Honduras
8%Malaysia
6%Bhutan
4%Sweden
3%France
3%Thailand
2%Senegal
11%American
8%German
5%English
3%Irish
3%Italian
3%European
3%Polish
Year of entry for the foreign-born population
1,3712010 or later
8572000 to 2009
8881990 to 1999
1,605Before 1990
Facilities with environmental interests located in this zip code:
WHITE TANKS LEARNING CENTER (553 PLAZA CIRCLE in LITCHFIELD PARK, AZ)
(National Center for Education Statistics) - STATE ID-106 Organizations: LITCHFIELD ELEMENTARY DISTRICT (SCHOOL DISTRICT)
WIGWAM CREEK MIDDLE SCHOOL (4510 N. 127TH AVE. in LITCHFIELD PARK, AZ)
(National Center for Education Statistics) - STATE ID-107 Organizations: LITCHFIELD ELEMENTARY DISTRICT (SCHOOL DISTRICT)
WILBUR ELLIS CO (COTTON LN QUARTER MI N in LITCHFIELD PARK, AZ)
(Resource Conservation and Recovery Act (tracking hazardous waste)) Organizations: ATCHISON TOPEKA & SANTA FE RAILWAY CO (CONTACT/OWNER)
EL MIRAGE TRAP & SKEET (SW CRNR EL MIRAGE & CAMELBACK in LITCHFIELD PARK, AZ)
(Resource Conservation and Recovery Act (tracking hazardous waste)) Organizations: SUNCOR DEVELOPMENT CO (CONTACT/OWNER)
OLD MARSH AVIATION (14702 W INDIAN SCHOOL RD in LITCHFIELD PARK, AZ)
(Resource Conservation and Recovery Act (tracking hazardous waste)) Organizations: GOODYEAR TIRE AND RUBBER CO (CONTACT/OWNER)
CATERPILLAR INC PROVING GROUND (195TH AVE & W INDIAN SCHOOL RD in LITCHFIELD PARK, AZ)
Small Quantity Generators, between 100 kg and 1000 kg of hazardous waste/month (Resource Conservation and Recovery Act (tracking hazardous waste)) - notification
WIGWAM RESORT (300 E INDIAN SCHOOL RD in LITCHFIELD PARK, AZ)
Conditionally Exempt Small Quantity Generators, less than 100 kg/month of hazardous waste (Resource Conservation and Recovery Act (tracking hazardous waste)) - notification Organizations: SUNCOR (CONTACT/OWNER)
HANSON AGGREGATES ARIZONA INC (5159 N EL MIRAGE in LITCHFIELD PARK, AZ)
ENFORCEMENT/COMPLIANCE ACTIVITY (Integrated Compliance Information System) TRI REPORTER (Tracking of toxic chemicals releasing facilities) Business SIC classification: READY-MIXED CONCRETE
GOODYEAR AEROSPACE CORP (101 S LITCHFIELD RD in LITCHFIELD PARK, AZ)
SUPERFUND (Superfund database) Alternative names: LITCHFIELD ARPT INDUSTRIAL AREA
Housing units lacking complete plumbing facilities: 0.6% Housing units lacking complete kitchen facilities: 0.5%
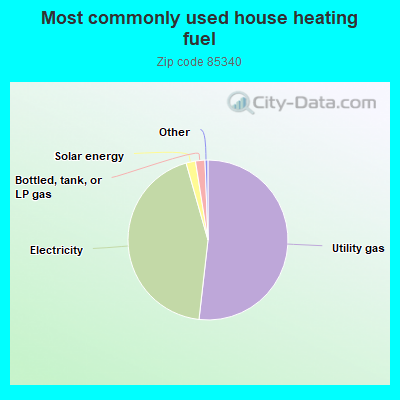
51.8%Utility gas
43.8%Electricity
1.9%Solar energy
1.9%Bottled, tank, or LP gas
Population in 1990: 6,349. Population change in the 1990s: +704 (+11.1%).
Place of birth for U.S.-born residents:
This state: 15,877
Northeast: 1,721
Midwest: 5,214
South: 2,563
West: 7,042
50% of the 85340 zip code residents lived in the same house 5 years ago. Out of people who lived in different houses, 69% lived in this county. Out of people who lived in different counties, 50% lived in Arizona.
89% of the 85340 zip code residents lived in the same house 1 year ago. Out of people who lived in different houses, 59% moved from this county. Out of people who lived in different houses, 2% moved from different county within same state. Out of people who lived in different houses, 39% moved from different state. Out of people who lived in different houses, 2% moved from abroad.
Private vs. public school enrollment:
Students in private schools in grades 1 to 8 (elementary and middle school): 573
Here:
15.3%
Arizona:
10.4%
Students in private schools in grades 9 to 12 (high school): 244
Here:
8.5%
Arizona:
8.8%
Students in private undergraduate colleges: 312
Here:
17.9%
Arizona:
13.1%
Occupation by median earnings in the past 12 months ($)
94,157Management occupations
92,524Health diagnosing and treating practitioners and other technical occupations
91,046Fire fighting and prevention, and other protective service workers including supervisors
90,775Law enforcement workers including supervisors
86,251Business and financial operations occupations
86,229Architecture and engineering occupations
Top industries in this zip code by the number of employees in 2005:
Accommodation and Food Services: Hotels (except Casino Hotels) and Motels (250-499 employees: 1 establishment)
Administrative and Support and Waste Management and Remediation Services: Employment Placement Agencies (100-249: 1)
Other Services (except Public Administration): Religious Organizations (50-99: 1, 20-49: 1, 10-19: 1, 5-9: 1, 1-4: 4)
Arts, Entertainment, and Recreation: Golf Courses and Country Clubs (50-99: 1, 20-49: 1)
Health Care and Social Assistance: Offices of Dentists (10-19: 4, 5-9: 4, 1-4: 4)
Administrative and Support and Waste Management and Remediation Services: Landscaping Services (20-49: 1, 10-19: 2, 5-9: 2, 1-4: 5)
Construction: All Other Specialty Trade Contractors (50-99: 1, 10-19: 1)
Mining: Construction Sand and Gravel Mining (50-99: 1)
People in group quarters in 2010:
41 people in nursing facilities/skilled-nursing facilities
13 people in group homes intended for adults
People in group quarters in 2000:
30 people in other noninstitutional group quarters
Fatal accident statistics in 2013:
Fatal accident count: 2
Vehicles involved in fatal accidents: 3
Fatal accidents caused by drunken drivers: 1
Fatalities: 2
Persons involved in fatal accidents: 8
Pedestrians involved in fatal accidents: 0
Fatal accident statistics in 2012:
Fatal accident count: 1
Vehicles involved in fatal accidents: 2
Fatal accidents caused by drunken drivers: 1
Fatalities: 1
Persons involved in fatal accidents: 2
Pedestrians involved in fatal accidents: 0
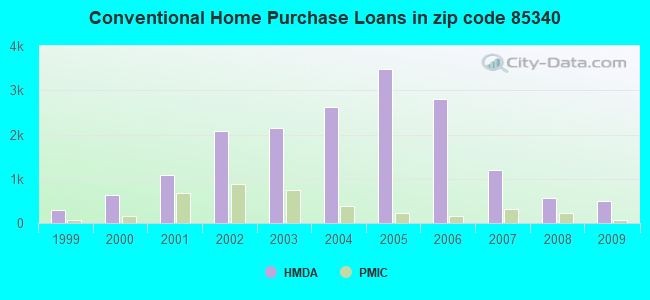
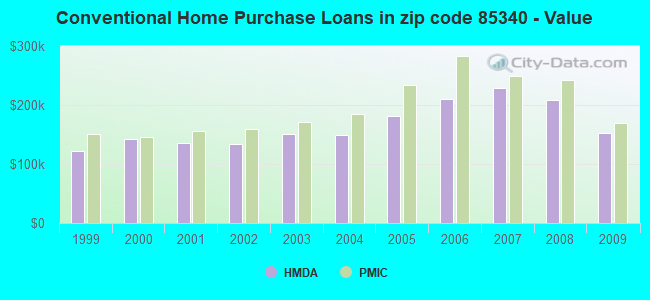
Home Mortgage Disclosure Act Aggregated Statistics For Year 2009 (Based on 6 partial tracts)
A) FHA, FSA/RHS & VA Home Purchase Loans
B) Conventional Home Purchase Loans
C) Refinancings
D) Home Improvement Loans
F) Non-occupant Loans on < 5 Family Dwellings (A B C & D)
G) Loans On Manufactured Home Dwelling (A B C & D)
Number
Average Value
Number
Average Value
Number
Average Value
Number
Average Value
Number
Average Value
Number
Average Value
LOANS ORIGINATED
758
$159,638
508
$152,675
838
$196,477
25
$88,524
261
$131,789
7
$103,816
APPLICATIONS APPROVED, NOT ACCEPTED
48
$193,740
50
$173,446
116
$205,954
10
$35,429
25
$133,748
7
$91,119
APPLICATIONS DENIED
123
$176,873
109
$174,124
421
$222,977
31
$65,731
63
$139,102
8
$106,246
APPLICATIONS WITHDRAWN
105
$164,631
52
$158,316
184
$211,561
15
$72,399
35
$136,121
2
$196,985
FILES CLOSED FOR INCOMPLETENESS
22
$169,690
14
$186,787
62
$217,909
10
$110,948
9
$100,904
1
$185,680
Aggregated Statistics For Year 2008 (Based on 6 partial tracts)
A) FHA, FSA/RHS & VA Home Purchase Loans
B) Conventional Home Purchase Loans
C) Refinancings
D) Home Improvement Loans
F) Non-occupant Loans on < 5 Family Dwellings (A B C & D)
G) Loans On Manufactured Home Dwelling (A B C & D)
Number
Average Value
Number
Average Value
Number
Average Value
Number
Average Value
Number
Average Value
Number
Average Value
LOANS ORIGINATED
615
$191,261
561
$207,728
633
$224,204
62
$56,951
207
$162,066
13
$131,433
APPLICATIONS APPROVED, NOT ACCEPTED
54
$226,258
114
$223,207
154
$226,763
30
$47,153
22
$225,082
9
$92,570
APPLICATIONS DENIED
126
$204,779
156
$238,403
642
$247,988
120
$97,063
81
$204,067
17
$126,851
APPLICATIONS WITHDRAWN
73
$200,225
89
$245,479
189
$234,538
22
$95,855
43
$187,753
2
$137,125
FILES CLOSED FOR INCOMPLETENESS
15
$185,239
19
$240,831
82
$278,009
11
$223,589
8
$198,472
1
$107,500
Aggregated Statistics For Year 2007 (Based on 6 partial tracts)
A) FHA, FSA/RHS & VA Home Purchase Loans
B) Conventional Home Purchase Loans
C) Refinancings
D) Home Improvement Loans
F) Non-occupant Loans on < 5 Family Dwellings (A B C & D)
G) Loans On Manufactured Home Dwelling (A B C & D)
Number
Average Value
Number
Average Value
Number
Average Value
Number
Average Value
Number
Average Value
Number
Average Value
LOANS ORIGINATED
102
$237,034
1,193
$229,123
1,545
$233,737
207
$95,959
436
$222,322
27
$108,790
APPLICATIONS APPROVED, NOT ACCEPTED
8
$226,301
281
$232,523
431
$254,907
94
$102,265
100
$226,996
4
$80,472
APPLICATIONS DENIED
11
$255,525
427
$247,020
1,245
$260,682
236
$110,542
216
$247,938
25
$118,092
APPLICATIONS WITHDRAWN
13
$229,342
185
$256,872
469
$240,599
46
$148,457
80
$214,526
2
$174,995
FILES CLOSED FOR INCOMPLETENESS
1
$186,970
43
$242,908
260
$266,975
15
$173,617
31
$236,648
1
$180,800
Aggregated Statistics For Year 2006 (Based on 6 partial tracts)
A) FHA, FSA/RHS & VA Home Purchase Loans
B) Conventional Home Purchase Loans
C) Refinancings
D) Home Improvement Loans
E) Loans on Dwellings For 5+ Families
F) Non-occupant Loans on < 5 Family Dwellings (A B C & D)
G) Loans On Manufactured Home Dwelling (A B C & D)
Number
Average Value
Number
Average Value
Number
Average Value
Number
Average Value
Number
Average Value
Number
Average Value
Number
Average Value
LOANS ORIGINATED
52
$244,851
2,802
$210,032
2,567
$232,714
360
$113,463
0
$0
848
$203,206
33
$102,712
APPLICATIONS APPROVED, NOT ACCEPTED
3
$240,450
562
$211,347
499
$248,853
114
$66,966
0
$0
153
$231,940
17
$82,322
APPLICATIONS DENIED
9
$234,752
826
$208,153
1,175
$249,065
224
$92,014
0
$0
245
$233,160
31
$104,612
APPLICATIONS WITHDRAWN
9
$308,787
611
$206,788
798
$240,230
59
$137,781
1
$107,500
152
$227,958
4
$106,585
FILES CLOSED FOR INCOMPLETENESS
2
$167,665
128
$241,078
303
$252,596
15
$133,783
0
$0
29
$218,664
1
$133,150
Aggregated Statistics For Year 2005 (Based on 6 partial tracts)
A) FHA, FSA/RHS & VA Home Purchase Loans
B) Conventional Home Purchase Loans
C) Refinancings
D) Home Improvement Loans
E) Loans on Dwellings For 5+ Families
F) Non-occupant Loans on < 5 Family Dwellings (A B C & D)
G) Loans On Manufactured Home Dwelling (A B C & D)
Number
Average Value
Number
Average Value
Number
Average Value
Number
Average Value
Number
Average Value
Number
Average Value
Number
Average Value
LOANS ORIGINATED
51
$195,451
3,477
$182,135
3,608
$197,415
412
$106,498
1
$3,327,030
1,315
$160,646
37
$82,417
APPLICATIONS APPROVED, NOT ACCEPTED
2
$128,270
353
$176,920
438
$189,511
129
$54,522
0
$0
122
$165,001
15
$87,873
APPLICATIONS DENIED
6
$164,815
746
$174,064
1,184
$193,705
340
$75,092
0
$0
206
$176,405
34
$97,731
APPLICATIONS WITHDRAWN
11
$210,502
502
$180,416
824
$191,076
114
$128,714
0
$0
168
$169,861
9
$96,679
FILES CLOSED FOR INCOMPLETENESS
2
$199,730
173
$159,670
405
$215,979
23
$114,506
0
$0
38
$157,317
1
$30,540
Aggregated Statistics For Year 2004 (Based on 6 partial tracts)
A) FHA, FSA/RHS & VA Home Purchase Loans
B) Conventional Home Purchase Loans
C) Refinancings
D) Home Improvement Loans
E) Loans on Dwellings For 5+ Families
F) Non-occupant Loans on < 5 Family Dwellings (A B C & D)
G) Loans On Manufactured Home Dwelling (A B C & D)
Number
Average Value
Number
Average Value
Number
Average Value
Number
Average Value
Number
Average Value
Number
Average Value
Number
Average Value
LOANS ORIGINATED
172
$160,913
2,622
$149,518
2,143
$156,548
231
$48,964
2
$7,041,330
785
$129,639
35
$72,356
APPLICATIONS APPROVED, NOT ACCEPTED
12
$149,357
258
$143,173
388
$155,711
103
$38,433
0
$0
58
$130,305
18
$57,244
APPLICATIONS DENIED
30
$144,148
358
$141,887
997
$151,113
295
$41,342
0
$0
103
$128,976
37
$75,443
APPLICATIONS WITHDRAWN
12
$160,378
255
$147,655
631
$154,794
56
$52,628
1
$16,291,800
83
$130,220
7
$127,907
FILES CLOSED FOR INCOMPLETENESS
2
$169,700
72
$123,678
302
$170,756
18
$44,006
0
$0
30
$102,677
4
$123,075
Aggregated Statistics For Year 2003 (Based on 6 partial tracts)
A) FHA, FSA/RHS & VA Home Purchase Loans
B) Conventional Home Purchase Loans
C) Refinancings
D) Home Improvement Loans
F) Non-occupant Loans on < 5 Family Dwellings (A B C & D)
Number
Average Value
Number
Average Value
Number
Average Value
Number
Average Value
Number
Average Value
LOANS ORIGINATED
526
$149,319
2,151
$150,911
3,512
$144,900
200
$31,529
508
$121,697
APPLICATIONS APPROVED, NOT ACCEPTED
26
$137,522
193
$143,071
494
$142,095
78
$30,713
40
$120,377
APPLICATIONS DENIED
68
$152,244
282
$136,527
1,026
$125,394
305
$28,308
75
$113,829
APPLICATIONS WITHDRAWN
85
$135,156
282
$147,763
808
$149,135
23
$30,622
62
$127,055
FILES CLOSED FOR INCOMPLETENESS
14
$129,735
65
$161,141
112
$151,167
25
$33,581
14
$125,195
Aggregated Statistics For Year 2002 (Based on 6 partial tracts)
A) FHA, FSA/RHS & VA Home Purchase Loans
B) Conventional Home Purchase Loans
C) Refinancings
D) Home Improvement Loans
E) Loans on Dwellings For 5+ Families
F) Non-occupant Loans on < 5 Family Dwellings (A B C & D)
Number
Average Value
Number
Average Value
Number
Average Value
Number
Average Value
Number
Average Value
Number
Average Value
LOANS ORIGINATED
1,056
$136,465
2,076
$134,362
1,866
$143,958
185
$26,975
2
$716,840
343
$110,017
APPLICATIONS APPROVED, NOT ACCEPTED
56
$134,664
236
$135,552
284
$125,183
113
$25,641
0
$0
38
$97,263
APPLICATIONS DENIED
108
$136,383
265
$133,945
597
$112,682
232
$25,908
0
$0
43
$106,178
APPLICATIONS WITHDRAWN
123
$125,552
196
$136,081
340
$133,310
24
$25,707
0
$0
55
$97,817
FILES CLOSED FOR INCOMPLETENESS
15
$123,090
61
$145,993
88
$142,051
1
$19,550
0
$0
3
$136,900
Aggregated Statistics For Year 2001 (Based on 6 partial tracts)
A) FHA, FSA/RHS & VA Home Purchase Loans
B) Conventional Home Purchase Loans
C) Refinancings
D) Home Improvement Loans
E) Loans on Dwellings For 5+ Families
F) Non-occupant Loans on < 5 Family Dwellings (A B C & D)
Number
Average Value
Number
Average Value
Number
Average Value
Number
Average Value
Number
Average Value
Number
Average Value
LOANS ORIGINATED
808
$129,484
1,093
$136,130
1,167
$133,608
93
$27,926
1
$3,275,840
176
$134,585
APPLICATIONS APPROVED, NOT ACCEPTED
42
$133,327
97
$120,618
144
$112,235
47
$25,851
0
$0
12
$108,321
APPLICATIONS DENIED
72
$133,540
176
$118,649
420
$95,036
156
$24,919
0
$0
24
$93,827
APPLICATIONS WITHDRAWN
84
$127,489
125
$127,336
224
$117,802
22
$22,937
0
$0
40
$128,181
FILES CLOSED FOR INCOMPLETENESS
3
$148,073
23
$157,477
55
$139,165
2
$10,705
0
$0
2
$92,035
Aggregated Statistics For Year 2000 (Based on 6 partial tracts)
A) FHA, FSA/RHS & VA Home Purchase Loans
B) Conventional Home Purchase Loans
C) Refinancings
D) Home Improvement Loans
F) Non-occupant Loans on < 5 Family Dwellings (A B C & D)
Number
Average Value
Number
Average Value
Number
Average Value
Number
Average Value
Number
Average Value
LOANS ORIGINATED
416
$117,613
625
$141,902
259
$92,469
128
$23,901
53
$126,839
APPLICATIONS APPROVED, NOT ACCEPTED
24
$116,511
72
$135,872
53
$88,716
69
$24,227
8
$102,885
APPLICATIONS DENIED
59
$118,431
120
$92,124
214
$62,536
156
$24,668
7
$72,500
APPLICATIONS WITHDRAWN
36
$115,342
79
$135,926
92
$93,286
21
$45,833
10
$115,138
FILES CLOSED FOR INCOMPLETENESS
8
$111,571
19
$119,417
40
$114,652
1
$41,650
0
$0
Aggregated Statistics For Year 1999 (Based on 3 partial tracts)
A) FHA, FSA/RHS & VA Home Purchase Loans
B) Conventional Home Purchase Loans
C) Refinancings
D) Home Improvement Loans
F) Non-occupant Loans on < 5 Family Dwellings (A B C & D)
2007 - 2018 National Fire Incident Reporting System (NFIRS) incidents
Based on the data from the years 2007 - 2018 the average number of fires per year is 14. The highest number of reported fires - 30 took place in 2017, and the least - 2 in 2008. The data has an increasing trend.
When looking into fire subcategories, the most incidents belonged to: Structure Fires (52.1%), and Outside Fires (25.5%).
Fire incident types reported to NFIRS in Zip Code 85340


 Nearest zip codes: 85309, 85395, 85355, 85388, 85379, 85307.
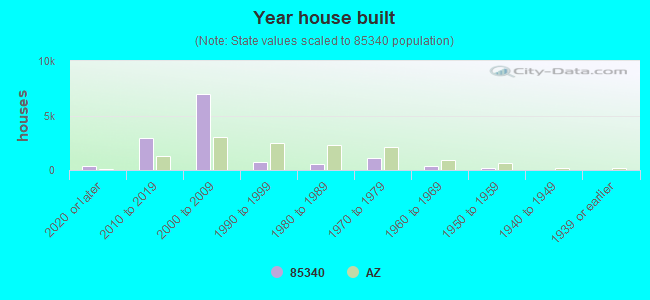


 Based on the data from the years 2007 - 2018 the average number of fires per year is 14. The highest number of reported fires - 30 took place in 2017, and the least - 2 in 2008. The data has an increasing trend.
 When looking into fire subcategories, the most incidents belonged to: Structure Fires (52.1%), and Outside Fires (25.5%).