Estimated zip code population in 2022: 24,043
Zip code population in 2010: 20,188
Zip code population in 2000: 19,764
Houses and condos: 7,706
Renter-occupied apartments: 2,183
% of renters here:
29%State:
40%
March 2022 cost of living index in zip code 89433: 95.7
(near average, U.S. average is 100)
Land area: 15.5
sq. mi.
Water area: 0.0
sq. mi.
Population density: 1,548 people per square mile (low).
OSM Map
General Map
Google Map
MSN Map
OSM Map
General Map
Google Map
MSN Map
OSM Map
General Map
Google Map
MSN Map
OSM Map
General Map
Google Map
MSN Map
Please wait while loading the map...
Real estate property taxes paid for housing units in 2022:
This zip code:
0.3% ($925)Nevada:
0.4% ($1,889)
Median real estate property taxes paid for housing units with mortgages in 2022: $1,099 (0.3%)
Median real estate property taxes paid for housing units with no mortgage in 2022: $698 (0.3%)
Profiles of local businesses
Business Search - 14 Million verified businesses
Males: 12,139 Females: 11,904
For population 25 years and over in 89433:
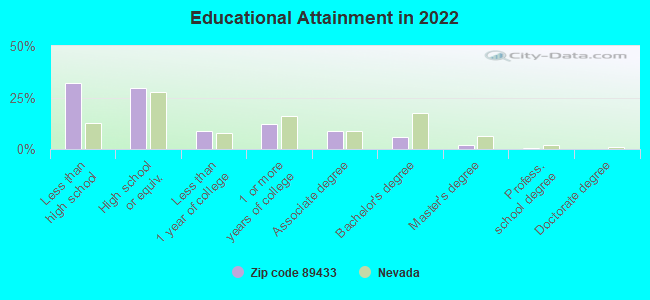
High school or higher: 66.8%Bachelor's degree or higher: 8.6%Graduate or professional degree: 2.7%Unemployed: 4.5%Mean travel time to work (commute): 25.5 minutes
For population 15 years and over in 89433:
Never married: 34.0%Now married: 46.0%Separated: 1.7%Widowed: 5.9%Divorced: 12.4%
Zip code 89433 compared to state average:
Black race population percentage significantly below state average. Hispanic race population percentage above state average. Median age below state average. Length of stay since moving in significantly above state average. Percentage of population with a bachelor's degree or higher significantly below state average. 12,640 52.6% Hispanic or Latino 9,869 41.1% White 555 2.3% Two or more races 373 1.6% American Indian 266 1.1% Asian 252 1.0% Black 85 0.4% Native Hawaiian and Other
Data:
Median household income ($)
Median household income (% change since 2000)
Household income diversity
Ratio of average income to average house value (%)
Ratio of average income to average rent
Median household income ($) - White
Median household income ($) - Black or African American
Median household income ($) - Asian
Median household income ($) - Hispanic or Latino
Median household income ($) - American Indian and Alaska Native
Median household income ($) - Multirace
Median household income ($) - Other Race
Median household income for houses/condos with a mortgage ($)
Median household income for apartments without a mortgage ($)
Races - White alone (%)
Races - White alone (% change since 2000)
Races - Black alone (%)
Races - Black alone (% change since 2000)
Races - American Indian alone (%)
Races - American Indian alone (% change since 2000)
Races - Asian alone (%)
Races - Asian alone (% change since 2000)
Races - Hispanic (%)
Races - Hispanic (% change since 2000)
Races - Native Hawaiian and Other Pacific Islander alone (%)
Races - Native Hawaiian and Other Pacific Islander alone (% change since 2000)
Races - Two or more races (%)
Races - Two or more races (% change since 2000)
Races - Other race alone (%)
Races - Other race alone (% change since 2000)
Racial diversity
Unemployment (%)
Unemployment (% change since 2000)
Unemployment (%) - White
Unemployment (%) - Black or African American
Unemployment (%) - Asian
Unemployment (%) - Hispanic or Latino
Unemployment (%) - American Indian and Alaska Native
Unemployment (%) - Multirace
Unemployment (%) - Other Race
Population density (people per square mile)
Population - Males (%)
Population - Females (%)
Population - Males (%) - White
Population - Males (%) - Black or African American
Population - Males (%) - Asian
Population - Males (%) - Hispanic or Latino
Population - Males (%) - American Indian and Alaska Native
Population - Males (%) - Multirace
Population - Males (%) - Other Race
Population - Females (%) - White
Population - Females (%) - Black or African American
Population - Females (%) - Asian
Population - Females (%) - Hispanic or Latino
Population - Females (%) - American Indian and Alaska Native
Population - Females (%) - Multirace
Population - Females (%) - Other Race
Coronavirus confirmed cases (Apr 19, 2024)
Deaths caused by coronavirus (Apr 19, 2024)
Coronavirus confirmed cases (per 100k population) (Apr 19, 2024)
Deaths caused by coronavirus (per 100k population) (Apr 19, 2024)
Daily increase in number of cases (Apr 19, 2024)
Weekly increase in number of cases (Apr 19, 2024)
Cases doubled (in days) (Apr 19, 2024)
Hospitalized patients (Apr 18, 2022)
Negative test results (Apr 18, 2022)
Total test results (Apr 18, 2022)
COVID Vaccine doses distributed (per 100k population) (Sep 19, 2023)
COVID Vaccine doses administered (per 100k population) (Sep 19, 2023)
COVID Vaccine doses distributed (Sep 19, 2023)
COVID Vaccine doses administered (Sep 19, 2023)
Likely homosexual households (%)
Likely homosexual households (% change since 2000)
Likely homosexual households - Lesbian couples (%)
Likely homosexual households - Lesbian couples (% change since 2000)
Likely homosexual households - Gay men (%)
Likely homosexual households - Gay men (% change since 2000)
Cost of living index
Median gross rent ($)
Median contract rent ($)
Median monthly housing costs ($)
Median house or condo value ($)
Median house or condo value ($ change since 2000)
Mean house or condo value by units in structure - 1, detached ($)
Mean house or condo value by units in structure - 1, attached ($)
Mean house or condo value by units in structure - 2 ($)
Mean house or condo value by units in structure by units in structure - 3 or 4 ($)
Mean house or condo value by units in structure - 5 or more ($)
Mean house or condo value by units in structure - Boat, RV, van, etc. ($)
Mean house or condo value by units in structure - Mobile home ($)
Median house or condo value ($) - White
Median house or condo value ($) - Black or African American
Median house or condo value ($) - Asian
Median house or condo value ($) - Hispanic or Latino
Median house or condo value ($) - American Indian and Alaska Native
Median house or condo value ($) - Multirace
Median house or condo value ($) - Other Race
Median resident age
Resident age diversity
Median resident age - Males
Median resident age - Females
Median resident age - White
Median resident age - Black or African American
Median resident age - Asian
Median resident age - Hispanic or Latino
Median resident age - American Indian and Alaska Native
Median resident age - Multirace
Median resident age - Other Race
Median resident age - Males - White
Median resident age - Males - Black or African American
Median resident age - Males - Asian
Median resident age - Males - Hispanic or Latino
Median resident age - Males - American Indian and Alaska Native
Median resident age - Males - Multirace
Median resident age - Males - Other Race
Median resident age - Females - White
Median resident age - Females - Black or African American
Median resident age - Females - Asian
Median resident age - Females - Hispanic or Latino
Median resident age - Females - American Indian and Alaska Native
Median resident age - Females - Multirace
Median resident age - Females - Other Race
Commute - mean travel time to work (minutes)
Travel time to work - Less than 5 minutes (%)
Travel time to work - Less than 5 minutes (% change since 2000)
Travel time to work - 5 to 9 minutes (%)
Travel time to work - 5 to 9 minutes (% change since 2000)
Travel time to work - 10 to 19 minutes (%)
Travel time to work - 10 to 19 minutes (% change since 2000)
Travel time to work - 20 to 29 minutes (%)
Travel time to work - 20 to 29 minutes (% change since 2000)
Travel time to work - 30 to 39 minutes (%)
Travel time to work - 30 to 39 minutes (% change since 2000)
Travel time to work - 40 to 59 minutes (%)
Travel time to work - 40 to 59 minutes (% change since 2000)
Travel time to work - 60 to 89 minutes (%)
Travel time to work - 60 to 89 minutes (% change since 2000)
Travel time to work - 90 or more minutes (%)
Travel time to work - 90 or more minutes (% change since 2000)
Marital status - Never married (%)
Marital status - Now married (%)
Marital status - Separated (%)
Marital status - Widowed (%)
Marital status - Divorced (%)
Median family income ($)
Median family income (% change since 2000)
Median non-family income ($)
Median non-family income (% change since 2000)
Median per capita income ($)
Median per capita income (% change since 2000)
Median family income ($) - White
Median family income ($) - Black or African American
Median family income ($) - Asian
Median family income ($) - Hispanic or Latino
Median family income ($) - American Indian and Alaska Native
Median family income ($) - Multirace
Median family income ($) - Other Race
Median year house/condo built
Median year apartment built
Year house built - Built 2005 or later (%)
Year house built - Built 2000 to 2004 (%)
Year house built - Built 1990 to 1999 (%)
Year house built - Built 1980 to 1989 (%)
Year house built - Built 1970 to 1979 (%)
Year house built - Built 1960 to 1969 (%)
Year house built - Built 1950 to 1959 (%)
Year house built - Built 1940 to 1949 (%)
Year house built - Built 1939 or earlier (%)
Average household size
Household density (households per square mile)
Average household size - White
Average household size - Black or African American
Average household size - Asian
Average household size - Hispanic or Latino
Average household size - American Indian and Alaska Native
Average household size - Multirace
Average household size - Other Race
Occupied housing units (%)
Vacant housing units (%)
Owner occupied housing units (%)
Renter occupied housing units (%)
Vacancy status - For rent (%)
Vacancy status - For sale only (%)
Vacancy status - Rented or sold, not occupied (%)
Vacancy status - For seasonal, recreational, or occasional use (%)
Vacancy status - For migrant workers (%)
Vacancy status - Other vacant (%)
Residents with income below the poverty level (%)
Residents with income below 50% of the poverty level (%)
Children below poverty level (%)
Poor families by family type - Married-couple family (%)
Poor families by family type - Male, no wife present (%)
Poor families by family type - Female, no husband present (%)
Poverty status for native-born residents (%)
Poverty status for foreign-born residents (%)
Poverty among high school graduates not in families (%)
Poverty among people who did not graduate high school not in families (%)
Residents with income below the poverty level (%) - White
Residents with income below the poverty level (%) - Black or African American
Residents with income below the poverty level (%) - Asian
Residents with income below the poverty level (%) - Hispanic or Latino
Residents with income below the poverty level (%) - American Indian and Alaska Native
Residents with income below the poverty level (%) - Multirace
Residents with income below the poverty level (%) - Other Race
Air pollution - Air Quality Index (AQI)
Air pollution - CO
Air pollution - NO2
Air pollution - SO2
Air pollution - Ozone
Air pollution - PM10
Air pollution - PM25
Air pollution - Pb
Crime - Murders per 100,000 population
Crime - Rapes per 100,000 population
Crime - Robberies per 100,000 population
Crime - Assaults per 100,000 population
Crime - Burglaries per 100,000 population
Crime - Thefts per 100,000 population
Crime - Auto thefts per 100,000 population
Crime - Arson per 100,000 population
Crime - City-data.com crime index
Crime - Violent crime index
Crime - Property crime index
Crime - Murders per 100,000 population (5 year average)
Crime - Rapes per 100,000 population (5 year average)
Crime - Robberies per 100,000 population (5 year average)
Crime - Assaults per 100,000 population (5 year average)
Crime - Burglaries per 100,000 population (5 year average)
Crime - Thefts per 100,000 population (5 year average)
Crime - Auto thefts per 100,000 population (5 year average)
Crime - Arson per 100,000 population (5 year average)
Crime - City-data.com crime index (5 year average)
Crime - Violent crime index (5 year average)
Crime - Property crime index (5 year average)
1996 Presidential Elections Results (%) - Democratic Party (Clinton)
1996 Presidential Elections Results (%) - Republican Party (Dole)
1996 Presidential Elections Results (%) - Other
2000 Presidential Elections Results (%) - Democratic Party (Gore)
2000 Presidential Elections Results (%) - Republican Party (Bush)
2000 Presidential Elections Results (%) - Other
2004 Presidential Elections Results (%) - Democratic Party (Kerry)
2004 Presidential Elections Results (%) - Republican Party (Bush)
2004 Presidential Elections Results (%) - Other
2008 Presidential Elections Results (%) - Democratic Party (Obama)
2008 Presidential Elections Results (%) - Republican Party (McCain)
2008 Presidential Elections Results (%) - Other
2012 Presidential Elections Results (%) - Democratic Party (Obama)
2012 Presidential Elections Results (%) - Republican Party (Romney)
2012 Presidential Elections Results (%) - Other
2016 Presidential Elections Results (%) - Democratic Party (Clinton)
2016 Presidential Elections Results (%) - Republican Party (Trump)
2016 Presidential Elections Results (%) - Other
2020 Presidential Elections Results (%) - Democratic Party (Biden)
2020 Presidential Elections Results (%) - Republican Party (Trump)
2020 Presidential Elections Results (%) - Other
Ancestries Reported - Arab (%)
Ancestries Reported - Czech (%)
Ancestries Reported - Danish (%)
Ancestries Reported - Dutch (%)
Ancestries Reported - English (%)
Ancestries Reported - French (%)
Ancestries Reported - French Canadian (%)
Ancestries Reported - German (%)
Ancestries Reported - Greek (%)
Ancestries Reported - Hungarian (%)
Ancestries Reported - Irish (%)
Ancestries Reported - Italian (%)
Ancestries Reported - Lithuanian (%)
Ancestries Reported - Norwegian (%)
Ancestries Reported - Polish (%)
Ancestries Reported - Portuguese (%)
Ancestries Reported - Russian (%)
Ancestries Reported - Scotch-Irish (%)
Ancestries Reported - Scottish (%)
Ancestries Reported - Slovak (%)
Ancestries Reported - Subsaharan African (%)
Ancestries Reported - Swedish (%)
Ancestries Reported - Swiss (%)
Ancestries Reported - Ukrainian (%)
Ancestries Reported - United States (%)
Ancestries Reported - Welsh (%)
Ancestries Reported - West Indian (%)
Ancestries Reported - Other (%)
Educational Attainment - No schooling completed (%)
Educational Attainment - Less than high school (%)
Educational Attainment - High school or equivalent (%)
Educational Attainment - Less than 1 year of college (%)
Educational Attainment - 1 or more years of college (%)
Educational Attainment - Associate degree (%)
Educational Attainment - Bachelor's degree (%)
Educational Attainment - Master's degree (%)
Educational Attainment - Professional school degree (%)
Educational Attainment - Doctorate degree (%)
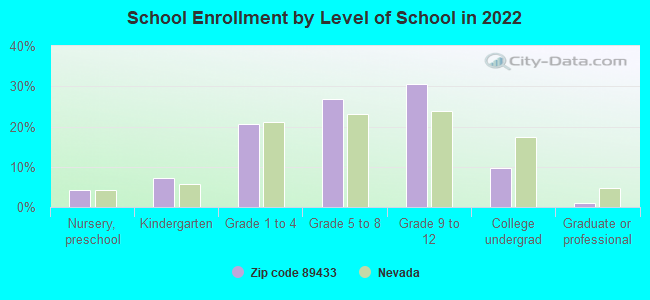
School Enrollment - Nursery, preschool (%)
School Enrollment - Kindergarten (%)
School Enrollment - Grade 1 to 4 (%)
School Enrollment - Grade 5 to 8 (%)
School Enrollment - Grade 9 to 12 (%)
School Enrollment - College undergrad (%)
School Enrollment - Graduate or professional (%)
School Enrollment - Not enrolled in school (%)
School enrollment - Public schools (%)
School enrollment - Private schools (%)
School enrollment - Not enrolled (%)
Median number of rooms in houses and condos
Median number of rooms in apartments
Housing units lacking complete plumbing facilities (%)
Housing units lacking complete kitchen facilities (%)
Density of houses
Urban houses (%)
Rural houses (%)
Households with people 60 years and over (%)
Households with people 65 years and over (%)
Households with people 75 years and over (%)
Households with one or more nonrelatives (%)
Households with no nonrelatives (%)
Population in households (%)
Family households (%)
Nonfamily households (%)
Population in families (%)
Family households with own children (%)
Median number of bedrooms in owner occupied houses
Mean number of bedrooms in owner occupied houses
Median number of bedrooms in renter occupied houses
Mean number of bedrooms in renter occupied houses
Median number of vehichles in owner occupied houses
Mean number of vehichles in owner occupied houses
Median number of vehichles in renter occupied houses
Mean number of vehichles in renter occupied houses
Mortgage status - with mortgage (%)
Mortgage status - with second mortgage (%)
Mortgage status - with home equity loan (%)
Mortgage status - with both second mortgage and home equity loan (%)
Mortgage status - without a mortgage (%)
Average family size
Average family size - White
Average family size - Black or African American
Average family size - Asian
Average family size - Hispanic or Latino
Average family size - American Indian and Alaska Native
Average family size - Multirace
Average family size - Other Race
Geographical mobility - Same house 1 year ago (%)
Geographical mobility - Moved within same county (%)
Geographical mobility - Moved from different county within same state (%)
Geographical mobility - Moved from different state (%)
Geographical mobility - Moved from abroad (%)
Place of birth - Born in state of residence (%)
Place of birth - Born in other state (%)
Place of birth - Native, outside of US (%)
Place of birth - Foreign born (%)
Housing units in structures - 1, detached (%)
Housing units in structures - 1, attached (%)
Housing units in structures - 2 (%)
Housing units in structures - 3 or 4 (%)
Housing units in structures - 5 to 9 (%)
Housing units in structures - 10 to 19 (%)
Housing units in structures - 20 to 49 (%)
Housing units in structures - 50 or more (%)
Housing units in structures - Mobile home (%)
Housing units in structures - Boat, RV, van, etc. (%)
House/condo owner moved in on average (years ago)
Renter moved in on average (years ago)
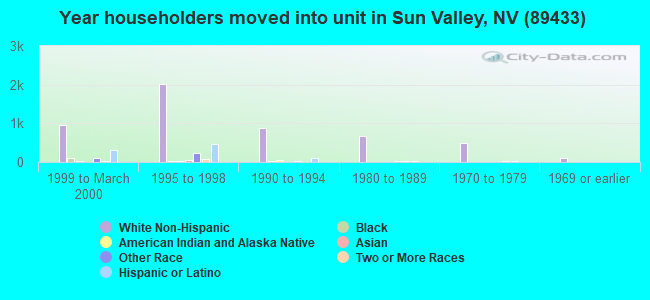
Year householder moved into unit - Moved in 1999 to March 2000 (%)
Year householder moved into unit - Moved in 1995 to 1998 (%)
Year householder moved into unit - Moved in 1990 to 1994 (%)
Year householder moved into unit - Moved in 1980 to 1989 (%)
Year householder moved into unit - Moved in 1970 to 1979 (%)
Year householder moved into unit - Moved in 1969 or earlier (%)
Means of transportation to work - Drove car alone (%)
Means of transportation to work - Carpooled (%)
Means of transportation to work - Public transportation (%)
Means of transportation to work - Bus or trolley bus (%)
Means of transportation to work - Streetcar or trolley car (%)
Means of transportation to work - Subway or elevated (%)
Means of transportation to work - Railroad (%)
Means of transportation to work - Ferryboat (%)
Means of transportation to work - Taxicab (%)
Means of transportation to work - Motorcycle (%)
Means of transportation to work - Bicycle (%)
Means of transportation to work - Walked (%)
Means of transportation to work - Other means (%)
Working at home (%)
Industry diversity
Most Common Industries - Agriculture, forestry, fishing and hunting, and mining (%)
Most Common Industries - Agriculture, forestry, fishing and hunting (%)
Most Common Industries - Mining, quarrying, and oil and gas extraction (%)
Most Common Industries - Construction (%)
Most Common Industries - Manufacturing (%)
Most Common Industries - Wholesale trade (%)
Most Common Industries - Retail trade (%)
Most Common Industries - Transportation and warehousing, and utilities (%)
Most Common Industries - Transportation and warehousing (%)
Most Common Industries - Utilities (%)
Most Common Industries - Information (%)
Most Common Industries - Finance and insurance, and real estate and rental and leasing (%)
Most Common Industries - Finance and insurance (%)
Most Common Industries - Real estate and rental and leasing (%)
Most Common Industries - Professional, scientific, and management, and administrative and waste management services (%)
Most Common Industries - Professional, scientific, and technical services (%)
Most Common Industries - Management of companies and enterprises (%)
Most Common Industries - Administrative and support and waste management services (%)
Most Common Industries - Educational services, and health care and social assistance (%)
Most Common Industries - Educational services (%)
Most Common Industries - Health care and social assistance (%)
Most Common Industries - Arts, entertainment, and recreation, and accommodation and food services (%)
Most Common Industries - Arts, entertainment, and recreation (%)
Most Common Industries - Accommodation and food services (%)
Most Common Industries - Other services, except public administration (%)
Most Common Industries - Public administration (%)
Occupation diversity
Most Common Occupations - Management, business, science, and arts occupations (%)
Most Common Occupations - Management, business, and financial occupations (%)
Most Common Occupations - Management occupations (%)
Most Common Occupations - Business and financial operations occupations (%)
Most Common Occupations - Computer, engineering, and science occupations (%)
Most Common Occupations - Computer and mathematical occupations (%)
Most Common Occupations - Architecture and engineering occupations (%)
Most Common Occupations - Life, physical, and social science occupations (%)
Most Common Occupations - Education, legal, community service, arts, and media occupations (%)
Most Common Occupations - Community and social service occupations (%)
Most Common Occupations - Legal occupations (%)
Most Common Occupations - Education, training, and library occupations (%)
Most Common Occupations - Arts, design, entertainment, sports, and media occupations (%)
Most Common Occupations - Healthcare practitioners and technical occupations (%)
Most Common Occupations - Health diagnosing and treating practitioners and other technical occupations (%)
Most Common Occupations - Health technologists and technicians (%)
Most Common Occupations - Service occupations (%)
Most Common Occupations - Healthcare support occupations (%)
Most Common Occupations - Protective service occupations (%)
Most Common Occupations - Fire fighting and prevention, and other protective service workers including supervisors (%)
Most Common Occupations - Law enforcement workers including supervisors (%)
Most Common Occupations - Food preparation and serving related occupations (%)
Most Common Occupations - Building and grounds cleaning and maintenance occupations (%)
Most Common Occupations - Personal care and service occupations (%)
Most Common Occupations - Sales and office occupations (%)
Most Common Occupations - Sales and related occupations (%)
Most Common Occupations - Office and administrative support occupations (%)
Most Common Occupations - Natural resources, construction, and maintenance occupations (%)
Most Common Occupations - Farming, fishing, and forestry occupations (%)
Most Common Occupations - Construction and extraction occupations (%)
Most Common Occupations - Installation, maintenance, and repair occupations (%)
Most Common Occupations - Production, transportation, and material moving occupations (%)
Most Common Occupations - Production occupations (%)
Most Common Occupations - Transportation occupations (%)
Most Common Occupations - Material moving occupations (%)
People in Group quarters - Institutionalized population (%)
People in Group quarters - Correctional institutions (%)
People in Group quarters - Federal prisons and detention centers (%)
People in Group quarters - Halfway houses (%)
People in Group quarters - Local jails and other confinement facilities (including police lockups) (%)
People in Group quarters - Military disciplinary barracks (%)
People in Group quarters - State prisons (%)
People in Group quarters - Other types of correctional institutions (%)
People in Group quarters - Nursing homes (%)
People in Group quarters - Hospitals/wards, hospices, and schools for the handicapped (%)
People in Group quarters - Hospitals/wards and hospices for chronically ill (%)
People in Group quarters - Hospices or homes for chronically ill (%)
People in Group quarters - Military hospitals or wards for chronically ill (%)
People in Group quarters - Other hospitals or wards for chronically ill (%)
People in Group quarters - Hospitals or wards for drug/alcohol abuse (%)
People in Group quarters - Mental (Psychiatric) hospitals or wards (%)
People in Group quarters - Schools, hospitals, or wards for the mentally retarded (%)
People in Group quarters - Schools, hospitals, or wards for the physically handicapped (%)
People in Group quarters - Institutions for the deaf (%)
People in Group quarters - Institutions for the blind (%)
People in Group quarters - Orthopedic wards and institutions for the physically handicapped (%)
People in Group quarters - Wards in general hospitals for patients who have no usual home elsewhere (%)
People in Group quarters - Wards in military hospitals for patients who have no usual home elsewhere (%)
People in Group quarters - Juvenile institutions (%)
People in Group quarters - Long-term care (%)
People in Group quarters - Homes for abused, dependent, and neglected children (%)
People in Group quarters - Residential treatment centers for emotionally disturbed children (%)
People in Group quarters - Training schools for juvenile delinquents (%)
People in Group quarters - Short-term care, detention or diagnostic centers for delinquent children (%)
People in Group quarters - Type of juvenile institution unknown (%)
People in Group quarters - Noninstitutionalized population (%)
People in Group quarters - College dormitories (includes college quarters off campus) (%)
People in Group quarters - Military quarters (%)
People in Group quarters - On base (%)
People in Group quarters - Barracks, unaccompanied personnel housing (UPH), (Enlisted/Officer), ;and similar group living quarters for military personnel (%)
People in Group quarters - Transient quarters for temporary residents (%)
People in Group quarters - Military ships (%)
People in Group quarters - Group homes (%)
People in Group quarters - Homes or halfway houses for drug/alcohol abuse (%)
People in Group quarters - Homes for the mentally ill (%)
People in Group quarters - Homes for the mentally retarded (%)
People in Group quarters - Homes for the physically handicapped (%)
People in Group quarters - Other group homes (%)
People in Group quarters - Religious group quarters (%)
People in Group quarters - Dormitories (%)
People in Group quarters - Agriculture workers' dormitories on farms (%)
People in Group quarters - Job Corps and vocational training facilities (%)
People in Group quarters - Other workers' dormitories (%)
People in Group quarters - Crews of maritime vessels (%)
People in Group quarters - Other nonhousehold living situations (%)
People in Group quarters - Other noninstitutional group quarters (%)
Residents speaking English at home (%)
Residents speaking English at home - Born in the United States (%)
Residents speaking English at home - Native, born elsewhere (%)
Residents speaking English at home - Foreign born (%)
Residents speaking Spanish at home (%)
Residents speaking Spanish at home - Born in the United States (%)
Residents speaking Spanish at home - Native, born elsewhere (%)
Residents speaking Spanish at home - Foreign born (%)
Residents speaking other language at home (%)
Residents speaking other language at home - Born in the United States (%)
Residents speaking other language at home - Native, born elsewhere (%)
Residents speaking other language at home - Foreign born (%)
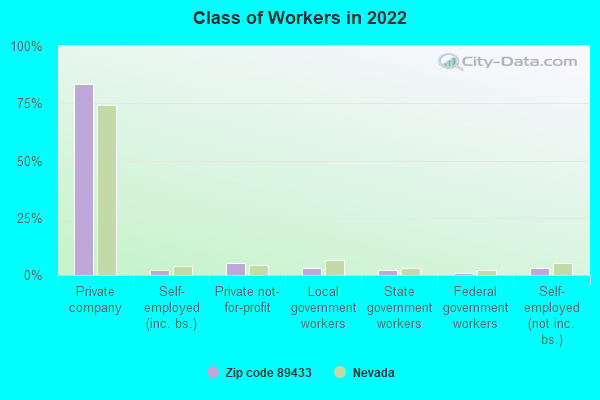
Class of Workers - Employee of private company (%)
Class of Workers - Self-employed in own incorporated business (%)
Class of Workers - Private not-for-profit wage and salary workers (%)
Class of Workers - Local government workers (%)
Class of Workers - State government workers (%)
Class of Workers - Federal government workers (%)
Class of Workers - Self-employed workers in own not incorporated business and Unpaid family workers (%)
House heating fuel used in houses and condos - Utility gas (%)
House heating fuel used in houses and condos - Bottled, tank, or LP gas (%)
House heating fuel used in houses and condos - Electricity (%)
House heating fuel used in houses and condos - Fuel oil, kerosene, etc. (%)
House heating fuel used in houses and condos - Coal or coke (%)
House heating fuel used in houses and condos - Wood (%)
House heating fuel used in houses and condos - Solar energy (%)
House heating fuel used in houses and condos - Other fuel (%)
House heating fuel used in houses and condos - No fuel used (%)
House heating fuel used in apartments - Utility gas (%)
House heating fuel used in apartments - Bottled, tank, or LP gas (%)
House heating fuel used in apartments - Electricity (%)
House heating fuel used in apartments - Fuel oil, kerosene, etc. (%)
House heating fuel used in apartments - Coal or coke (%)
House heating fuel used in apartments - Wood (%)
House heating fuel used in apartments - Solar energy (%)
House heating fuel used in apartments - Other fuel (%)
House heating fuel used in apartments - No fuel used (%)
Armed forces status - In Armed Forces (%)
Armed forces status - Civilian (%)
Armed forces status - Civilian - Veteran (%)
Armed forces status - Civilian - Nonveteran (%)
Fatal accidents locations in years 2005-2021
Fatal accidents locations in 2005
Fatal accidents locations in 2006
Fatal accidents locations in 2007
Fatal accidents locations in 2008
Fatal accidents locations in 2009
Fatal accidents locations in 2010
Fatal accidents locations in 2011
Fatal accidents locations in 2012
Fatal accidents locations in 2013
Fatal accidents locations in 2014
Fatal accidents locations in 2015
Fatal accidents locations in 2016
Fatal accidents locations in 2017
Fatal accidents locations in 2018
Fatal accidents locations in 2019
Fatal accidents locations in 2020
Fatal accidents locations in 2021
Alcohol use - People drinking some alcohol every month (%)
Alcohol use - People not drinking at all (%)
Alcohol use - Average days/month drinking alcohol
Alcohol use - Average drinks/week
Alcohol use - Average days/year people drink much
Audiometry - Average condition of hearing (%)
Audiometry - People that can hear a whisper from across a quiet room (%)
Audiometry - People that can hear normal voice from across a quiet room (%)
Audiometry - Ears ringing, roaring, buzzing (%)
Audiometry - Had a job exposure to loud noise (%)
Audiometry - Had off-work exposure to loud noise (%)
Blood Pressure & Cholesterol - Has high blood pressure (%)
Blood Pressure & Cholesterol - Checking blood pressure at home (%)
Blood Pressure & Cholesterol - Frequently checking blood cholesterol (%)
Blood Pressure & Cholesterol - Has high cholesterol level (%)
Consumer Behavior - Money monthly spent on food at supermarket/grocery store
Consumer Behavior - Money monthly spent on food at other stores
Consumer Behavior - Money monthly spent on eating out
Consumer Behavior - Money monthly spent on carryout/delivered foods
Consumer Behavior - Income spent on food at supermarket/grocery store (%)
Consumer Behavior - Income spent on food at other stores (%)
Consumer Behavior - Income spent on eating out (%)
Consumer Behavior - Income spent on carryout/delivered foods (%)
Current Health Status - General health condition (%)
Current Health Status - Blood donors (%)
Current Health Status - Has blood ever tested for HIV virus (%)
Current Health Status - Left-handed people (%)
Dermatology - People using sunscreen (%)
Diabetes - Diabetics (%)
Diabetes - Had a blood test for high blood sugar (%)
Diabetes - People taking insulin (%)
Diet Behavior & Nutrition - Diet health (%)
Diet Behavior & Nutrition - Milk product consumption (# of products/month)
Diet Behavior & Nutrition - Meals not home prepared (#/week)
Diet Behavior & Nutrition - Meals from fast food or pizza place (#/week)
Diet Behavior & Nutrition - Ready-to-eat foods (#/month)
Diet Behavior & Nutrition - Frozen meals/pizza (#/month)
Drug Use - People that ever used marijuana or hashish (%)
Drug Use - Ever used hard drugs (%)
Drug Use - Ever used any form of cocaine (%)
Drug Use - Ever used heroin (%)
Drug Use - Ever used methamphetamine (%)
Health Insurance - People covered by health insurance (%)
Kidney Conditions-Urology - Avg. # of times urinating at night
Medical Conditions - People with asthma (%)
Medical Conditions - People with anemia (%)
Medical Conditions - People with psoriasis (%)
Medical Conditions - People with overweight (%)
Medical Conditions - Elderly people having difficulties in thinking or remembering (%)
Medical Conditions - People who ever received blood transfusion (%)
Medical Conditions - People having trouble seeing even with glass/contacts (%)
Medical Conditions - People with arthritis (%)
Medical Conditions - People with gout (%)
Medical Conditions - People with congestive heart failure (%)
Medical Conditions - People with coronary heart disease (%)
Medical Conditions - People with angina pectoris (%)
Medical Conditions - People who ever had heart attack (%)
Medical Conditions - People who ever had stroke (%)
Medical Conditions - People with emphysema (%)
Medical Conditions - People with thyroid problem (%)
Medical Conditions - People with chronic bronchitis (%)
Medical Conditions - People with any liver condition (%)
Medical Conditions - People who ever had cancer or malignancy (%)
Mental Health - People who have little interest in doing things (%)
Mental Health - People feeling down, depressed, or hopeless (%)
Mental Health - People who have trouble sleeping or sleeping too much (%)
Mental Health - People feeling tired or having little energy (%)
Mental Health - People with poor appetite or overeating (%)
Mental Health - People feeling bad about themself (%)
Mental Health - People who have trouble concentrating on things (%)
Mental Health - People moving or speaking slowly or too fast (%)
Mental Health - People having thoughts they would be better off dead (%)
Oral Health - Average years since last visit a dentist
Oral Health - People embarrassed because of mouth (%)
Oral Health - People with gum disease (%)
Oral Health - General health of teeth and gums (%)
Oral Health - Average days a week using dental floss/device
Oral Health - Average days a week using mouthwash for dental problem
Oral Health - Average number of teeth
Pesticide Use - Households using pesticides to control insects (%)
Pesticide Use - Households using pesticides to kill weeds (%)
Physical Activity - People doing vigorous-intensity work activities (%)
Physical Activity - People doing moderate-intensity work activities (%)
Physical Activity - People walking or bicycling (%)
Physical Activity - People doing vigorous-intensity recreational activities (%)
Physical Activity - People doing moderate-intensity recreational activities (%)
Physical Activity - Average hours a day doing sedentary activities
Physical Activity - Average hours a day watching TV or videos
Physical Activity - Average hours a day using computer
Physical Functioning - People having limitations keeping them from working (%)
Physical Functioning - People limited in amount of work they can do (%)
Physical Functioning - People that need special equipment to walk (%)
Physical Functioning - People experiencing confusion/memory problems (%)
Physical Functioning - People requiring special healthcare equipment (%)
Prescription Medications - Average number of prescription medicines taking
Preventive Aspirin Use - Adults 40+ taking low-dose aspirin (%)
Reproductive Health - Vaginal deliveries (%)
Reproductive Health - Cesarean deliveries (%)
Reproductive Health - Deliveries resulted in a live birth (%)
Reproductive Health - Pregnancies resulted in a delivery (%)
Reproductive Health - Women breastfeeding newborns (%)
Reproductive Health - Women that had a hysterectomy (%)
Reproductive Health - Women that had both ovaries removed (%)
Reproductive Health - Women that have ever taken birth control pills (%)
Reproductive Health - Women taking birth control pills (%)
Reproductive Health - Women that have ever used Depo-Provera or injectables (%)
Reproductive Health - Women that have ever used female hormones (%)
Sexual Behavior - People 18+ that ever had sex (vaginal, anal, or oral) (%)
Sexual Behavior - Males 18+ that ever had vaginal sex with a woman (%)
Sexual Behavior - Males 18+ that ever performed oral sex on a woman (%)
Sexual Behavior - Males 18+ that ever had anal sex with a woman (%)
Sexual Behavior - Males 18+ that ever had any sex with a man (%)
Sexual Behavior - Females 18+ that ever had vaginal sex with a man (%)
Sexual Behavior - Females 18+ that ever performed oral sex on a man (%)
Sexual Behavior - Females 18+ that ever had anal sex with a man (%)
Sexual Behavior - Females 18+ that ever had any kind of sex with a woman (%)
Sexual Behavior - Average age people first had sex
Sexual Behavior - Average number of female sex partners in lifetime (males 18+)
Sexual Behavior - Average number of female vaginal sex partners in lifetime (males 18+)
Sexual Behavior - Average age people first performed oral sex on a woman (18+)
Sexual Behavior - Average number of woman performed oral sex on in lifetime (18+)
Sexual Behavior - Average number of male sex partners in lifetime (males 18+)
Sexual Behavior - Average number of male anal sex partners in lifetime (males 18+)
Sexual Behavior - Average age people first performed oral sex on a man (18+)
Sexual Behavior - Average number of male oral sex partners in lifetime (18+)
Sexual Behavior - People using protection when performing oral sex (%)
Sexual Behavior - Average number of times people have vaginal or anal sex a year
Sexual Behavior - People having sex without condom (%)
Sexual Behavior - Average number of male sex partners in lifetime (females 18+)
Sexual Behavior - Average number of male vaginal sex partners in lifetime (females 18+)
Sexual Behavior - Average number of female sex partners in lifetime (females 18+)
Sexual Behavior - Circumcised males 18+ (%)
Sleep Disorders - Average hours sleeping at night
Sleep Disorders - People that has trouble sleeping (%)
Smoking-Cigarette Use - People smoking cigarettes (%)
Taste & Smell - People 40+ having problems with smell (%)
Taste & Smell - People 40+ having problems with taste (%)
Taste & Smell - People 40+ that ever had wisdom teeth removed (%)
Taste & Smell - People 40+ that ever had tonsils teeth removed (%)
Taste & Smell - People 40+ that ever had a loss of consciousness because of a head injury (%)
Taste & Smell - People 40+ that ever had a broken nose or other serious injury to face or skull (%)
Taste & Smell - People 40+ that ever had two or more sinus infections (%)
Weight - Average height (inches)
Weight - Average weight (pounds)
Weight - Average BMI
Weight - People that are obese (%)
Weight - People that ever were obese (%)
Weight - People trying to lose weight (%)
Urban population: 23,083
Rural population: 959
Estimated median house/condo value in 2022: $332,130
89433:
$332,130Nevada:
$434,700
Median resident age: This zip code:
32.7 yearsNevada median age:
39.0 years
Average household size: This zip code:
3.2 peopleNevada:
2.6 people
Averages for the 2020 tax year for zip code 89433, filed in 2021:
Average Adjusted Gross Income (AGI) in 2020: $42,345 (Individual Income Tax Returns) Here:
$42,345State:
$78,964
Salary/wage: $38,932 (reported on 89.9% of returns )Here:
$38,932State:
$54,472
(% of AGI for various income ranges: 1306.9% for AGIs below $25k , 3852.3% for AGIs $25k-50k , 6660.2% for AGIs $50k-75k , 9895.7% for AGIs $75k-100k , 16034.3% for AGIs $100k-200k ) Taxable interest for individuals: $499 (reported on 10.4% of returns )This zip code:
$499Nevada:
$3,521
(% of AGI for various income ranges: 3.7% for AGIs below $25k , 4.3% for AGIs $25k-50k , 11.3% for AGIs $50k-75k , 10.8% for AGIs $75k-100k , 24.9% for AGIs $100k-200k ) Ordinary dividends: $1,541 (reported on 4.4% of returns )(% of AGI for various income ranges: 5.8% for AGIs below $25k , 5.2% for AGIs $25k-50k , 14.7% for AGIs $50k-75k , 10.5% for AGIs $75k-100k , 37.7% for AGIs $100k-200k ) Net capital gain/loss in AGI: +$5,560 (reported on 4.8% of returns )Here:
+$5,560State:
+$63,025
(% of AGI for various income ranges: 2.6% for AGIs below $25k , 9.7% for AGIs $25k-50k , 32.6% for AGIs $50k-75k , 74.1% for AGIs $75k-100k , 434.9% for AGIs $100k-200k ) Profit/loss from business: +$9,478 (reported on 8.6% of returns )Here:
+$9,478State:
+$11,500
(% of AGI for various income ranges: 74.1% for AGIs below $25k , 76.6% for AGIs $25k-50k , 109.0% for AGIs $50k-75k , 223.6% for AGIs $75k-100k , 364.0% for AGIs $100k-200k ) Taxable individual retirement arrangement distribution: $12,153 (reported on 2.9% of returns )89433:
$12,153Nevada:
$23,628
(% of AGI for various income ranges: 24.0% for AGIs below $25k , 25.3% for AGIs $25k-50k , 47.5% for AGIs $50k-75k , 72.0% for AGIs $75k-100k , 327.4% for AGIs $100k-200k ) Total itemized deductions: $23,238 (reported on 2.0% of returns )Here:
$23,238State:
$44,173
(% of AGI for various income ranges: 15.2% for AGIs below $25k , 40.8% for AGIs $25k-50k , 93.4% for AGIs $50k-75k , 114.1% for AGIs $75k-100k , 364.6% for AGIs $100k-200k ) Charity contributions: $2,609 (reported on 1.1% of returns )(% of AGI for various income ranges: 2.5% for AGIs $25k-50k , 8.6% for AGIs $50k-75k , 27.1% for AGIs $100k-200k ) Taxes paid: $3,600 (reported on 2.0% of returns )(% of AGI for various income ranges: 8.0% for AGIs $25k-50k , 13.9% for AGIs $50k-75k , 18.9% for AGIs $75k-100k , 60.3% for AGIs $100k-200k ) Earned income credit: $2,260 (reported on 20.1% of returns )(% of AGI for various income ranges: 94.7% for AGIs below $25k , 70.5% for AGIs $25k-50k , 1.1% for AGIs $50k-75k ) Percentage of individuals using paid preparers for their 2020 taxes: 94.2%(% for various income ranges: 93.7% for AGIs below $25k , 94.8% for AGIs $25k-50k , 94.9% for AGIs $50k-75k , 94.0% for AGIs $75k-100k , 93.0% for AGIs $100k-200k , 66.7% for AGIs over 200k )
Averages for the 2012 tax year for zip code 89433, filed in 2013:
Average Adjusted Gross Income (AGI) in 2012: $32,442 (Individual Income Tax Returns) Here:
$32,442State:
$61,164
Salary/wage: $30,028 (reported on 88.8% of returns )Here:
$30,028State:
$45,924
(% of AGI for various income ranges: 80.0% for AGIs below $25k , 85.7% for AGIs $25k-50k , 82.5% for AGIs $50k-75k , 80.3% for AGIs $75k-100k , 74.8% for AGIs $100k-200k ) Taxable interest for individuals: $482 (reported on 12.8% of returns )This zip code:
$482Nevada:
$3,137
(% of AGI for various income ranges: 0.4% for AGIs below $25k , 0.1% for AGIs $25k-50k , 0.2% for AGIs $50k-75k ) Ordinary dividends: $2,904 (reported on 5.7% of returns )(% of AGI for various income ranges: 1.1% for AGIs below $25k , 0.6% for AGIs $25k-50k , 0.1% for AGIs $50k-75k , 0.3% for AGIs $75k-100k ) Net capital gain/loss in AGI: +$1,876 (reported on 4.0% of returns )Here:
+$1,876State:
+$33,127
(% of AGI for various income ranges: 0.4% for AGIs $50k-75k , 1.6% for AGIs $100k-200k ) Profit/loss from business: +$7,393 (reported on 8.3% of returns )Here:
+$7,393State:
+$12,567
(% of AGI for various income ranges: 4.1% for AGIs below $25k , 1.6% for AGIs $25k-50k , 1.2% for AGIs $50k-75k , 1.0% for AGIs $75k-100k , 1.4% for AGIs $100k-200k ) Taxable individual retirement arrangement distribution: $10,650 (reported on 4.1% of returns )89433:
$10,650Nevada:
$20,808
(% of AGI for various income ranges: 1.3% for AGIs below $25k , 0.9% for AGIs $25k-50k , 1.2% for AGIs $50k-75k , 1.8% for AGIs $75k-100k , 3.0% for AGIs $100k-200k ) Total itemized deductions: $15,217 (27% of AGI, reported on 13.9% of returns )Here:
$15,217State:
$26,148
Here:
27.2% of AGIState:
20.0% of AGI
(% of AGI for various income ranges: 3.8% for AGIs below $25k , 5.6% for AGIs $25k-50k , 7.8% for AGIs $50k-75k , 8.6% for AGIs $75k-100k , 9.8% for AGIs $100k-200k ) Charity contributions: $2,121 (reported on 9.2% of returns )(% of AGI for various income ranges: 0.2% for AGIs below $25k , 0.4% for AGIs $25k-50k , 0.8% for AGIs $50k-75k , 0.7% for AGIs $75k-100k , 1.7% for AGIs $100k-200k ) Taxes paid: $2,414 (reported on 13.4% of returns )(% of AGI for various income ranges: 0.4% for AGIs below $25k , 0.9% for AGIs $25k-50k , 1.2% for AGIs $50k-75k , 1.4% for AGIs $75k-100k , 1.6% for AGIs $100k-200k ) Earned income credit: $2,350 (reported on 28.3% of returns )(% of AGI for various income ranges: 7.5% for AGIs below $25k , 1.6% for AGIs $25k-50k ) Percentage of individuals using paid preparers for their 2012 taxes: 49.0%(% for various income ranges: 47.0% for AGIs below $25k , 50.2% for AGIs $25k-50k , 52.4% for AGIs $50k-75k , 50.0% for AGIs $75k-100k , 52.6% for AGIs $100k-200k )
Averages for the 2004 tax year for zip code 89433, filed in 2005:
Average Adjusted Gross Income (AGI) in 2004: $32,923 (Individual Income Tax Returns) Here:
$32,923State:
$58,367
Salary/wage: $31,344 (reported on 92.2% of returns )Here:
$31,344State:
$42,695
(% of AGI for various income ranges: 90.4% for AGIs below $10k , 87.5% for AGIs $10k-25k , 90.9% for AGIs $25k-50k , 88.9% for AGIs $50k-75k , 86.9% for AGIs $75k-100k , 67.1% for AGIs over 100k ) Taxable interest for individuals: $737 (reported on 19.5% of returns )This zip code:
$737Nevada:
$3,867
(% of AGI for various income ranges: 1.8% for AGIs below $10k , 0.4% for AGIs $10k-25k , 0.3% for AGIs $25k-50k , 0.4% for AGIs $50k-75k , 0.3% for AGIs $75k-100k , 1.2% for AGIs over 100k ) Taxable dividends: $732 (reported on 7.6% of returns )(% of AGI for various income ranges: 0.9% for AGIs below $10k , 0.3% for AGIs $10k-25k , 0.1% for AGIs $25k-50k , 0.1% for AGIs $50k-75k , 0.2% for AGIs $75k-100k , 0.2% for AGIs over 100k ) Net capital gain/loss: +$4,515 (reported on 6.1% of returns )Here:
+$4,515State:
+$50,644
(% of AGI for various income ranges: -0.8% for AGIs below $10k , -0.1% for AGIs $10k-25k , 0.1% for AGIs $25k-50k , 0.5% for AGIs $50k-75k , 1.7% for AGIs $75k-100k , 7.2% for AGIs over 100k ) Profit/loss from business: +$5,979 (reported on 8.7% of returns )Here:
+$5,979State:
+$13,618
(% of AGI for various income ranges: -0.5% for AGIs below $10k , 2.5% for AGIs $10k-25k , 1.6% for AGIs $25k-50k , 1.3% for AGIs $50k-75k , 1.0% for AGIs $75k-100k , 2.5% for AGIs over 100k ) IRA payment deduction: $1,815 (reported on 1.9% of returns )89433:
$1,815Nevada:
$3,054
(% of AGI for various income ranges: 0.2% for AGIs $10k-25k , 0.1% for AGIs $25k-50k , 0.1% for AGIs $50k-75k , 0.1% for AGIs $75k-100k ) Total itemized deductions: $14,494 (28% of AGI, reported on 26.8% of returns )Here:
$14,494State:
$22,990
Here:
28.0% of AGIState:
21.8% of AGI
(% of AGI for various income ranges: 7.4% for AGIs below $10k , 6.5% for AGIs $10k-25k , 11.9% for AGIs $25k-50k , 14.0% for AGIs $50k-75k , 13.5% for AGIs $75k-100k , 13.5% for AGIs over 100k ) Charity contributions deductions: $1,415 (3% of AGI, reported on 20.7% of returns )Here:
2.6% of AGIState:
3.1% of AGI
(% of AGI for various income ranges: 0.2% for AGIs below $10k , 0.4% for AGIs $10k-25k , 0.8% for AGIs $25k-50k , 1.1% for AGIs $50k-75k , 1.4% for AGIs $75k-100k , 1.0% for AGIs over 100k ) Total tax: $3,254 (reported on 70.4% of returns )89433:
$3,254State:
$10,585
(% of AGI for various income ranges: 1.7% for AGIs below $10k , 3.6% for AGIs $10k-25k , 5.8% for AGIs $25k-50k , 7.6% for AGIs $50k-75k , 10.1% for AGIs $75k-100k , 14.9% for AGIs over 100k ) Earned income credit: $1,703 (reported on 20.5% of returns )Percentage of individuals using paid preparers for their 2004 taxes: 59.4%(% for various income ranges: 53.1% for AGIs below $10k , 62.8% for AGIs $10k-25k , 59.2% for AGIs $25k-50k , 60.0% for AGIs $50k-75k , 56.7% for AGIs $75k-100k , 63.3% for AGIs over 100k )
Estimated median household income in 2022: This zip code:
$70,454Nevada:
$72,333
Nearest zip codes: 89512 ,
89431 ,
89436 ,
89501 ,
89503 ,
89506 .
Sparks Zip Code Map
Percentage of family households: This zip code:
56.9%Nevada:
45.2%
Percentage of households with unmarried partners: This zip code:
9.6%Nevada:
44.2%
Likely homosexual households (counted as self-reported same-sex unmarried-partner households)
Lesbian couples: 0.7% of all households Gay men: 0.2% of all households
Household received Food Stamps/SNAP in the past 12 months: 2,071Household did not receive Food Stamps/SNAP in the past 12 months: 5,451
Women who had a birth in the past 12 months: 408 (425 now married , 25 unmarried) Women who did not have a birth in the past 12 months: 5,291 (2,018 now married , 3,278 unmarried)
Housing units in zip code 89433 with a mortgage: 3,281 (324
second mortgage , 32
home equity loan , 189
both second mortgage and home equity loan )
Houses without a mortgage: 27
Median monthly owner costs for units with a mortgage: $1,502
Median monthly owner costs for units without a mortgage: $382
Residents with income below the poverty level in 2022:
This zip code:
15.7%Whole state:
12.5%
Residents with income below 50% of the poverty level in 2022:
This zip code:
11.5%Whole state:
5.9%
Median number of rooms in houses and condos: Median number of rooms in apartments:
Year house built (houses)
124 2020 or later399 2010 to 2019611 2000 to 20092,534 1990 to 19991,247 1980 to 19891,586 1970 to 1979436 1960 to 1969155 1950 to 1959142 1940 to 194922 1939 or earlier
Zip code 89433 household income distribution in 2022 202 Less than $10,000169 $10,000 to $14,999284 $15,000 to $19,999324 $20,000 to $24,999272 $25,000 to $29,999285 $30,000 to $34,999482 $35,000 to $39,999257 $40,000 to $44,999356 $45,000 to $49,999526 $50,000 to $59,999808 $60,000 to $74,9991,066 $75,000 to $99,9991,072 $100,000 to $124,999599 $125,000 to $149,999407 $150,000 to $199,999254 $200,000 or moreEstimate of home value of owner-occupied houses/condos in 2022 in zip code 89433 40 $10,000 to $14,99998 $15,000 to $19,9999 $20,000 to $24,99984 $25,000 to $29,99957 $35,000 to $39,99980 $40,000 to $49,99934 $50,000 to $59,99924 $60,000 to $69,99947 $70,000 to $79,99978 $80,000 to $89,99910 $90,000 to $99,999227 $100,000 to $124,99964 $125,000 to $149,999113 $150,000 to $174,999161 $175,000 to $199,999387 $200,000 to $249,999362 $250,000 to $299,9991,432 $300,000 to $399,999690 $400,000 to $499,999311 $500,000 to $749,999Rent paid by renters in 2022 in zip code 89433 4 $200 to $24912 $250 to $2996 $350 to $39914 $450 to $499332 $500 to $54946 $550 to $59966 $600 to $64971 $650 to $69975 $700 to $7493 $750 to $799245 $800 to $899125 $900 to $999488 $1,000 to $1,249209 $1,250 to $1,499178 $1,500 to $1,999125 $2,000 to $2,49969 No cash rent
Median gross rent in 2022: $1,220.
Median price asked for vacant for-sale houses and condos in 2022: $361,419.
Estimated median house (or condo) value in 2022 for: White Non-Hispanic householders: $437,399Black or African American householders: $407,417American Indian or Alaska Native householders: $259,508Asian householders: $482,371Some other race householders: $443,062Two or more races householders: $365,443Hispanic or Latino householders: $417,744Estimated median house or condo value in 2022: $332,130
89433:
$332,130Nevada:
$434,700
Lower value quartile - upper value quartile: $216,179 - $447,089
Mean price in 2022: Detached houses: $292,113Here:
$292,113State:
$549,327
Mobile homes: $105,670Here:
$105,670State:
$159,995
Housing units in structures:
One, detached: 3,024One, attached: 31Two: 403 or 4: 1215 to 9: 6110 to 19: 6820 to 49: 18550 or more: 77Mobile homes: 4,111Unemployment : 4.5%
Means of transportation to work in zip code 89433 68.3% 7,501 Drove a car alone22.3% 2,450 Carpooled1.4% 158 Bus or trolley bus0.5% 50 Motorcycle0.7% 73 Walked2.0% 218 Other means3.1% 338 Worked at homeTravel time to work (commute) in zip code 89433 99 Less than 5 minutes276 5 to 9 minutes1,192 10 to 14 minutes2,434 15 to 19 minutes2,520 20 to 24 minutes718 25 to 29 minutes1,400 30 to 34 minutes180 35 to 39 minutes282 40 to 44 minutes395 45 to 59 minutes681 60 to 89 minutes175 90 or more minutes
Percentage of zip code residents living and working in this county: 97.2%
Household type by relationship:
Households: 24,043
Male householders: 3,744 (820 living alone ), Female householders: 3,648 (401 living alone )3,564 spouses (3,477 opposite-sex spouses ), 612 unmarried partners , (599 opposite-sex unmarried partners ), 8,646 children (8,068 natural , 196 adopted , 375 stepchildren ), 1,322 grandchildren , 325 brothers or sisters , 481 parents , 18 foster children , 867 other relatives , 861 non-relatives
Size of family households: 1,313 2-persons , 1,573 3-persons , 1,119 4-persons , 835 5-persons , 395 6-persons , 467 7-or-more-persons
Size of nonfamily households: 1,224 1-person , 253 2-persons , 120 3-persons , 86 4-persons
3,676 married couples with children. single-parent households (383 men , 1,238 women ).
64.3% of residents of 89433 zip code speak English at home. of residents speak Spanish at home (69% very well, 19% well, 10% not well, 3% not at all ).of residents speak other Indo-European language at home (83% very well, 17% not well ).of residents speak Asian or Pacific Island language at home (66% very well, 34% well ).
Foreign born population: 4,202 (17.5%)
(41.0%
of them are naturalized citizens )
This zip code:
17.5%Whole state:
18.9%
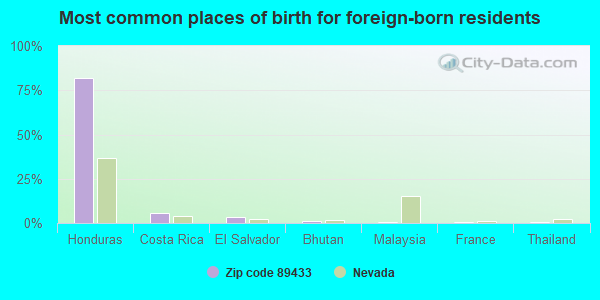
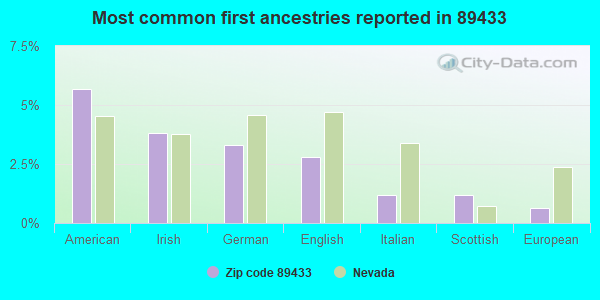
82% Honduras 6% Costa Rica 3% El Salvador 1% Bhutan 1% Malaysia 1% France 1% Thailand 6% American 4% Irish 3% German 3% English 1% Italian 1% Scottish 1% European
Year of entry for the foreign-born population
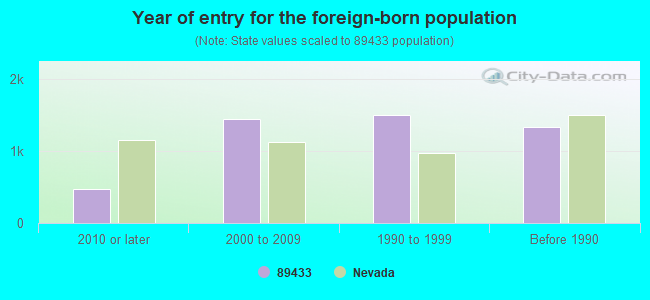
467 2010 or later 1,438 2000 to 2009 1,497 1990 to 1999 1,331 Before 1990
Facilities with environmental interests located in this zip code:
ALLEN, LOIS ELEM (5155 MCGUFFY ROAD in SPARKS, NV)
(National Center for Education Statistics) - STATE ID-16-266 Organizations: WASHOE CO SCH DIST (SCHOOL DISTRICT)
BENNETT, ESTHER ELEM (5900 SIDEHILL DR. in SPARKS, NV)
(National Center for Education Statistics) - STATE ID-16-275 Organizations: WASHOE CO SCH DIST (SCHOOL DISTRICT)
GLENDALE WWTP (1205 S 21ST ST in SPARKS, NV)
National Pollutant Discharge Elimination System NON-MAJOR (Tracking pollutant discharge elimination systems) - permit Conditionally Exempt Small Quantity Generators, less than 100 kg/month of hazardous waste (Resource Conservation and Recovery Act (tracking hazardous waste)) - notification HAZARDOUS WASTE BIENNIAL REPORTER (Resource Conservation and Recovery Act (tracking hazardous waste)) Business SIC classification: WATER SUPPLYOrganizations: SIERRA PACIFIC POWER CO (CONTACT/OWNER)
Alternative names: SIERRA PACIFIC POWER, SPPCO GLENDALE WTP
SUN VALLEY TEXACO (5505 SUN VALLEY BLVD in SUN VALLEY, NV)
(Resource Conservation and Recovery Act (tracking hazardous waste)) Organizations: VINCE CAMPANARO (CONTACT/OWNER)
AAA AUTO SALES AND SERVICE (5520 SUN VALLEY BLVD in SUN VALLEY, NV)
(Resource Conservation and Recovery Act (tracking hazardous waste)) Organizations: CARL A BAILEY (CONTACT/OWNER)
SUPERIOR PERFORMANCE (5200 SUN VALLEY BLVD in SUN VALLEY, NV)
(Resource Conservation and Recovery Act (tracking hazardous waste)) Organizations: BRIAN BACH AND SEAN RYAN (CONTACT/OWNER)
JIMS AUTOMOTIVE SERVICE (5705 TANBERG DR in SUN VALLEY, NV)
Conditionally Exempt Small Quantity Generators, less than 100 kg/month of hazardous waste (Resource Conservation and Recovery Act (tracking hazardous waste)) - notification Business NAICS classification: GENERAL AUTOMOTIVE REPAIR.Organizations: JIM BURKE (CONTACT/OWNER)
RITE AID 6247 (5485 SUN VALLEY BLVD in SUN VALLEY, NV)
Small Quantity Generators, between 100 kg and 1000 kg of hazardous waste/month (Resource Conservation and Recovery Act (tracking hazardous waste)) - notification
Housing units lacking complete plumbing facilities: 0.4%
Housing units lacking complete kitchen facilities: 1.7%
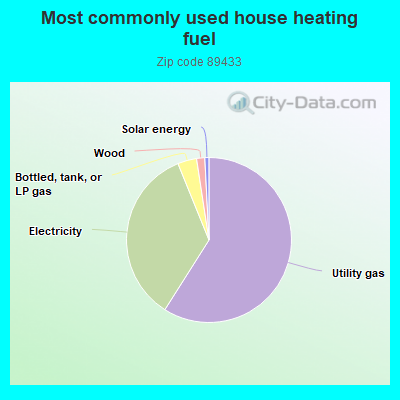
58.7% Utility gas 34.7% Electricity 3.7% Bottled, tank, or LP gas 1.6% Wood 0.8% Solar energy
Population in 1990: 11,261. Population change in the 1990s: +8,503 (+75.5%).
Place of birth for U.S.-born residents:
This state: 10,801Northeast: 599Midwest: 935South: 501West: 6,449
39% of the 89433 zip code residents lived in the same house 5 years ago.
Out of people who lived in different houses, 69% lived in this county.
Out of people who lived in different counties, 50% lived in Nevada.
96% of the 89433 zip code residents lived in the same house 1 year ago.
Out of people who lived in different houses, 105% moved from this county.
Out of people who lived in different houses, 5% moved from different county within same state.
Out of people who lived in different houses, 13% moved from different state.
Private vs. public school enrollment:
Students in private schools in grades 1 to 8 (elementary and middle school): 65
Students in private schools in grades 9 to 12 (high school): 76
Students in private undergraduate colleges: 46
Occupation by median earnings in the past 12 months ($)
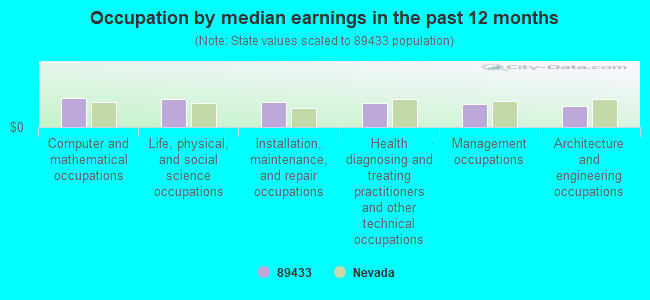
74,528 Computer and mathematical occupations 71,044 Life, physical, and social science occupations 63,543 Installation, maintenance, and repair occupations 60,858 Health diagnosing and treating practitioners and other technical occupations 59,404 Management occupations 53,020 Architecture and engineering occupations
Top industries in this zip code by the number of employees in 2005:
Arts, Entertainment, and Recreation: Other Gambling Industries (100-249 employees: 1 establishment, 1-4 employees: 2 establishments)Accommodation and Food Services: Limited-Service Restaurants (20-49: 2, 10-19: 1, 1-4: 2)Health Care and Social Assistance: Child Day Care Services (20-49: 1, 5-9: 1, 1-4: 2)Administrative and Support and Waste Management and Remediation Services: Temporary Help Services (20-49: 1)Construction: Painting and Wall Covering Contractors (10-19: 2, 1-4: 1)Finance and Insurance: Commercial Banking (10-19: 2)Administrative and Support and Waste Management and Remediation Services: Janitorial Services (10-19: 1, 5-9: 1, 1-4: 1)
People in group quarters in 2000:
12 people in unknown juvenile institutions
Fatal accident statistics in 2014:
Fatal accident count: 2Vehicles involved in fatal accidents: 3Fatal accidents caused by drunken drivers: 1Fatalities: 2Persons involved in fatal accidents: 8Pedestrians involved in fatal accidents: 0
Fatal accident statistics in 2011:
Fatal accident count: 1Vehicles involved in fatal accidents: 2Fatal accidents caused by drunken drivers: 0Fatalities: 1Persons involved in fatal accidents: 2Pedestrians involved in fatal accidents: 0
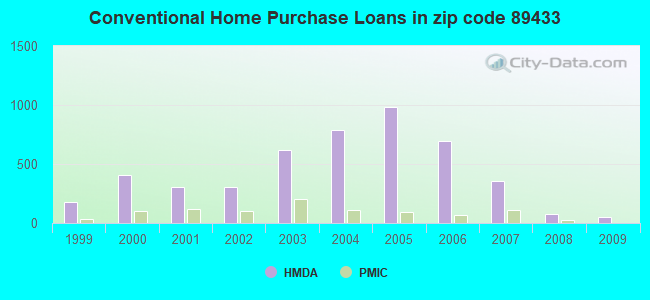
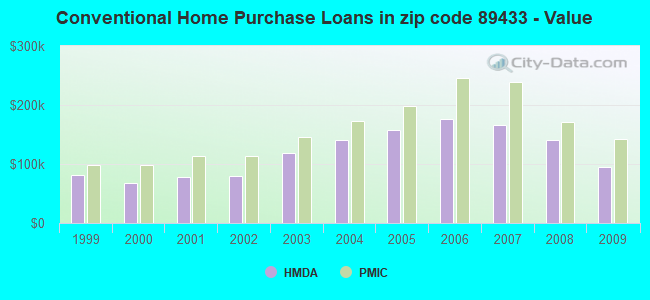
Home Mortgage Disclosure Act Aggregated Statistics For Year 2009(Based on 6 partial tracts) A) FHA, FSA/RHS & VA B) Conventional C) Refinancings D) Home Improvement Loans F) Non-occupant Loans on G) Loans On Manufactured Number Average Value Number Average Value Number Average Value Number Average Value Number Average Value Number Average Value
LOANS ORIGINATED 228 $133,480 50 $95,160 280 $162,296 16 $47,069 23 $95,592 116 $138,466 APPLICATIONS APPROVED, NOT ACCEPTED 9 $127,181 6 $106,010 23 $139,192 0 $0 3 $81,947 20 $137,298 APPLICATIONS DENIED 47 $122,512 26 $72,281 195 $155,034 38 $28,995 14 $97,455 113 $98,168 APPLICATIONS WITHDRAWN 26 $131,727 17 $90,639 113 $138,888 1 $79,260 8 $103,925 37 $98,561 FILES CLOSED FOR INCOMPLETENESS 3 $134,340 0 $0 26 $128,927 0 $0 2 $125,945 10 $111,816
Aggregated Statistics For Year 2008(Based on 6 partial tracts) A) FHA, FSA/RHS & VA B) Conventional C) Refinancings D) Home Improvement Loans F) Non-occupant Loans on G) Loans On Manufactured Number Average Value Number Average Value Number Average Value Number Average Value Number Average Value Number Average Value
LOANS ORIGINATED 172 $184,205 75 $140,404 220 $161,842 21 $96,112 32 $150,698 133 $141,041 APPLICATIONS APPROVED, NOT ACCEPTED 7 $224,416 19 $130,823 49 $155,485 9 $32,266 8 $122,315 36 $128,363 APPLICATIONS DENIED 35 $168,192 45 $141,505 442 $169,460 85 $70,381 19 $107,309 228 $124,523 APPLICATIONS WITHDRAWN 28 $178,810 21 $112,922 136 $169,838 11 $96,840 12 $131,665 71 $139,069 FILES CLOSED FOR INCOMPLETENESS 0 $0 3 $175,543 34 $160,648 6 $106,785 0 $0 17 $126,879
Aggregated Statistics For Year 2007(Based on 6 partial tracts) A) FHA, FSA/RHS & VA B) Conventional C) Refinancings D) Home Improvement Loans F) Non-occupant Loans on G) Loans On Manufactured Number Average Value Number Average Value Number Average Value Number Average Value Number Average Value Number Average Value
LOANS ORIGINATED 144 $198,393 353 $166,621 611 $174,725 85 $89,694 66 $146,647 330 $138,576 APPLICATIONS APPROVED, NOT ACCEPTED 9 $207,964 77 $144,366 162 $188,799 16 $115,574 26 $164,021 60 $122,190 APPLICATIONS DENIED 29 $203,516 128 $172,581 803 $181,767 141 $72,709 49 $140,362 282 $120,880 APPLICATIONS WITHDRAWN 20 $200,949 72 $187,477 332 $190,158 43 $152,624 10 $202,515 110 $132,948 FILES CLOSED FOR INCOMPLETENESS 3 $185,473 10 $231,339 86 $213,393 10 $67,607 3 $198,680 16 $126,623
Aggregated Statistics For Year 2006(Based on 6 partial tracts) A) FHA, FSA/RHS & VA B) Conventional C) Refinancings D) Home Improvement Loans F) Non-occupant Loans on G) Loans On Manufactured Number Average Value Number Average Value Number Average Value Number Average Value Number Average Value Number Average Value
LOANS ORIGINATED 142 $173,476 697 $176,611 964 $180,052 157 $90,124 110 $168,274 401 $130,090 APPLICATIONS APPROVED, NOT ACCEPTED 8 $201,074 118 $175,258 154 $163,525 27 $63,216 16 $140,761 56 $116,142 APPLICATIONS DENIED 24 $201,248 186 $167,938 808 $171,168 234 $94,777 55 $119,181 335 $113,661 APPLICATIONS WITHDRAWN 36 $182,745 257 $198,246 505 $192,344 79 $111,012 50 $132,255 156 $129,970 FILES CLOSED FOR INCOMPLETENESS 6 $175,372 23 $190,915 108 $196,755 11 $119,325 1 $200,180 15 $135,466
Aggregated Statistics For Year 2005(Based on 6 partial tracts) A) FHA, FSA/RHS & VA B) Conventional C) Refinancings D) Home Improvement Loans E) Loans on Dwellings For 5+ Families F) Non-occupant Loans on G) Loans On Manufactured Number Average Value Number Average Value Number Average Value Number Average Value Number Average Value Number Average Value Number Average Value
LOANS ORIGINATED 148 $167,916 984 $156,903 1,314 $178,094 170 $99,958 1 $153,150 224 $147,420 485 $124,802 APPLICATIONS APPROVED, NOT ACCEPTED 18 $173,534 153 $141,834 177 $165,742 33 $79,591 0 $0 31 $119,671 47 $131,751 APPLICATIONS DENIED 50 $166,381 305 $139,558 868 $152,703 190 $73,703 0 $0 78 $125,794 415 $106,459 APPLICATIONS WITHDRAWN 36 $178,361 208 $145,631 669 $167,510 97 $144,306 0 $0 54 $161,137 235 $121,701 FILES CLOSED FOR INCOMPLETENESS 3 $184,940 33 $147,312 157 $164,347 8 $131,285 0 $0 6 $134,813 48 $126,222
Aggregated Statistics For Year 2004(Based on 6 partial tracts) A) FHA, FSA/RHS & VA B) Conventional C) Refinancings D) Home Improvement Loans F) Non-occupant Loans on G) Loans On Manufactured Number Average Value Number Average Value Number Average Value Number Average Value Number Average Value Number Average Value
LOANS ORIGINATED 169 $159,563 788 $141,368 1,213 $148,588 128 $80,983 207 $115,442 381 $110,636 APPLICATIONS APPROVED, NOT ACCEPTED 21 $159,038 129 $133,657 237 $137,835 29 $70,268 32 $117,582 100 $111,779 APPLICATIONS DENIED 35 $142,077 215 $109,914 835 $122,107 184 $50,862 73 $96,400 301 $94,420 APPLICATIONS WITHDRAWN 40 $151,963 129 $104,779 457 $136,300 56 $68,050 17 $88,373 147 $104,475 FILES CLOSED FOR INCOMPLETENESS 1 $192,110 13 $131,926 110 $153,167 7 $69,034 2 $192,565 18 $104,407
Aggregated Statistics For Year 2003(Based on 6 partial tracts) A) FHA, FSA/RHS & VA B) Conventional C) Refinancings D) Home Improvement Loans F) Non-occupant Loans on Number Average Value Number Average Value Number Average Value Number Average Value Number Average Value
LOANS ORIGINATED 257 $145,914 616 $119,139 1,876 $116,404 58 $31,506 151 $97,384 APPLICATIONS APPROVED, NOT ACCEPTED 16 $99,911 65 $125,650 277 $106,529 9 $29,903 23 $95,443 APPLICATIONS DENIED 32 $126,707 134 $94,157 961 $103,634 106 $33,133 79 $64,744 APPLICATIONS WITHDRAWN 18 $131,248 61 $98,968 611 $110,867 10 $39,057 18 $103,075 FILES CLOSED FOR INCOMPLETENESS 1 $106,130 7 $119,867 86 $119,391 2 $58,480 3 $61,350
Aggregated Statistics For Year 2002(Based on 4 partial tracts) A) FHA, FSA/RHS & VA B) Conventional C) Refinancings D) Home Improvement Loans F) Non-occupant Loans on Number Average Value Number Average Value Number Average Value Number Average Value Number Average Value
LOANS ORIGINATED 188 $126,799 301 $80,134 676 $97,142 52 $20,778 93 $61,553 APPLICATIONS APPROVED, NOT ACCEPTED 18 $93,757 59 $97,367 141 $87,598 17 $17,714 7 $103,826 APPLICATIONS DENIED 35 $112,177 163 $56,274 492 $82,859 75 $22,348 35 $44,111 APPLICATIONS WITHDRAWN 25 $104,290 44 $82,003 300 $113,911 16 $41,398 14 $65,607 FILES CLOSED FOR INCOMPLETENESS 3 $141,193 8 $67,802 34 $96,415 0 $0 5 $50,742
Aggregated Statistics For Year 2001(Based on 4 partial tracts) A) FHA, FSA/RHS & VA B) Conventional C) Refinancings D) Home Improvement Loans E) Loans on Dwellings For 5+ Families F) Non-occupant Loans on Number Average Value Number Average Value Number Average Value Number Average Value Number Average Value Number Average Value
LOANS ORIGINATED 211 $120,868 304 $78,415 547 $86,675 42 $31,258 2 $7,310,860 76 $67,471 APPLICATIONS APPROVED, NOT ACCEPTED 7 $132,037 86 $59,166 72 $71,217 15 $22,317 0 $0 9 $53,190 APPLICATIONS DENIED 15 $116,393 504 $53,547 523 $67,959 109 $16,836 0 $0 30 $48,172 APPLICATIONS WITHDRAWN 48 $105,785 92 $82,341 321 $109,990 33 $57,778 0 $0 17 $82,483 FILES CLOSED FOR INCOMPLETENESS 3 $140,160 3 $145,010 78 $97,474 4 $21,830 0 $0 3 $65,203
Aggregated Statistics For Year 2000(Based on 4 partial tracts) A) FHA, FSA/RHS & VA B) Conventional C) Refinancings D) Home Improvement Loans E) Loans on Dwellings For 5+ Families F) Non-occupant Loans on Number Average Value Number Average Value Number Average Value Number Average Value Number Average Value Number Average Value
LOANS ORIGINATED 111 $115,077 408 $68,447 176 $59,431 65 $19,979 4 $120,905 49 $52,944 APPLICATIONS APPROVED, NOT ACCEPTED 10 $94,170 125 $56,347 74 $61,962 44 $24,731 1 $139,710 9 $30,800 APPLICATIONS DENIED 20 $105,901 1,046 $52,545 312 $45,734 146 $21,445 1 $137,030 34 $47,392 APPLICATIONS WITHDRAWN 13 $134,188 79 $67,771 84 $66,690 18 $20,627 0 $0 1 $107,470 FILES CLOSED FOR INCOMPLETENESS 1 $120,910 4 $77,582 32 $87,228 0 $0 0 $0 0 $0
Aggregated Statistics For Year 1999(Based on 2 partial tracts) A) FHA, FSA/RHS & VA B) Conventional C) Refinancings D) Home Improvement Loans E) Loans on Dwellings For 5+ Families F) Non-occupant Loans on Number Average Value Number Average Value Number Average Value Number Average Value Number Average Value Number Average Value
LOANS ORIGINATED 171 $122,403 176 $81,521 177 $69,179 37 $25,258 1 $76,520 27 $65,367 APPLICATIONS APPROVED, NOT ACCEPTED 14 $132,879 63 $64,758 59 $60,185 22 $25,571 0 $0 8 $80,619 APPLICATIONS DENIED 10 $113,173 296 $57,692 170 $61,710 58 $17,955 1 $322,540 24 $52,212 APPLICATIONS WITHDRAWN 44 $121,837 38 $88,435 71 $79,280 5 $34,752 0 $0 10 $66,485 FILES CLOSED FOR INCOMPLETENESS 2 $115,780 3 $75,247 19 $78,191 0 $0 0 $0 2 $49,885
Detailed HMDA statistics for the following Tracts:
0027.01
,
0027.02 ,
0035.03
Private Mortgage Insurance Companies Aggregated Statistics For Year 2009(Based on 6 partial tracts) A) Conventional C) Non-occupant Loans on Number Average Value Number Average Value
LOANS ORIGINATED 2 $141,860 0 $0 APPLICATIONS APPROVED, NOT ACCEPTED 2 $38,255 0 $0 APPLICATIONS DENIED 1 $96,720 0 $0 APPLICATIONS WITHDRAWN 0 $0 0 $0 FILES CLOSED FOR INCOMPLETENESS 1 $193,450 1 $193,450
Aggregated Statistics For Year 2008(Based on 6 partial tracts) A) Conventional B) Refinancings C) Non-occupant Loans on D) Loans On Manufactured Number Average Value Number Average Value Number Average Value Number Average Value
LOANS ORIGINATED 23 $171,439 29 $217,941 11 $173,334 3 $140,523 APPLICATIONS APPROVED, NOT ACCEPTED 17 $209,991 12 $222,732 4 $141,750 1 $205,540 APPLICATIONS DENIED 6 $114,550 4 $219,310 4 $179,680 0 $0 APPLICATIONS WITHDRAWN 4 $183,710 0 $0 1 $190,760 1 $190,760 FILES CLOSED FOR INCOMPLETENESS 0 $0 0 $0 0 $0 0 $0
Aggregated Statistics For Year 2007(Based on 6 partial tracts) A) Conventional B) Refinancings C) Non-occupant Loans on D) Loans On Manufactured Number Average Value Number Average Value Number Average Value Number Average Value
LOANS ORIGINATED 108 $239,048 68 $243,028 13 $220,454 11 $161,992 APPLICATIONS APPROVED, NOT ACCEPTED 17 $282,298 13 $236,147 0 $0 2 $124,965 APPLICATIONS DENIED 4 $218,835 0 $0 0 $0 1 $235,100 APPLICATIONS WITHDRAWN 5 $308,064 3 $306,267 0 $0 1 $280,770 FILES CLOSED FOR INCOMPLETENESS 1 $437,470 1 $335,850 0 $0 0 $0
Aggregated Statistics For Year 2006(Based on 6 partial tracts) A) Conventional B) Refinancings C) Non-occupant Loans on D) Loans On Manufactured Number Average Value Number Average Value Number Average Value Number Average Value
LOANS ORIGINATED 71 $246,122 36 $277,582 6 $191,930 13 $182,398 APPLICATIONS APPROVED, NOT ACCEPTED 25 $279,156 7 $226,074 2 $275,525 0 $0 APPLICATIONS DENIED 1 $417,230 0 $0 0 $0 0 $0 APPLICATIONS WITHDRAWN 8 $249,832 0 $0 0 $0 2 $141,965 FILES CLOSED FOR INCOMPLETENESS 0 $0 0 $0 0 $0 0 $0
Aggregated Statistics For Year 2005(Based on 6 partial tracts) A) Conventional B) Refinancings C) Non-occupant Loans on D) Loans On Manufactured Number Average Value Number Average Value Number Average Value Number Average Value
LOANS ORIGINATED 93 $197,610 38 $238,419 8 $138,096 24 $154,437 APPLICATIONS APPROVED, NOT ACCEPTED 17 $177,940 21 $195,697 2 $108,815 9 $141,596 APPLICATIONS DENIED 0 $0 1 $327,790 0 $0 0 $0 APPLICATIONS WITHDRAWN 7 $171,534 1 $288,830 3 $102,013 0 $0 FILES CLOSED FOR INCOMPLETENESS 0 $0 0 $0 0 $0 0 $0
Aggregated Statistics For Year 2004(Based on 6 partial tracts) A) Conventional B) Refinancings C) Non-occupant Loans on D) Loans On Manufactured Number Average Value Number Average Value Number Average Value Number Average Value
LOANS ORIGINATED 110 $172,435 59 $169,962 19 $157,806 13 $130,267 APPLICATIONS APPROVED, NOT ACCEPTED 25 $149,677 20 $149,683 5 $80,250 3 $100,753 APPLICATIONS DENIED 5 $124,834 3 $125,383 2 $79,910 1 $181,360 APPLICATIONS WITHDRAWN 1 $236,170 6 $183,970 0 $0 0 $0 FILES CLOSED FOR INCOMPLETENESS 2 $236,285 0 $0 0 $0 1 $243,160
Aggregated Statistics For Year 2003(Based on 6 partial tracts) A) Conventional B) Refinancings C) Non-occupant Loans on Number Average Value Number Average Value Number Average Value
LOANS ORIGINATED 201 $145,273 269 $133,752 21 $100,550 APPLICATIONS APPROVED, NOT ACCEPTED 21 $130,753 49 $141,376 6 $90,337 APPLICATIONS DENIED 8 $129,303 1 $85,980 0 $0 APPLICATIONS WITHDRAWN 4 $135,012 14 $123,192 0 $0 FILES CLOSED FOR INCOMPLETENESS 0 $0 0 $0 0 $0
Aggregated Statistics For Year 2002(Based on 4 partial tracts) A) Conventional B) Refinancings C) Non-occupant Loans on Number Average Value Number Average Value Number Average Value
LOANS ORIGINATED 104 $114,284 136 $115,132 16 $95,468 APPLICATIONS APPROVED, NOT ACCEPTED 24 $97,480 19 $112,737 3 $69,707 APPLICATIONS DENIED 0 $0 2 $90,960 0 $0 APPLICATIONS WITHDRAWN 4 $62,458 9 $122,580 3 $32,677 FILES CLOSED FOR INCOMPLETENESS 0 $0 1 $139,710 1 $139,710
Aggregated Statistics For Year 2001(Based on 4 partial tracts) A) Conventional B) Refinancings C) Non-occupant Loans on Number Average Value Number Average Value Number Average Value
LOANS ORIGINATED 115 $114,138 91 $111,402 18 $97,534 APPLICATIONS APPROVED, NOT ACCEPTED 16 $98,326 12 $102,007 1 $146,430 APPLICATIONS DENIED 6 $100,715 0 $0 1 $84,630 APPLICATIONS WITHDRAWN 3 $124,490 0 $0 1 $196,140 FILES CLOSED FOR INCOMPLETENESS 0 $0 0 $0 0 $0
Aggregated Statistics For Year 2000(Based on 4 partial tracts) A) Conventional B) Refinancings C) Non-occupant Loans on Number Average Value Number Average Value Number Average Value
LOANS ORIGINATED 104 $98,740 22 $89,894 10 $88,225 APPLICATIONS APPROVED, NOT ACCEPTED 30 $96,454 7 $90,640 3 $66,723 APPLICATIONS DENIED 15 $95,435 0 $0 1 $166,580 APPLICATIONS WITHDRAWN 3 $91,527 0 $0 0 $0 FILES CLOSED FOR INCOMPLETENESS 0 $0 0 $0 0 $0
Aggregated Statistics For Year 1999(Based on 2 partial tracts) A) Conventional B) Refinancings C) Non-occupant Loans on Number Average Value Number Average Value Number Average Value
LOANS ORIGINATED 36 $98,246 24 $98,352 1 $54,370 APPLICATIONS APPROVED, NOT ACCEPTED 4 $95,395 1 $155,050 0 $0 APPLICATIONS DENIED 1 $130,210 0 $0 0 $0 APPLICATIONS WITHDRAWN 1 $169,140 0 $0 0 $0 FILES CLOSED FOR INCOMPLETENESS 1 $161,760 0 $0 0 $0
Detailed PMIC statistics for the following Tracts:
0027.01
,
0027.02 ,
0035.03
2003 - 2018 National Fire Incident Reporting System (NFIRS) incidents See full 2006 National Fire Incident Reporting System statistics for zip code 89433, Nevada
Most common first names in zip code 89433 among deceased individuals Name Count Lived (average)
Robert 46 66.0 years James 38 69.7 years Mary 38 77.6 years John 34 71.6 years William 27 68.6 years Richard 22 64.9 years Charles 21 74.9 years Donald 19 70.2 years George 17 74.6 years Betty 16 73.8 years
Most common last names in zip code 89433 among deceased individuals Last name Count Lived (average)
Brown 21 73.6 years Smith 19 68.8 years Johnson 14 69.4 years Jones 11 71.5 years Miller 11 74.7 years Nelson 9 68.9 years Martin 8 75.0 years Anderson 8 68.4 years Lewis 7 71.6 years Morris 7 74.4 years
Businesses in zip code 89433
Name Count Name Count
AutoZone 1 Kroger 1 CVS 1 McDonald's 1 Cricket Wireless 1 Subway 1 H&R Block 1 Taco Bell 1


 Nearest zip codes: 89512, 89431, 89436, 89501, 89503, 89506.
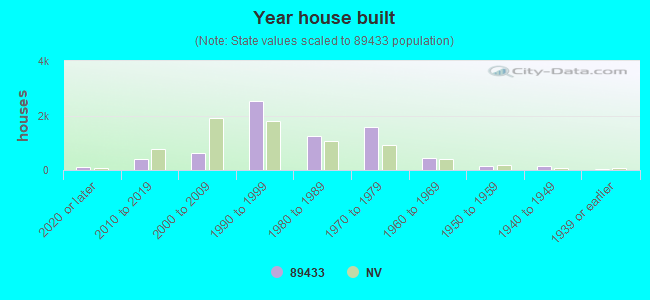


 According to the data from the years 2003 - 2018 the average number of fire incidents per year is 55. The highest number of reported fire incidents - 83 took place in 2017, and the least - 25 in 2005. The data has a rising trend.
 When looking into fire subcategories, the most incidents belonged to: Outside Fires (42.5%), and Structure Fires (41.1%).