Estimated zip code population in 2022: 56,157 Zip code population in 2010: 59,185 Zip code population in 2000: 62,765
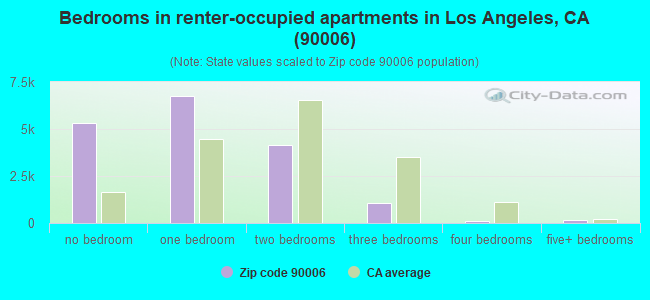
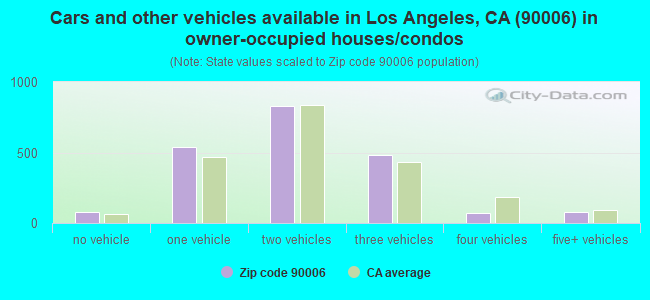
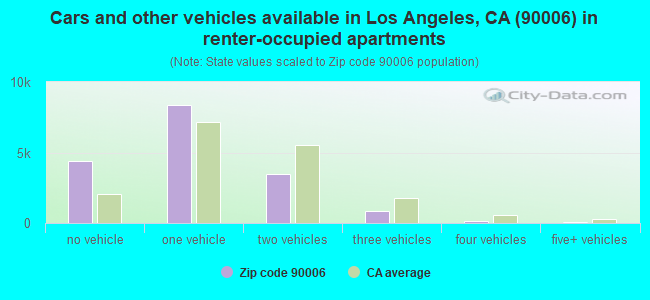
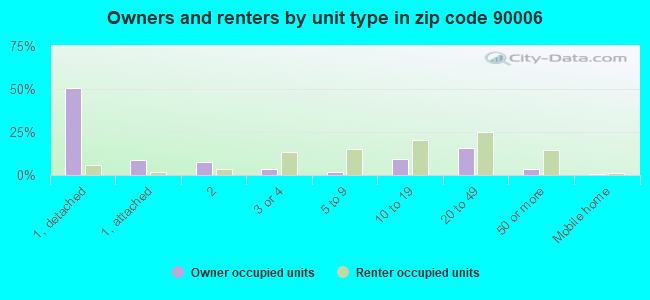
Houses and condos: 21,549 Renter-occupied apartments: 17,288
% of renters here:
89%
State:
44%
March 2022 cost of living index in zip code 90006: 147.7 (very high, U.S. average is 100)
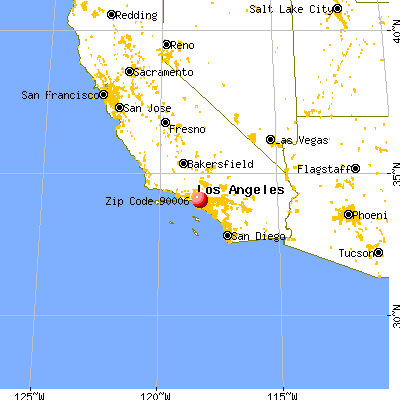
Land area: 1.9 sq. mi. Water area: 0.0 sq. mi.
Population density: 29,252 people per square mile
(very high).
OSM Map
General Map
Google Map
MSN Map
OSM Map
General Map
Google Map
MSN Map
OSM Map
General Map
Google Map
MSN Map
OSM Map
General Map
Google Map
MSN Map
Please wait while loading the map...
Real estate property taxes paid for housing units in 2022:
This zip code:
0.5% ($4,277)
California:
0.7% ($4,831)
Median real estate property taxes paid for housing units with mortgages in 2022: $4,097 (0.5%) Median real estate property taxes paid for housing units with no mortgage in 2022: $5,325 (0.7%)
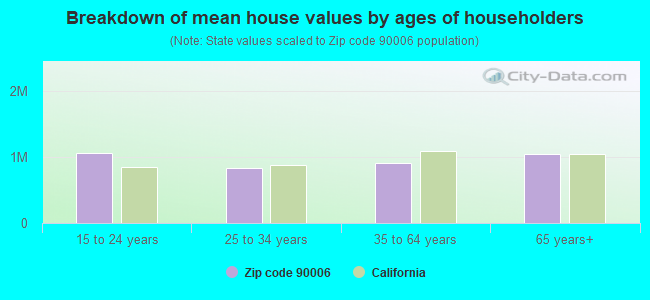
Estimated median house/condo value in 2022: $848,482
90006:
$848,482
California:
$715,900
According to our research of California and other state lists, there were 81 registered sex offenders living in 90006 zip code as of April 25, 2024. The ratio of all residents to sex offenders in zip code 90006 is 767 to 1. The ratio of registered sex offenders to all residents in this zip code is near the state average.
Median resident age:
This zip code:
36.3 years
California median age:
37.9 years
Average household size:
This zip code:
2.8 people
California:
2.8 people
Averages for the 2020 tax year for zip code 90006, filed in 2021:
Average Adjusted Gross Income (AGI) in 2020: $33,925 (Individual Income Tax Returns)
Here:
$33,925
State:
$95,910
Salary/wage: $33,432 (reported on 78.1% of returns)
Here:
$33,432
State:
$77,331
(% of AGI for various income ranges: 1298.6% for AGIs below $25k, 4205.0% for AGIs $25k-50k, 7819.2% for AGIs $50k-75k, 12464.3% for AGIs $75k-100k, 21199.5% for AGIs $100k-200k, 86072.5% for AGIs over 200k)
Taxable interest for individuals: $763 (reported on 11.3% of returns)
This zip code:
$763
California:
$2,294
(% of AGI for various income ranges: 6.3% for AGIs below $25k, 8.4% for AGIs $25k-50k, 19.8% for AGIs $50k-75k, 25.6% for AGIs $75k-100k, 84.8% for AGIs $100k-200k, 1027.5% for AGIs over 200k)
Ordinary dividends: $999 (reported on 5.6% of returns)
Here:
$999
State:
$10,949
(% of AGI for various income ranges: 2.3% for AGIs below $25k, 3.9% for AGIs $25k-50k, 14.0% for AGIs $50k-75k, 20.4% for AGIs $75k-100k, 86.9% for AGIs $100k-200k, 790.0% for AGIs over 200k)
Net capital gain/loss in AGI: +$8,174 (reported on 6.7% of returns)
Here:
+$8,174
State:
+$49,306
(% of AGI for various income ranges: 2.9% for AGIs below $25k, 10.0% for AGIs $25k-50k, 84.9% for AGIs $50k-75k, 120.7% for AGIs $75k-100k, 439.8% for AGIs $100k-200k, 22600.0% for AGIs over 200k)
Profit/loss from business: +$7,691 (reported on 27.1% of returns)
Here:
+$7,691
State:
+$15,671
(% of AGI for various income ranges: 404.1% for AGIs below $25k, 208.2% for AGIs $25k-50k, 228.8% for AGIs $50k-75k, 413.7% for AGIs $75k-100k, 841.4% for AGIs $100k-200k, 6955.0% for AGIs over 200k)
Taxable individual retirement arrangement distribution: $10,725 (reported on 0.8% of returns)
90006:
$10,725
California:
$23,505
(% of AGI for various income ranges: 4.1% for AGIs below $25k, 9.6% for AGIs $25k-50k, 33.1% for AGIs $50k-75k, 180.7% for AGIs $100k-200k)
Total itemized deductions: $28,450 (reported on 3.0% of returns)
Here:
$28,450
State:
$39,517
(% of AGI for various income ranges: 18.1% for AGIs below $25k, 74.5% for AGIs $25k-50k, 233.9% for AGIs $50k-75k, 480.4% for AGIs $75k-100k, 1357.6% for AGIs $100k-200k, 9700.0% for AGIs over 200k)
Charity contributions: $6,033 (reported on 2.2% of returns)
Here:
$6,033
State:
$12,598
(% of AGI for various income ranges: 0.8% for AGIs below $25k, 10.3% for AGIs $25k-50k, 33.2% for AGIs $50k-75k, 53.7% for AGIs $75k-100k, 260.2% for AGIs $100k-200k, 1832.5% for AGIs over 200k)
Taxes paid: $7,232 (reported on 3.0% of returns)
90006:
$7,232
State:
$8,807
(% of AGI for various income ranges: 4.7% for AGIs below $25k, 16.2% for AGIs $25k-50k, 58.3% for AGIs $50k-75k, 140.4% for AGIs $75k-100k, 410.7% for AGIs $100k-200k, 1962.5% for AGIs over 200k)
Earned income credit: $1,898 (reported on 23.4% of returns)
Here:
$1,898
State:
$2,074
(% of AGI for various income ranges: 103.9% for AGIs below $25k, 68.4% for AGIs $25k-50k, 1.1% for AGIs $50k-75k)
Percentage of individuals using paid preparers for their 2020 taxes: 89.4%
Here:
89%
State:
92%
(% for various income ranges: 86.1% for AGIs below $25k, 91.8% for AGIs $25k-50k, 93.3% for AGIs $50k-75k, 94.5% for AGIs $75k-100k, 95.2% for AGIs $100k-200k, 94.4% for AGIs over 200k)
Averages for the 2012 tax year for zip code 90006, filed in 2013:
Average Adjusted Gross Income (AGI) in 2012: $24,604 (Individual Income Tax Returns)
Here:
$24,604
State:
$72,726
Salary/wage: $24,986 (reported on 80.3% of returns)
Here:
$24,986
State:
$59,079
(% of AGI for various income ranges: 75.5% for AGIs below $25k, 90.3% for AGIs $25k-50k, 88.4% for AGIs $50k-75k, 83.8% for AGIs $75k-100k, 75.4% for AGIs $100k-200k, 38.2% for AGIs over 200k)
Taxable interest for individuals: $518 (reported on 10.6% of returns)
This zip code:
$518
California:
$2,146
(% of AGI for various income ranges: 0.1% for AGIs below $25k, 0.2% for AGIs $25k-50k, 0.2% for AGIs $50k-75k, 0.3% for AGIs $75k-100k, 0.3% for AGIs $100k-200k, 1.5% for AGIs over 200k)
Ordinary dividends: $1,827 (reported on 2.3% of returns)
Here:
$1,827
State:
$9,308
(% of AGI for various income ranges: 0.2% for AGIs $50k-75k, 0.2% for AGIs $75k-100k, 1.0% for AGIs $100k-200k)
Net capital gain/loss in AGI: +$4,793 (reported on 2.4% of returns)
Here:
+$4,793
State:
+$30,460
(% of AGI for various income ranges: 0.3% for AGIs $75k-100k, 0.3% for AGIs $100k-200k, 13.4% for AGIs over 200k)
Profit/loss from business: +$9,853 (reported on 25.6% of returns)
Here:
+$9,853
State:
+$17,064
(% of AGI for various income ranges: 20.8% for AGIs below $25k, 5.2% for AGIs $25k-50k, 3.2% for AGIs $50k-75k, 3.2% for AGIs $75k-100k, 7.5% for AGIs $100k-200k)
Taxable individual retirement arrangement distribution: $8,624 (reported on 0.9% of returns)
90006:
$8,624
California:
$19,557
(% of AGI for various income ranges: 0.2% for AGIs below $25k, 0.3% for AGIs $25k-50k, 0.7% for AGIs $50k-75k, 0.8% for AGIs $100k-200k)
Total itemized deductions: $21,355 (34% of AGI, reported on 9.1% of returns)
Here:
$21,355
State:
$34,004
Here:
33.6% of AGI
State:
22.7% of AGI
(% of AGI for various income ranges: 2.7% for AGIs below $25k, 6.1% for AGIs $25k-50k, 10.5% for AGIs $50k-75k, 15.6% for AGIs $75k-100k, 22.5% for AGIs $100k-200k, 23.2% for AGIs over 200k)
Charity contributions: $2,836 (reported on 6.1% of returns)
Here:
$2,836
State:
$4,659
(% of AGI for various income ranges: 0.2% for AGIs below $25k, 0.6% for AGIs $25k-50k, 1.1% for AGIs $50k-75k, 1.5% for AGIs $75k-100k, 1.8% for AGIs $100k-200k, 1.5% for AGIs over 200k)
Taxes paid: $5,369 (reported on 9.0% of returns)
90006:
$5,369
State:
$14,448
(% of AGI for various income ranges: 0.4% for AGIs below $25k, 1.1% for AGIs $25k-50k, 2.7% for AGIs $50k-75k, 5.1% for AGIs $75k-100k, 7.0% for AGIs $100k-200k, 6.9% for AGIs over 200k)
Earned income credit: $2,298 (reported on 34.0% of returns)
Here:
$2,298
State:
$2,286
(% of AGI for various income ranges: 7.6% for AGIs below $25k, 1.5% for AGIs $25k-50k)
Percentage of individuals using paid preparers for their 2012 taxes: 78.4%
Here:
78%
State:
64%
(% for various income ranges: 78.6% for AGIs below $25k, 78.9% for AGIs $25k-50k, 75.2% for AGIs $50k-75k, 73.2% for AGIs $75k-100k, 71.0% for AGIs $100k-200k, 100.0% for AGIs over 200k)
Averages for the 2004 tax year for zip code 90006, filed in 2005:
Average Adjusted Gross Income (AGI) in 2004: $20,444 (Individual Income Tax Returns)
Here:
$20,444
State:
$58,600
Salary/wage: $20,818 (reported on 81.2% of returns)
Here:
$20,818
State:
$49,455
(% of AGI for various income ranges: 67.1% for AGIs below $10k, 84.9% for AGIs $10k-25k, 90.5% for AGIs $25k-50k, 88.0% for AGIs $50k-75k, 77.8% for AGIs $75k-100k, 39.6% for AGIs over 100k)
Taxable interest for individuals: $692 (reported on 13.9% of returns)
This zip code:
$692
California:
$2,365
(% of AGI for various income ranges: 1.1% for AGIs below $10k, 0.3% for AGIs $10k-25k, 0.3% for AGIs $25k-50k, 0.6% for AGIs $50k-75k, 1.0% for AGIs $75k-100k, 1.1% for AGIs over 100k)
Taxable dividends: $1,364 (reported on 2.6% of returns)
Here:
$1,364
State:
$4,746
(% of AGI for various income ranges: 0.3% for AGIs below $10k, 0.1% for AGIs $10k-25k, 0.1% for AGIs $25k-50k, 0.2% for AGIs $50k-75k, 0.4% for AGIs $75k-100k, 1.1% for AGIs over 100k)
Net capital gain/loss: +$19,418 (reported on 2.7% of returns)
Here:
+$19,418
State:
+$23,418
(% of AGI for various income ranges: -0.1% for AGIs below $10k, -0.0% for AGIs $10k-25k, 0.4% for AGIs $25k-50k, 0.9% for AGIs $50k-75k, 5.2% for AGIs $75k-100k, 32.0% for AGIs over 100k)
Profit/loss from business: +$8,589 (reported on 25.1% of returns)
Here:
+$8,589
State:
+$16,826
(% of AGI for various income ranges: 39.7% for AGIs below $10k, 12.9% for AGIs $10k-25k, 5.3% for AGIs $25k-50k, 3.8% for AGIs $50k-75k, 3.8% for AGIs $75k-100k, 8.8% for AGIs over 100k)
IRA payment deduction: $2,218 (reported on 0.9% of returns)
90006:
$2,218
California:
$3,192
(% of AGI for various income ranges: 0.1% for AGIs $10k-25k, 0.1% for AGIs $25k-50k, 0.1% for AGIs $50k-75k, 0.6% for AGIs $75k-100k)
Total itemized deductions: $18,629 (37% of AGI, reported on 8.6% of returns)
Here:
$18,629
State:
$28,113
Here:
37.1% of AGI
State:
25.3% of AGI
(% of AGI for various income ranges: 2.0% for AGIs below $10k, 4.5% for AGIs $10k-25k, 7.7% for AGIs $25k-50k, 13.3% for AGIs $50k-75k, 18.3% for AGIs $75k-100k, 19.6% for AGIs over 100k)
Charity contributions deductions: $2,610 (5% of AGI, reported on 6.4% of returns)
Here:
$2,610
State:
$3,923
Here:
4.9% of AGI
State:
3.3% of AGI
(% of AGI for various income ranges: 0.1% for AGIs below $10k, 0.3% for AGIs $10k-25k, 0.8% for AGIs $25k-50k, 1.6% for AGIs $50k-75k, 2.3% for AGIs $75k-100k, 2.6% for AGIs over 100k)
Total tax: $2,055 (reported on 60.3% of returns)
90006:
$2,055
State:
$10,761
(% of AGI for various income ranges: 6.8% for AGIs below $10k, 3.8% for AGIs $10k-25k, 5.2% for AGIs $25k-50k, 8.3% for AGIs $50k-75k, 11.6% for AGIs $75k-100k, 16.2% for AGIs over 100k)
Earned income credit: $1,867 (reported on 42.2% of returns)
Here:
$1,867
State:
$1,763
Percentage of individuals using paid preparers for their 2004 taxes: 81.1%
Here:
81%
State:
66%
(% for various income ranges: 78.5% for AGIs below $10k, 83.5% for AGIs $10k-25k, 80.4% for AGIs $25k-50k, 76.7% for AGIs $50k-75k, 71.6% for AGIs $75k-100k, 86.5% for AGIs over 100k)
Likely homosexual households (counted as self-reported same-sex unmarried-partner households)
Lesbian couples: 0.1% of all households
Gay men: 0.1% of all households
Household received Food Stamps/SNAP in the past 12 months: 4,346 Household did not receive Food Stamps/SNAP in the past 12 months: 15,488
Women who had a birth in the past 12 months: 573 (260 now married, 316 unmarried) Women who did not have a birth in the past 12 months: 14,366 (4,246 now married, 10,180 unmarried)
Housing units in zip code 90006 with a mortgage: 1,275 (88 second mortgage, 71 both second mortgage and home equity loan) Houses without a mortgage: 17
Median monthly owner costs for units with a mortgage: $2,706 Median monthly owner costs for units without a mortgage: $848
Residents with income below the poverty level in 2022:
This zip code:
23.1%
Whole state:
12.2%
Residents with income below 50% of the poverty level in 2022:
This zip code:
13.8%
Whole state:
6.2%
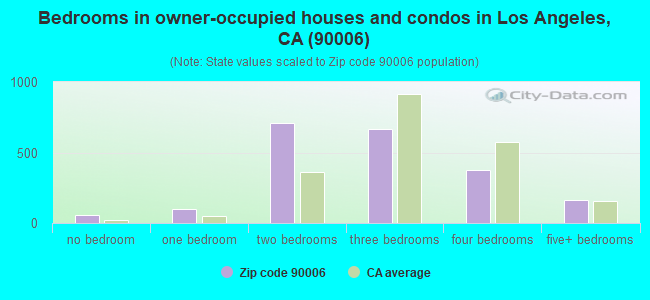
Median number of rooms in houses and condos:
Here:
5.1
State:
6.0
Median number of rooms in apartments:
Here:
2.9
State:
3.9
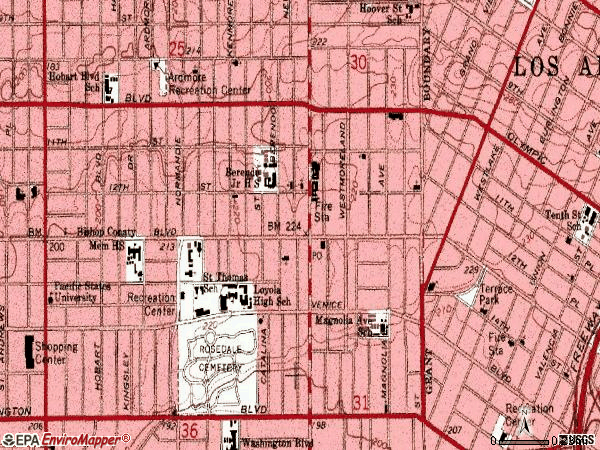
Notable locations in this zip code not listed on our city pages
Notable locations in zip code 90006: Pio Pico-Koreatown Branch Los Angeles Public Library (A), Keeley Institute (B), Charles P Skauras Memorial Center (C), City of Los Angeles Fire Department Station 13 (D). Display/hide their locations on the map
Churches in zip code 90006 include: First Church of Christ Scientist (A), Saint Sophias Greek Orthodox Cathedral (B), Saint Thomas the Apostle Roman Catholic Church (C), Bible House of Los Angeles (D), Central Church of Christ (E), Chapel of the Pines (F), Deaf Baptist Temple (G), John M Schaefle Memorial Congregational Church (H), Masis Congregational Church (I). Display/hide their locations on the map
Parks in zip code 90006 include: Ardmore Recreation Center (1), Terrace Park (2), Normandie Playground (3), Pico Union Park (4), Alvarado Terrace Historic District (5), South Bonnie Brae Tract Historic District (6). Display/hide their locations on the map
Tourist attractions (not listed on the city page) : C A Robinson and CO Inc (2891 West Pico Boulevard), A JU Tours Inc (3053 West Olympic Boulevard Suite 101).
4,471 married couples with children.
4,538 single-parent households (1,133 men, 3,405 women).
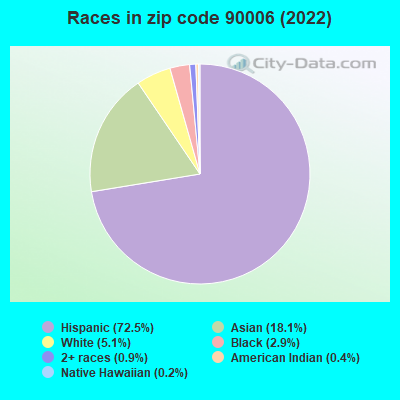
15.0% of residents of 90006 zip code speak English at home.
67.2% of residents speak Spanish at home (40% very well, 18% well, 27% not well, 15% not at all).
1.2% of residents speak other Indo-European language at home (58% very well, 39% well, 3% not well).
16.6% of residents speak Asian or Pacific Island language at home (32% very well, 25% well, 31% not well, 12% not at all).
0.4% of residents speak other language at home (49% very well, 15% well, 17% not well, 18% not at all).
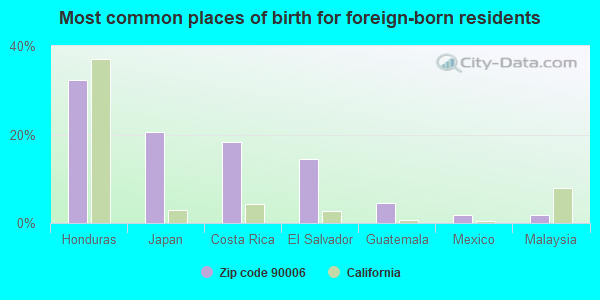
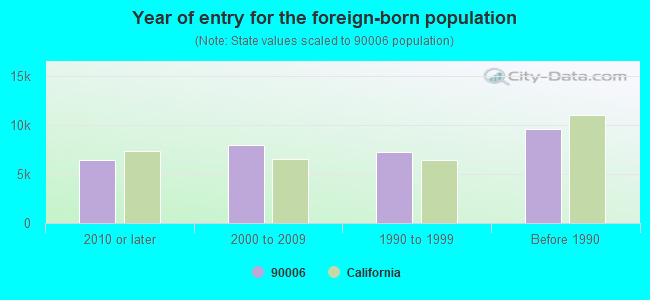
Foreign born population: 30,799 (54.8%) (31.9% of them are naturalized citizens)
Major facilities with environmental interests located in this zip code:
HOBART E S (980 S HOBART BLVD in LOS ANGELES, CA)
STATE MASTER (California - Hazardous Waste Tracking) - HAZARDOU WASTE PROGRAM Large Quantity Generators, more that 1000 kg of hazardous waste/month (Resource Conservation and Recovery Act (tracking hazardous waste)) - notification Organizations: L A UNIFIED SCHOOL DISTRICT (CONTACT/OWNER)
Alternative names: LA USD HOBART ELEM, LAUSD/ HOBART BLVD ELEM
CENTRAL L A AREA NEW H S NO 2 (1500 W WASHINGTON BLVD in LOS ANGELES, CA)
STATE MASTER (California - Hazardous Waste Tracking) - HAZARDOU WASTE PROGRAM Large Quantity Generators, more that 1000 kg of hazardous waste/month (Resource Conservation and Recovery Act (tracking hazardous waste)) - notification Organizations: LAUSD (CONTACT/OPERATOR)
HOBART ELEM SCHOOL (955 S HARVARD BLVD in LOS ANGELES, CA)
STATE MASTER (California - Hazardous Waste Tracking) - HAZARDOU WASTE PROGRAM Large Quantity Generators, more that 1000 kg of hazardous waste/month (Resource Conservation and Recovery Act (tracking hazardous waste)) - notification Organizations: L A UNIFIED SCHOOL DIST (CONTACT/OWNER)
Alternative names: HOBART ELEMENTARY SCHOOL
LOS ANGELES NEW CONT H S NO 1 (1470 W WASHINGTON BLVD in LOS ANGELES, CA)
STATE MASTER (California - Hazardous Waste Tracking) - HAZARDOU WASTE PROGRAM Large Quantity Generators, more that 1000 kg of hazardous waste/month (Resource Conservation and Recovery Act (tracking hazardous waste)) - notification Organizations: L A UNIFIED SCHOOL DISTRICT (CONTACT/OWNER)
LOS ANGELES NEW P C NO 5 (987 S MARIPOSA AVE in LOS ANGELES, CA)
STATE MASTER (California - Hazardous Waste Tracking) - HAZARDOU WASTE PROGRAM Large Quantity Generators, more that 1000 kg of hazardous waste/month (Resource Conservation and Recovery Act (tracking hazardous waste)) - notification Organizations: L A UNIFIED SCHOOL DISTRICT (CONTACT/OWNER)
EQUILON ENTERPRISES (955 S ALVARADO in LOS ANGELES, CA) . Federal Facility
STATE MASTER (California - Hazardous Waste Tracking) - HAZARDOU WASTE PROGRAM HAZARDOUS WASTE BIENNIAL REPORTER (Resource Conservation and Recovery Act (tracking hazardous waste)) Small Quantity Generators, between 100 kg and 1000 kg of hazardous waste/month (Resource Conservation and Recovery Act (tracking hazardous waste)) - notification Organizations: EQUILON ENTERPRISES L L C (CONTACT/OWNER)
Alternative names: SHELL OIL CO
IRRIBARREN TRANSPORT (1056 S NORMANDIE in LOS ANGELES, CA)
STATE MASTER (California - Hazardous Waste Tracking) - HAZARDOU WASTE PROGRAM TRANSPORTER (Resource Conservation and Recovery Act (tracking hazardous waste)) Business NAICS classification: SOLID WASTE COLLECTION.; HAZARDOUS WASTE COLLECTION. Organizations: CESAR IRRIBARREN (CONTACT/OPERATOR)
LAUSD MAGNOLIA ELEM SCHOOL (1625 S ORCHARD in LOS ANGELES, CA)
STATE MASTER (California - Hazardous Waste Tracking) - HAZARDOU WASTE PROGRAM Small Quantity Generators, between 100 kg and 1000 kg of hazardous waste/month (Resource Conservation and Recovery Act (tracking hazardous waste)) - notification Alternative names: LAUSD/ MAGNOLIA AVE ELEM
LOS ANGELES USD BERENDO JUNIOR HG SCHOOL (1157 S BERENDO ST in LOS ANGELES, CA)
STATE MASTER (California - Hazardous Waste Tracking) - HAZARDOU WASTE PROGRAM Small Quantity Generators, between 100 kg and 1000 kg of hazardous waste/month (Resource Conservation and Recovery Act (tracking hazardous waste)) - notification Organizations: LOS ANGELES UNIFIED SCHOOL DISTRICT (CONTACT/OWNER)
Alternative names: BERENDO MIDDLE, LAUSD/ BERENDO JH
MARLO CUSTOM DRY CLEANING (2336 W PICO BLVD in LOS ANGELES, CA)
STATE MASTER (California - Hazardous Waste Tracking) - HAZARDOU WASTE PROGRAM Small Quantity Generators, between 100 kg and 1000 kg of hazardous waste/month (Resource Conservation and Recovery Act (tracking hazardous waste))
GENERAL AUTO CENTER (2960 W OLYMPIC BLVD in LOS ANGELES, CA)
(Resource Conservation and Recovery Act (tracking hazardous waste)) Small Quantity Generators, between 100 kg and 1000 kg of hazardous waste/month (Resource Conservation and Recovery Act (tracking hazardous waste)) Organizations: SHI CHOL LIM & BOBBY YONGSOO KIM (CONTACT/OWNER)
, DANIEL LEE OWNER (CONTACT/OWNER)
Alternative names: TROJAN AUTO BODY AND UPHOLSTERY
HANNAM CHAIN USA (2740 OLYMPIC BLVD in LOS ANGELES, CA)
(Integrated Compliance Information System) - ICIS-09-2001-0087, FORMAL ENFORCEMENT ACTION COMPLIANCE ACTIVITY (Tracking inspections of insecticide, fungicide, and rodenticide, and toxic substances) Business SIC classification: GROCERY STORES Alternative names: HANNAM CHAIN USA D/B/A SUPER 1 MART
HOBART BOULEVARD ELEMENTARY (980 S. HOBART BLVD. in LOS ANGELES, CA)
(National Center for Education Statistics) - STATE ID-6017602 Organizations: LOS ANGELES UNIFIED (SCHOOL DISTRICT)
Housing units lacking complete plumbing facilities: 0.5% Housing units lacking complete kitchen facilities: 2.2%
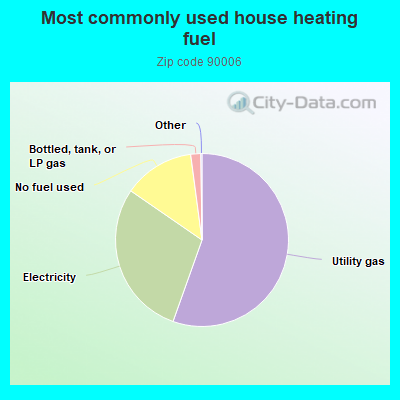
55.5%Utility gas
29.2%Electricity
13.3%No fuel used
1.9%Bottled, tank, or LP gas
Population in 1990: 63,389.
Place of birth for U.S.-born residents:
This state: 21,974
Northeast: 966
Midwest: 506
South: 914
West: 667
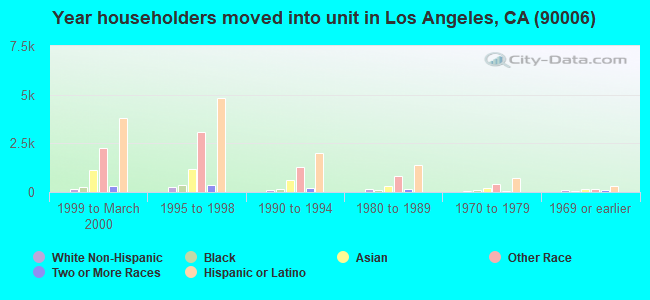
50% of the 90006 zip code residents lived in the same house 5 years ago. Out of people who lived in different houses, 93% lived in this county. Out of people who lived in different counties, 50% lived in California.
94% of the 90006 zip code residents lived in the same house 1 year ago. Out of people who lived in different houses, 76% moved from this county. Out of people who lived in different houses, 8% moved from different county within same state. Out of people who lived in different houses, 12% moved from different state. Out of people who lived in different houses, 7% moved from abroad.
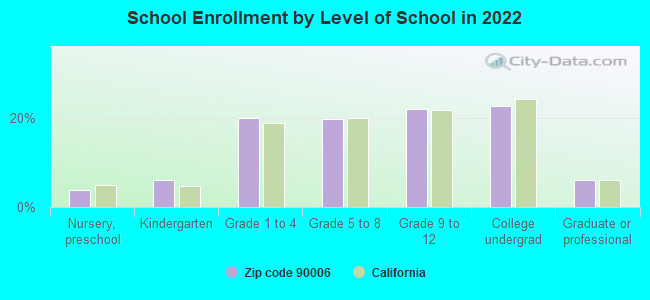
Private vs. public school enrollment:
Students in private schools in grades 1 to 8 (elementary and middle school): 87
Here:
1.7%
California:
10.5%
Students in private schools in grades 9 to 12 (high school): 51
Here:
1.8%
California:
8.5%
Students in private undergraduate colleges: 330
Here:
11.5%
California:
15.9%
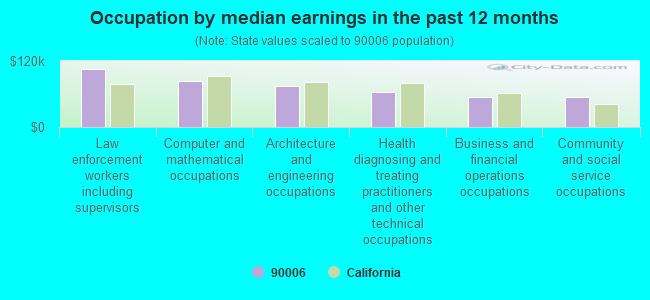
Occupation by median earnings in the past 12 months ($)
105,820Law enforcement workers including supervisors
82,765Computer and mathematical occupations
75,060Architecture and engineering occupations
63,690Health diagnosing and treating practitioners and other technical occupations
54,378Business and financial operations occupations
54,281Community and social service occupations
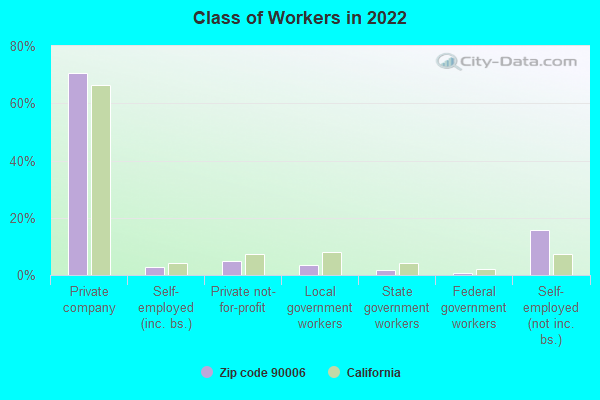
Companies with federal contracts located in this zip code (LOS ANGELES, CA):
CAL-PAC ENGINEERING INC (2140 W OLYMPIC BLVD # 405; small business) : $20,683,013 in 179 contractsfrom 1999 to 2006
Contracts for Maintenance, Repair or Alteration of Real Property -- Highways, Roads, Streets, Bridges, and Railways (includes resurfacing), Maintenance, Repair or Alteration of Real Property -- Other Non-Building Facilities, Maintenance, Repair or Alteration of Real Property -- Other Conservation and Development Facilities, Construction of Structures and Facilities -- Other Non-Building Facilities, and moreby Air Force, Navy, U.S. Army Corps of Engineers - civil program financing only Signed by year:2000: $2,011,931; 2001: $2,790,482; 2002: $1,969,432; 2003: $7,676,287; 2004: $2,872,764; 2005: $3,242,488; 2006: $110,802.
Biggest contracts:
$1,895,472 with Air Force for Maintenance, Repair or Alteration of Real Property -- Highways, Roads, Streets, Bridges, and Railways (includes resurfacing). Taking place in AZ. Signed on 2003-09-29. Completion date: 2004-02-29.
$1,537,810 with Navy for Maintenance, Repair or Alteration of Real Property -- Other Non-Building Facilities. Signed on 2001-09-29. Completion date: 2002-04-10.
$1,482,093 with Navy for Maintenance, Repair or Alteration of Real Property -- Highways, Roads, Streets, Bridges, and Railways (includes resurfacing). Signed on 2005-08-01. Completion date: 2006-01-08.
$951,440 with Air Force for Maintenance, Repair or Alteration of Real Property -- Highways, Roads, Streets, Bridges, and Railways (includes resurfacing). Taking place in AZ. Signed on 2003-09-30. Completion date: 2004-04-01.
BESTEK ENGINEERING INC (983 S NEW HAMPSHIRE AVE; small business) : $16,493,497 in 54 contractsfrom 1999 to 2006
Contracts for Maintenance, Repair or Alteration of Real Property -- Other Administrative Facilities and Service Buildings, Maintenance, Repair or Alteration of Real Property -- Miscellaneous Buildings, Construction of Structures and Facilities -- Miscellaneous Buildings, Maintenance, Repair or Alteration of Real Property -- Sewage and Waste Facilities, and moreby Air Force, NASA, Army, Navy, and others Signed by year:2000: $2,179,061; 2001: $1,672,916; 2002: $3,185,945; 2003: $2,911,536; 2004: $1,612,741; 2005: $513,933; 2006: $1,495,003.
Biggest contracts:
$2,922,362 with Air Force for Maintenance, Repair or Alteration of Real Property -- Other Administrative Facilities and Service Buildings. Signed on 1999-10-26. Completion date: 2000-10-15.
$2,083,000 with NASA for Maintenance, Repair or Alteration of Real Property -- Miscellaneous Buildings. Signed on 2000-04-15. Completion date: 2001-10-15.
$1,659,662 with Army for Maintenance, Repair or Alteration of Real Property -- Miscellaneous Buildings. Signed on 2002-05-22. Completion date: 2003-07-12.
$1,385,587 with Air Force for Maintenance, Repair or Alteration of Real Property -- Other Administrative Facilities and Service Buildings. Signed on 2001-04-27. Completion date: 2002-04-30.
U S EQUIPMENT CO INC (1810 VENICE BLVD; small business) : $55,293 in 2 contractsin 2005
$37,716 with Navy for Lease or Rental of Equipment -- Pumps and Compressors. Signed on 2005-04-14. Completion date: 2005-06-01.
$17,577 with Navy for Compressors and Vacuum Pumps. Signed on 2005-09-09. Completion date: 2005-11-05.
JJJ SUPPLY INC (1433 VENICE BLVD; small business)
$36,125 with Army for Refrigeration and Air Conditioning Components. Taking place in DC. Signed on 2004-03-08. Completion date: 2004-03-28.
CARTWHEEL FACTORY (1150 S LAKE ST #9; small business) : $7,208 in 2 contractsfrom 2004 to 2005
$3,787 with Army for Recreational and Gymnastic Equipment. Signed on 2004-05-28. Completion date: 2004-07-09.
$3,421 with Army for Athletic and Sporting Equipment. Taking place in MO. Signed on 2005-05-13. Completion date: 2005-05-31.
Top industries in this zip code by the number of employees in 2005:
Health Care and Social Assistance: Blood and Organ Banks (over 1000 employees: 1 establishment)
2005 - 2018 National Fire Incident Reporting System (NFIRS) incidents
According to the data from the years 2005 - 2018 the average number of fires per year is 116. The highest number of fire incidents - 173 took place in 2008, and the least - 72 in 2012. The data has an increasing trend.
When looking into fire subcategories, the most incidents belonged to: Structure Fires (56.9%), and Outside Fires (23.8%).
Fire incident types reported to NFIRS in Zip Code 90006


 Nearest zip codes: 90005, 90007, 90057, 90020, 90010, 90089.


 According to the data from the years 2005 - 2018 the average number of fires per year is 116. The highest number of fire incidents - 173 took place in 2008, and the least - 72 in 2012. The data has an increasing trend.
 When looking into fire subcategories, the most incidents belonged to: Structure Fires (56.9%), and Outside Fires (23.8%).