Estimated zip code population in 2022: 10,790 Zip code population in 2010: 11,555 Zip code population in 2000: 11,347
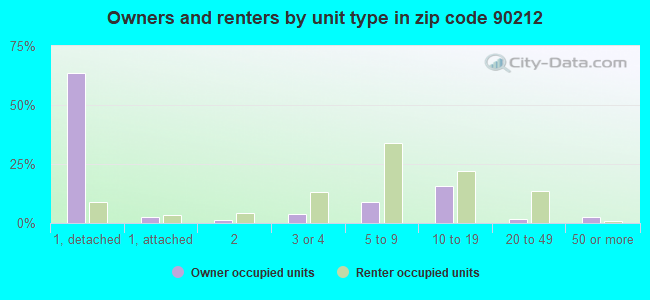
Houses and condos: 6,287 Renter-occupied apartments: 4,317
% of renters here:
78%
State:
44%
March 2022 cost of living index in zip code 90212: 157.1 (very high, U.S. average is 100)
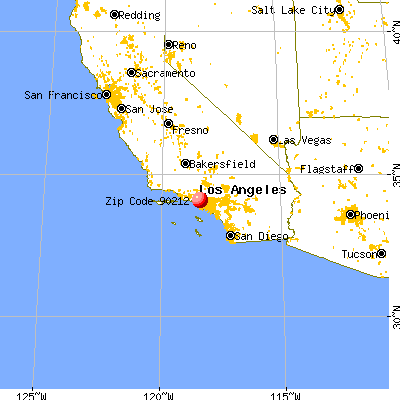
Land area: 1.0 sq. mi. Water area: 0.0 sq. mi.
Population density: 11,295 people per square mile
(high).
OSM Map
General Map
Google Map
MSN Map
OSM Map
General Map
Google Map
MSN Map
OSM Map
General Map
Google Map
MSN Map
OSM Map
General Map
Google Map
MSN Map
Please wait while loading the map...
Real estate property taxes paid for housing units in 2022:
This zip code:
0.5% ($10,292)
California:
0.7% ($4,831)
Median real estate property taxes paid for housing units with mortgages in 2022: $10,330 (0.5%) Median real estate property taxes paid for housing units with no mortgage in 2022: $9,289 (0.4%)
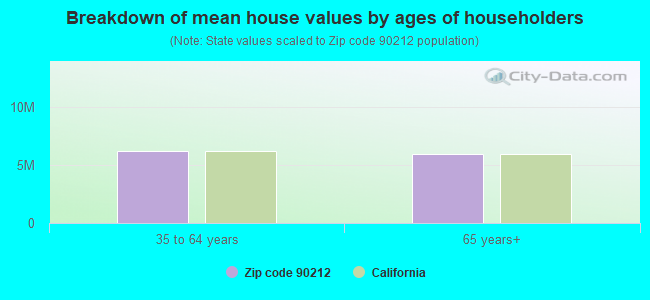
Estimated median house/condo value in 2022: $2,171,698
90212:
$2,171,698
California:
$715,900
According to our research of California and other state lists, there were 5 registered sex offenders living in 90212 zip code as of April 25, 2024. The ratio of all residents to sex offenders in zip code 90212 is 2,620 to 1. The ratio of registered sex offenders to all residents in this zip code is much lower than the state average.
Median resident age:
This zip code:
47.9 years
California median age:
37.9 years
Average household size:
This zip code:
1.9 people
California:
2.8 people
Averages for the 2020 tax year for zip code 90212, filed in 2021:
Average Adjusted Gross Income (AGI) in 2020: $422,902 (Individual Income Tax Returns)
Here:
$422,902
State:
$95,910
Salary/wage: $240,034 (reported on 67.2% of returns)
Here:
$240,034
State:
$77,331
(% of AGI for various income ranges: 1127.8% for AGIs below $25k, 4247.4% for AGIs $25k-50k, 8572.9% for AGIs $50k-75k, 13722.9% for AGIs $75k-100k, 25190.2% for AGIs $100k-200k, 310666.8% for AGIs over 200k)
Taxable interest for individuals: $34,067 (reported on 49.5% of returns)
This zip code:
$34,067
California:
$2,294
(% of AGI for various income ranges: 76.6% for AGIs below $25k, 206.8% for AGIs $25k-50k, 310.0% for AGIs $50k-75k, 411.7% for AGIs $75k-100k, 926.1% for AGIs $100k-200k, 36915.2% for AGIs over 200k)
Ordinary dividends: $55,754 (reported on 41.2% of returns)
Here:
$55,754
State:
$10,949
(% of AGI for various income ranges: 120.5% for AGIs below $25k, 364.7% for AGIs $25k-50k, 457.6% for AGIs $50k-75k, 759.6% for AGIs $75k-100k, 1504.1% for AGIs $100k-200k, 49608.1% for AGIs over 200k)
Net capital gain/loss in AGI: +$221,146 (reported on 41.5% of returns)
Here:
+$221,146
State:
+$49,306
(% of AGI for various income ranges: 101.4% for AGIs below $25k, 290.6% for AGIs $25k-50k, 522.9% for AGIs $50k-75k, 812.1% for AGIs $75k-100k, 1822.5% for AGIs $100k-200k, 210150.6% for AGIs over 200k)
Profit/loss from business: +$47,905 (reported on 33.2% of returns)
Here:
+$47,905
State:
+$15,671
(% of AGI for various income ranges: 422.5% for AGIs below $25k, 1064.0% for AGIs $25k-50k, 767.1% for AGIs $50k-75k, 1265.0% for AGIs $75k-100k, 2617.7% for AGIs $100k-200k, 28835.2% for AGIs over 200k)
Taxable individual retirement arrangement distribution: $47,544 (reported on 7.6% of returns)
90212:
$47,544
California:
$23,505
(% of AGI for various income ranges: 53.2% for AGIs below $25k, 161.3% for AGIs $25k-50k, 209.2% for AGIs $50k-75k, 565.4% for AGIs $75k-100k, 1132.7% for AGIs $100k-200k, 5742.9% for AGIs over 200k)
Self-employed (Keogh) retirement plans: $42,655 (reported on 3.0% of returns)
90212:
$42,655
California:
$30,163
(% of AGI for various income ranges: 121.1% for AGIs $50k-75k, 196.6% for AGIs $100k-200k, 2599.7% for AGIs over 200k)
Total itemized deductions: $145,110 (reported on 25.7% of returns)
Here:
$145,110
State:
$39,517
(% of AGI for various income ranges: 280.7% for AGIs below $25k, 786.6% for AGIs $25k-50k, 1033.2% for AGIs $50k-75k, 1929.2% for AGIs $75k-100k, 3476.4% for AGIs $100k-200k, 77409.7% for AGIs over 200k)
Charity contributions: $60,534 (reported on 22.1% of returns)
Here:
$60,534
State:
$12,598
(% of AGI for various income ranges: 16.8% for AGIs below $25k, 68.1% for AGIs $25k-50k, 117.4% for AGIs $50k-75k, 252.9% for AGIs $75k-100k, 661.6% for AGIs $100k-200k, 29815.2% for AGIs over 200k)
Taxes paid: $9,101 (reported on 25.5% of returns)
90212:
$9,101
State:
$8,807
(% of AGI for various income ranges: 49.5% for AGIs below $25k, 157.4% for AGIs $25k-50k, 195.0% for AGIs $50k-75k, 401.7% for AGIs $75k-100k, 807.7% for AGIs $100k-200k, 3360.0% for AGIs over 200k)
Earned income credit: $1,302 (reported on 7.9% of returns)
Here:
$1,302
State:
$2,074
(% of AGI for various income ranges: 58.6% for AGIs below $25k, 51.9% for AGIs $25k-50k)
Percentage of individuals using paid preparers for their 2020 taxes: 92.8%
Here:
93%
State:
92%
(% for various income ranges: 90.3% for AGIs below $25k, 92.4% for AGIs $25k-50k, 92.6% for AGIs $50k-75k, 91.8% for AGIs $75k-100k, 94.3% for AGIs $100k-200k, 95.6% for AGIs over 200k)
Averages for the 2012 tax year for zip code 90212, filed in 2013:
Average Adjusted Gross Income (AGI) in 2012: $367,096 (Individual Income Tax Returns)
Here:
$367,096
State:
$72,726
Salary/wage: $250,018 (reported on 70.9% of returns)
Here:
$250,018
State:
$59,079
(% of AGI for various income ranges: 57.1% for AGIs below $25k, 67.1% for AGIs $25k-50k, 66.4% for AGIs $50k-75k, 67.7% for AGIs $75k-100k, 62.2% for AGIs $100k-200k, 46.1% for AGIs over 200k)
Taxable interest for individuals: $20,927 (reported on 52.8% of returns)
This zip code:
$20,927
California:
$2,146
(% of AGI for various income ranges: 4.2% for AGIs below $25k, 2.1% for AGIs $25k-50k, 1.9% for AGIs $50k-75k, 1.9% for AGIs $75k-100k, 2.7% for AGIs $100k-200k, 3.1% for AGIs over 200k)
Ordinary dividends: $46,622 (reported on 40.2% of returns)
Here:
$46,622
State:
$9,308
(% of AGI for various income ranges: 6.7% for AGIs below $25k, 4.1% for AGIs $25k-50k, 3.5% for AGIs $50k-75k, 2.8% for AGIs $75k-100k, 3.7% for AGIs $100k-200k, 5.3% for AGIs over 200k)
Net capital gain/loss in AGI: +$170,721 (reported on 39.8% of returns)
Here:
+$170,721
State:
+$30,460
(% of AGI for various income ranges: 0.2% for AGIs below $25k, 0.7% for AGIs $25k-50k, 0.5% for AGIs $50k-75k, 1.4% for AGIs $75k-100k, 3.1% for AGIs $100k-200k, 20.8% for AGIs over 200k)
Profit/loss from business: +$34,738 (reported on 31.6% of returns)
Here:
+$34,738
State:
+$17,064
(% of AGI for various income ranges: 22.3% for AGIs below $25k, 13.8% for AGIs $25k-50k, 10.7% for AGIs $50k-75k, 7.6% for AGIs $75k-100k, 7.7% for AGIs $100k-200k, 2.0% for AGIs over 200k)
Taxable individual retirement arrangement distribution: $45,135 (reported on 9.5% of returns)
90212:
$45,135
California:
$19,557
(% of AGI for various income ranges: 3.0% for AGIs below $25k, 1.5% for AGIs $25k-50k, 2.1% for AGIs $50k-75k, 2.4% for AGIs $75k-100k, 4.1% for AGIs $100k-200k, 0.9% for AGIs over 200k)
Self-employment retirement plans: $34,236 (reported on 3.6% of returns)
90212:
$34,236
California:
$24,530
(% of AGI for various income ranges: 0.9% for AGIs below $25k, 0.8% for AGIs $50k-75k, 0.9% for AGIs $100k-200k, 0.3% for AGIs over 200k)
Total itemized deductions: $131,282 (20% of AGI, reported on 52.3% of returns)
Here:
$131,282
State:
$34,004
Here:
19.6% of AGI
State:
22.7% of AGI
(% of AGI for various income ranges: 24.5% for AGIs below $25k, 16.6% for AGIs $25k-50k, 19.9% for AGIs $50k-75k, 19.8% for AGIs $75k-100k, 21.6% for AGIs $100k-200k, 18.4% for AGIs over 200k)
Charity contributions: $22,750 (reported on 43.6% of returns)
Here:
$22,750
State:
$4,659
(% of AGI for various income ranges: 1.4% for AGIs below $25k, 1.5% for AGIs $25k-50k, 1.6% for AGIs $50k-75k, 2.0% for AGIs $75k-100k, 2.2% for AGIs $100k-200k, 2.8% for AGIs over 200k)
Taxes paid: $77,990 (reported on 52.2% of returns)
90212:
$77,990
State:
$14,448
(% of AGI for various income ranges: 6.5% for AGIs below $25k, 4.2% for AGIs $25k-50k, 4.7% for AGIs $50k-75k, 6.8% for AGIs $75k-100k, 8.7% for AGIs $100k-200k, 11.6% for AGIs over 200k)
Earned income credit: $1,506 (reported on 8.5% of returns)
Here:
$1,506
State:
$2,286
(% of AGI for various income ranges: 3.4% for AGIs below $25k, 0.4% for AGIs $25k-50k)
Percentage of individuals using paid preparers for their 2012 taxes: 78.5%
Here:
78%
State:
64%
(% for various income ranges: 73.0% for AGIs below $25k, 70.7% for AGIs $25k-50k, 73.3% for AGIs $50k-75k, 77.3% for AGIs $75k-100k, 82.8% for AGIs $100k-200k, 92.6% for AGIs over 200k)
Averages for the 2004 tax year for zip code 90212, filed in 2005:
Average Adjusted Gross Income (AGI) in 2004: $247,158 (Individual Income Tax Returns)
Here:
$247,158
State:
$58,600
Salary/wage: $252,226 (reported on 68.1% of returns)
Here:
$252,226
State:
$49,455
(% of AGI for various income ranges: 61.4% for AGIs $10k-25k, 66.5% for AGIs $25k-50k, 67.9% for AGIs $50k-75k, 60.7% for AGIs $75k-100k, 63.3% for AGIs over 100k)
Taxable interest for individuals: $13,181 (reported on 62.7% of returns)
This zip code:
$13,181
California:
$2,365
(% of AGI for various income ranges: 6.9% for AGIs $10k-25k, 3.6% for AGIs $25k-50k, 3.4% for AGIs $50k-75k, 4.2% for AGIs $75k-100k, 2.2% for AGIs over 100k)
Taxable dividends: $14,014 (reported on 47.6% of returns)
Here:
$14,014
State:
$4,746
(% of AGI for various income ranges: 4.5% for AGIs $10k-25k, 3.4% for AGIs $25k-50k, 2.8% for AGIs $50k-75k, 3.4% for AGIs $75k-100k, 2.1% for AGIs over 100k)
Net capital gain/loss: +$65,654 (reported on 46.6% of returns)
Here:
+$65,654
State:
+$23,418
(% of AGI for various income ranges: 1.1% for AGIs $10k-25k, 1.8% for AGIs $25k-50k, 2.1% for AGIs $50k-75k, 1.8% for AGIs $75k-100k, 11.6% for AGIs over 100k)
Profit/loss from business: +$37,467 (reported on 30.9% of returns)
Here:
+$37,467
State:
+$16,826
(% of AGI for various income ranges: 16.5% for AGIs $10k-25k, 13.6% for AGIs $25k-50k, 8.3% for AGIs $50k-75k, 8.7% for AGIs $75k-100k, 3.7% for AGIs over 100k)
IRA payment deduction: $3,596 (reported on 4.1% of returns)
90212:
$3,596
California:
$3,192
(% of AGI for various income ranges: 0.5% for AGIs $10k-25k, 0.4% for AGIs $25k-50k, 0.3% for AGIs $50k-75k, 0.2% for AGIs $75k-100k, 0.0% for AGIs over 100k)
Self-employed pension: $29,838 (reported on 4.2% of returns)
Here:
$29,838
California:
$17,688
(% of AGI for various income ranges: 0.7% for AGIs $25k-50k, 0.7% for AGIs $50k-75k, 0.5% for AGIs $75k-100k, 0.5% for AGIs over 100k)
Total itemized deductions: $86,881 (18% of AGI, reported on 52.1% of returns)
Here:
$86,881
State:
$28,113
Here:
17.6% of AGI
State:
25.3% of AGI
(% of AGI for various income ranges: 23.2% for AGIs $10k-25k, 22.7% for AGIs $25k-50k, 22.5% for AGIs $50k-75k, 26.6% for AGIs $75k-100k, 16.1% for AGIs over 100k)
Charity contributions deductions: $19,969 (4% of AGI, reported on 45.8% of returns)
Here:
$19,969
State:
$3,923
Here:
3.7% of AGI
State:
3.3% of AGI
(% of AGI for various income ranges: 1.8% for AGIs $10k-25k, 2.4% for AGIs $25k-50k, 2.6% for AGIs $50k-75k, 2.9% for AGIs $75k-100k, 3.5% for AGIs over 100k)
Total tax: $90,681 (reported on 80.8% of returns)
90212:
$90,681
State:
$10,761
(% of AGI for various income ranges: 6.8% for AGIs $10k-25k, 9.5% for AGIs $25k-50k, 12.1% for AGIs $50k-75k, 12.7% for AGIs $75k-100k, 28.7% for AGIs over 100k)
Earned income credit: $1,068 (reported on 6.9% of returns)
Here:
$1,068
State:
$1,763
Percentage of individuals using paid preparers for their 2004 taxes: 81.7%
Here:
82%
State:
66%
(% for various income ranges: 76.9% for AGIs below $10k, 75.9% for AGIs $10k-25k, 77.3% for AGIs $25k-50k, 76.8% for AGIs $50k-75k, 83.0% for AGIs $75k-100k, 91.9% for AGIs over 100k)
Likely homosexual households (counted as self-reported same-sex unmarried-partner households)
Lesbian couples: 0.0% of all households
Gay men: 0.6% of all households
Household received Food Stamps/SNAP in the past 12 months: 388 Household did not receive Food Stamps/SNAP in the past 12 months: 5,122
Women who had a birth in the past 12 months: 87 (87 now married, 0 unmarried) Women who did not have a birth in the past 12 months: 2,479 (816 now married, 1,669 unmarried)
Housing units in zip code 90212 with a mortgage: 852 (148 second mortgage, 154 both second mortgage and home equity loan) Houses without a mortgage: 23
Median monthly owner costs for units with a mortgage: $3,876 Median monthly owner costs for units without a mortgage: $1,556
Residents with income below the poverty level in 2022:
This zip code:
9.8%
Whole state:
12.2%
Residents with income below 50% of the poverty level in 2022:
This zip code:
2.4%
Whole state:
6.2%
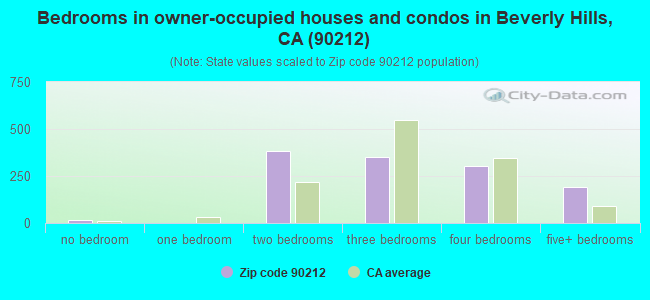
Median number of rooms in houses and condos:
Here:
7.5
State:
6.0
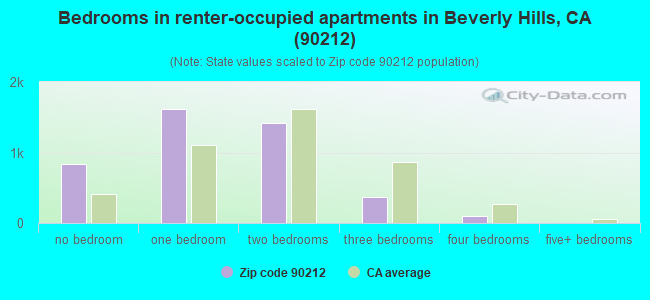
Median number of rooms in apartments:
Here:
3.8
State:
3.9
Notable locations in this zip code not listed on our city pages
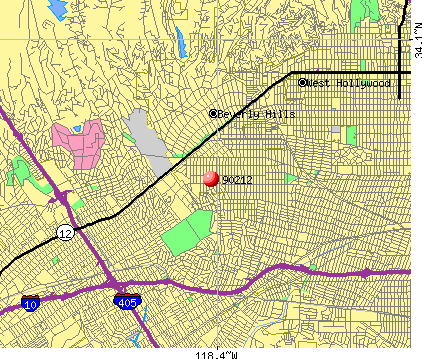
Churches in zip code 90212 include: Mount Calvary Lutheran Church (A), First Church of Christ Scientist (B), Beverly Vista Community Church (C). Display/hide their locations on the map
Size of family households: 1,418 2-persons, 791 3-persons, 401 4-persons, 83 5-persons, 38 6-persons
Size of nonfamily households: 2,495 1-person, 403 2-persons
1,004 married couples with children.
360 single-parent households (185 men, 175 women).
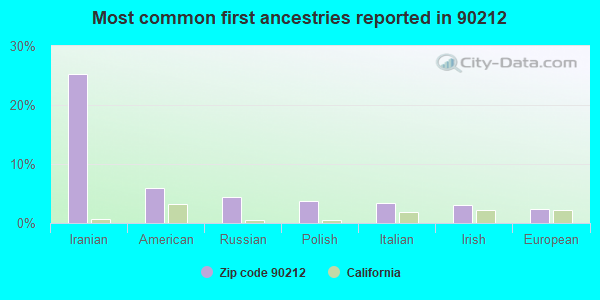
60.5% of residents of 90212 zip code speak English at home.
9.2% of residents speak Spanish at home (92% very well, 8% well).
21.9% of residents speak other Indo-European language at home (68% very well, 21% well, 10% not well, 1% not at all).
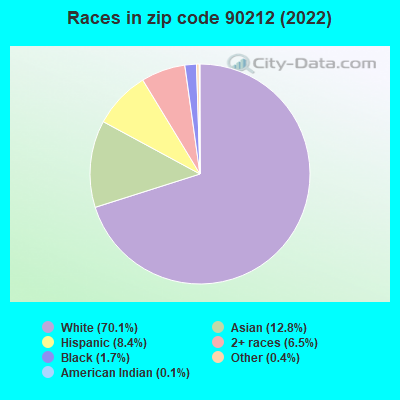
8.5% of residents speak Asian or Pacific Island language at home (59% very well, 31% well, 6% not well, 5% not at all).
0.7% of residents speak other language at home (100% very well).
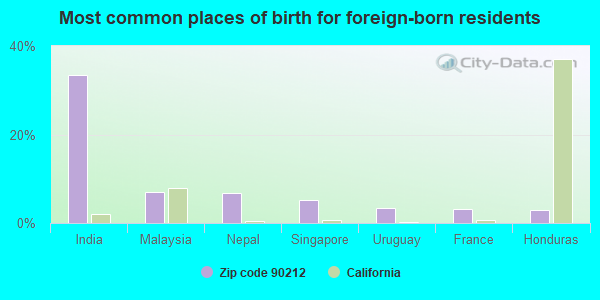
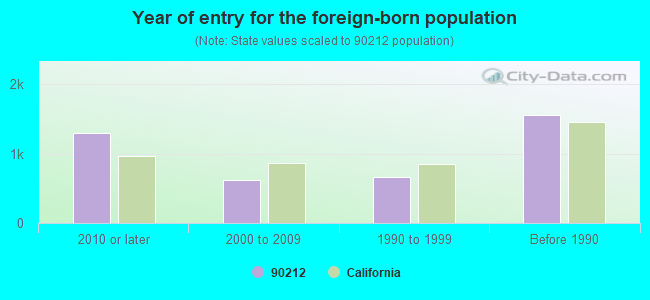
Foreign born population: 3,851 (35.7%) (69.8% of them are naturalized citizens)
Facilities with environmental interests located in this zip code:
FLAIR INC DBA FAZIO CLEANERS (9260 W OLYMPIC BLVD in BEVERLY HILLS, CA)
STATE MASTER (California - Hazardous Waste Tracking) - HAZARDOU WASTE PROGRAM CRITERIA AND HAZARDOUS AIR POLLUTANT INVENTORY (Inventory of air pollution sources) Small Quantity Generators, between 100 kg and 1000 kg of hazardous waste/month (Resource Conservation and Recovery Act (tracking hazardous waste)) - notification Business SIC classification: DRYCLEANING PLANTS, EXCEPT RUG CLEANING Alternative names: FAZIO INC DBA FAZIO CLEANERS
LEXUS OF BEVERLY HILLS (9230 WILSHIRE BLVD in BEVERLY HILLS, CA)
STATE MASTER (California - Hazardous Waste Tracking) - HAZARDOU WASTE PROGRAM Small Quantity Generators, between 100 kg and 1000 kg of hazardous waste/month (Resource Conservation and Recovery Act (tracking hazardous waste)) - notification Alternative names: JIM FALK LEXUS OF BEVERLY HILLS
CHEVRON STATION NO 93532 (9378 WILSHIRE BLVD in BEVERLY HILLS, CA)
STATE MASTER (California - Hazardous Waste Tracking) - HAZARDOU WASTE PROGRAM Small Quantity Generators, between 100 kg and 1000 kg of hazardous waste/month (Resource Conservation and Recovery Act (tracking hazardous waste)) - notification Organizations: CHEVRON PRODUCTS CO (CONTACT/OWNER)
MORENO HIGH (CONT.) (214 MORENO DR. in BEVERLY HILLS, CA)
(National Center for Education Statistics) - STATE ID-1931021 Organizations: BEVERLY HILLS UNIFIED (SCHOOL DISTRICT)
JER MAY (240 S BEVERLY DR in BEVERLY HILLS, CA)
Small Quantity Generators, between 100 kg and 1000 kg of hazardous waste/month (Resource Conservation and Recovery Act (tracking hazardous waste)) Organizations: THEDA PRAGING (CONTACT/OWNER)
NON PAREIL CLEANERS (9925 SANTA MONICA BC in BEVERLY HILLS, CA)
Small Quantity Generators, between 100 kg and 1000 kg of hazardous waste/month (Resource Conservation and Recovery Act (tracking hazardous waste)) Organizations: ONSEY ESTFAN (CONTACT/OWNER)
FERRARI OF BEVERLY HILLS (9372 WILSHIRE BLVD in BEVERLY HILLS, CA)
Small Quantity Generators, between 100 kg and 1000 kg of hazardous waste/month (Resource Conservation and Recovery Act (tracking hazardous waste)) - notification Organizations: GIACOMO MATTIOLI (CONTACT/OWNER)
GOLDEN COLOR ENGINEERING (271 S BEVERLY DR in BEVERLY HILLS, CA)
Small Quantity Generators, between 100 kg and 1000 kg of hazardous waste/month (Resource Conservation and Recovery Act (tracking hazardous waste)) - notification Organizations: ALI KHOSRAVI (CONTACT/OWNER)
JACK E. SCACE (TIP & COMPLAINT) (209 SO. REEVES in BEVERLY HILLS, CA)
COMPLIANCE ACTIVITY (Tracking inspections of insecticide, fungicide, and rodenticide, and toxic substances)
LEROYS CLEANERS (9107 W OLYMPIC BLVD in BEVERLY HILLS, CA)
Small Quantity Generators, between 100 kg and 1000 kg of hazardous waste/month (Resource Conservation and Recovery Act (tracking hazardous waste))
MARVIN MARKOWITZ (9370 W OLYMPIC BLVD in BEVERLY HILLS, CA)
COMPLIANCE ACTIVITY (Tracking inspections of insecticide, fungicide, and rodenticide, and toxic substances)
ABA-TRON INDUSTRIES INC (PO 6341 in BEVERLY HILLS, CA)
COMPLIANCE ACTIVITY (Tracking inspections of insecticide, fungicide, and rodenticide, and toxic substances)
Housing units lacking complete plumbing facilities: 0.5% Housing units lacking complete kitchen facilities: 0.5%
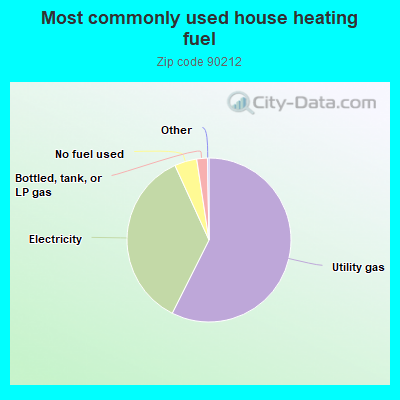
57.4%Utility gas
35.8%Electricity
4.4%No fuel used
2.1%Bottled, tank, or LP gas
Population in 1990: 10,725. Population change in the 1990s: +622 (+5.8%).
Place of birth for U.S.-born residents:
This state: 3,773
Northeast: 1,220
Midwest: 767
South: 444
West: 468
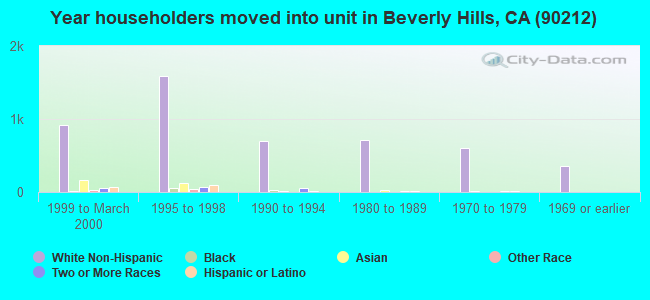
53% of the 90212 zip code residents lived in the same house 5 years ago. Out of people who lived in different houses, 75% lived in this county. Out of people who lived in different counties, 50% lived in California.
86% of the 90212 zip code residents lived in the same house 1 year ago. Out of people who lived in different houses, 47% moved from this county. Out of people who lived in different houses, 10% moved from different county within same state. Out of people who lived in different houses, 23% moved from different state. Out of people who lived in different houses, 23% moved from abroad.
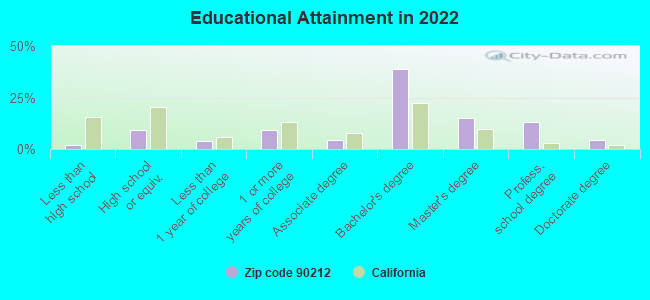
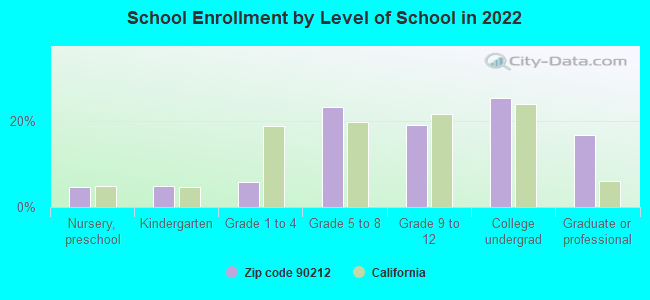
Private vs. public school enrollment:
Students in private schools in grades 1 to 8 (elementary and middle school): 67
Here:
11.2%
California:
10.5%
Students in private schools in grades 9 to 12 (high school): 127
Here:
32.2%
California:
8.5%
Students in private undergraduate colleges: 92
Here:
17.5%
California:
15.9%
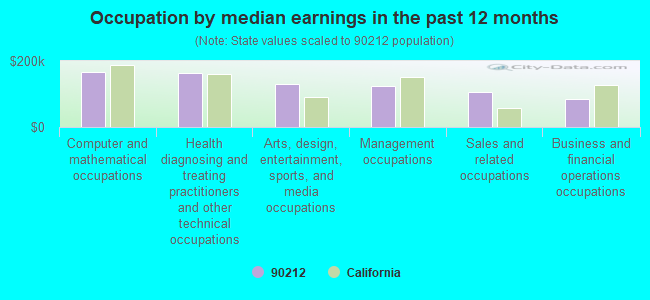
Occupation by median earnings in the past 12 months ($)
167,544Computer and mathematical occupations
162,654Health diagnosing and treating practitioners and other technical occupations
131,475Arts, design, entertainment, sports, and media occupations
124,138Management occupations
106,106Sales and related occupations
85,275Business and financial operations occupations
Companies with federal contracts located in this zip code (BEVERLY HILLS, CA):
DIVINE IMAGING COMMODITIES (9350 WILSHIRE BLVD; small business) : $908,465 in 155 contractsfrom 2004 to 2006
Contracts for Office Supplies, Drugs and Biologicals, Miscellaneous Items, ADP Components, and moreby Defense Finance and Accounting Service, Federal Supply Service, Bureau of Prisoners/Federal Prison System, Army, and others Signed by year:2000: $0; 2001: $0; 2002: $0; 2003: $0; 2004: $156,371; 2005: $310,331; 2006: $441,763.
Biggest contracts:
$153,414 with Defense Finance and Accounting Service for Office Supplies. Taking place in IN. Signed on 2004-10-01. Completion date: 2005-09-30.
$99,782 with Federal Supply Service for Office Supplies. Signed on 2005-12-02. Completion date: 2006-01-04.
$91,387 with Bureau of Prisoners/Federal Prison System for Office Supplies. Signed on 2006-09-21. Completion date: 2006-10-15.
$75,827 with Bureau of Prisoners/Federal Prison System for Drugs and Biologicals. Taking place in PA. Signed on 2006-09-26. Completion date: 2006-10-20.
C F ENTERTAINMENT INC (9903 SANTA MONICA BLVD; small business) : $435,000 in 9 contractsfrom 2001 to 2005
Contracts for Miscellaneous Items by American Forces Information Service, Department of Defense Signed by year:2000: $0; 2001: $95,000; 2002: $95,000; 2003: $95,000; 2004: $95,000; 2005: $55,000; 2006: $0.
Biggest contracts:
$95,000 with American Forces Information Service for Miscellaneous Items. Signed on 2004-10-14. Completion date: 2004-09-30.
$95,000 with Department of Defense for Miscellaneous Items. Signed on 2002-10-08. Completion date: 2003-09-30.
$79,166, same as above.Signed on 2001-11-29. Completion date: 2002-10-29.
$71,250 with American Forces Information Service for Miscellaneous Items. Signed on 2003-12-30. Completion date: 2004-09-30.
PERCEPTRONICS, INC (405 SOUTH BEVERLY DRIVE 4T; small business) : $150,451 in 2 contractsfrom 2000 to 2001
$292,047 with Navy for Services -- Applied Research and Exploratory Development (R&D). Signed on 2000-06-27. Completion date: 2000-05-31.
-$141,596, same as above.Signed on 2001-09-25. Completion date: 2002-05-31.
ARRON HOLDINGS LTD (9461 CHARLEVILLE BLVD STE; small business) : $139,039 in 6 contractsfrom 2004 to 2005
Contracts for Food Items For Resale by Defense Commissary Agency Signed by year:2000: $0; 2001: $0; 2002: $0; 2003: $0; 2004: $43,152; 2005: $95,887; 2006: $0.
Biggest contracts:
$43,908 with Defense Commissary Agency for Food Items For Resale. Signed on 2005-04-01. Completion date: 2005-07-31.
$43,152, same as above.Signed on 2004-10-01. Completion date: 2005-02-28.
$19,361, same as above.Signed on 2005-01-01. Completion date: 2005-03-31.
$16,209, same as above.Signed on 2005-10-01. Completion date: 2005-12-31.
MOTHERS & DAUGHTERS LLC (9454 WILSHIRE BLVD M 11; small business)
$1,690 with Department of Defense for Miscellaneous Items. Signed on 2001-12-05. Completion date: 2002-01-18.
TAMARACK/INTERSERV J.V. (9952 SANTA MONICA BLVD.)
-$4,979 with Air Force for Maintenance, Repair or Alteration of Real Property -- Family Housing Facilities. Taking place in MT. Signed on 2000-01-31. Completion date: 2000-01-31.
Top industries in this zip code by the number of employees in 2005:
Arts, Entertainment, and Recreation: Agents and Managers for Artists, Athletes, Entertainers, and Other Public Figures (500-999 employees: 1 establishment, 250-499 employees: 2 establishments, 100-249 employees: 1 establishment, 50-99 employees: 2 establishments, 20-49 employees: 3 establishments, 5-9 employees: 6 establishments, 1-4 employees: 34 establishments)
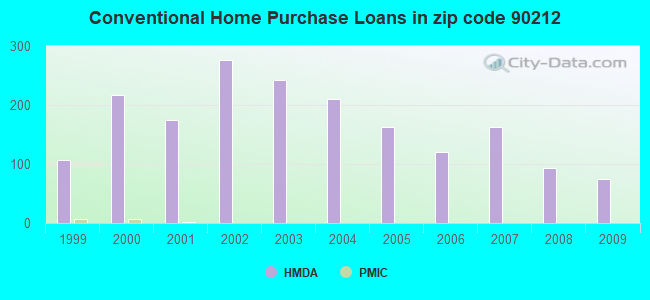
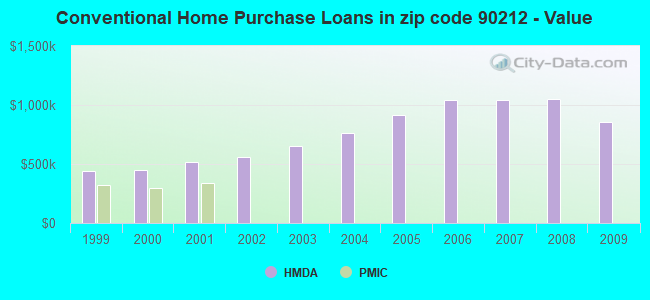
Detailed PMIC statistics for the following Tracts:7009.02
, 7010.00
2005 - 2018 National Fire Incident Reporting System (NFIRS) incidents
Based on the data from the years 2005 - 2018 the average number of fire incidents per year is 12. The highest number of fire incidents - 31 took place in 2014, and the least - 0 in 2006. The data has a growing trend.
When looking into fire subcategories, the most reports belonged to: Structure Fires (41.6%), and Outside Fires (38.0%).
Fire incident types reported to NFIRS in Zip Code 90212


 Nearest zip codes: 90067, 90211, 90035, 90048, 90034, 90064.


 Based on the data from the years 2005 - 2018 the average number of fire incidents per year is 12. The highest number of fire incidents - 31 took place in 2014, and the least - 0 in 2006. The data has a growing trend.
 When looking into fire subcategories, the most reports belonged to: Structure Fires (41.6%), and Outside Fires (38.0%).