Estimated zip code population in 2022: 12,930 Zip code population in 2010: 12,132 Zip code population in 2000: 11,252
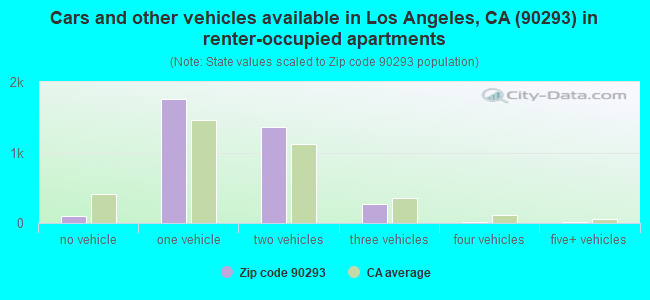
Houses and condos: 7,172 Renter-occupied apartments: 3,499
% of renters here:
52%
State:
44%
March 2022 cost of living index in zip code 90293: 136.6 (high, U.S. average is 100)
Land area: 2.9 sq. mi. Water area: 1.5 sq. mi.
Population density: 4,513 people per square mile
(average).
OSM Map
General Map
Google Map
MSN Map
OSM Map
General Map
Google Map
MSN Map
OSM Map
General Map
Google Map
MSN Map
OSM Map
General Map
Google Map
MSN Map
Please wait while loading the map...
Real estate property taxes paid for housing units in 2022:
This zip code:
0.7% ($6,984)
California:
0.7% ($4,831)
Median real estate property taxes paid for housing units with mortgages in 2022: $7,601 (0.8%) Median real estate property taxes paid for housing units with no mortgage in 2022: $3,876 (0.3%)
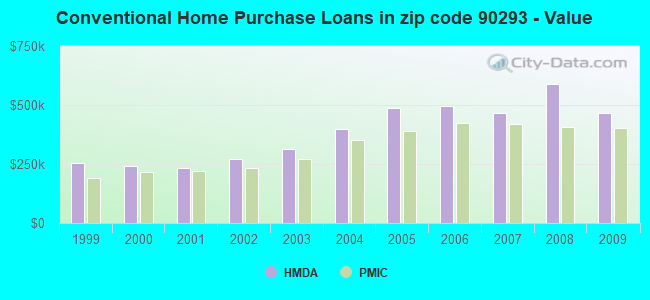
Estimated median house/condo value in 2022: $1,037,528
90293:
$1,037,528
California:
$715,900
According to our research of California and other state lists, there were 5 registered sex offenders living in 90293 zip code as of April 25, 2024. The ratio of all residents to sex offenders in zip code 90293 is 2,566 to 1. The ratio of registered sex offenders to all residents in this zip code is much lower than the state average.
Median resident age:
This zip code:
42.1 years
California median age:
37.9 years
Average household size:
This zip code:
1.9 people
California:
2.8 people
Averages for the 2020 tax year for zip code 90293, filed in 2021:
Average Adjusted Gross Income (AGI) in 2020: $130,384 (Individual Income Tax Returns)
Here:
$130,384
State:
$95,910
Salary/wage: $113,549 (reported on 78.6% of returns)
Here:
$113,549
State:
$77,331
(% of AGI for various income ranges: 993.1% for AGIs below $25k, 3903.1% for AGIs $25k-50k, 7315.8% for AGIs $50k-75k, 10909.7% for AGIs $75k-100k, 21086.5% for AGIs $100k-200k, 113660.0% for AGIs over 200k)
Taxable interest for individuals: $1,798 (reported on 48.0% of returns)
This zip code:
$1,798
California:
$2,294
(% of AGI for various income ranges: 43.4% for AGIs below $25k, 44.3% for AGIs $25k-50k, 69.6% for AGIs $50k-75k, 95.3% for AGIs $75k-100k, 144.7% for AGIs $100k-200k, 1230.0% for AGIs over 200k)
Ordinary dividends: $7,284 (reported on 39.3% of returns)
Here:
$7,284
State:
$10,949
(% of AGI for various income ranges: 87.4% for AGIs below $25k, 146.7% for AGIs $25k-50k, 172.8% for AGIs $50k-75k, 203.0% for AGIs $75k-100k, 536.2% for AGIs $100k-200k, 4448.5% for AGIs over 200k)
Net capital gain/loss in AGI: +$25,264 (reported on 37.8% of returns)
Here:
+$25,264
State:
+$49,306
(% of AGI for various income ranges: 37.5% for AGIs below $25k, 132.8% for AGIs $25k-50k, 171.2% for AGIs $50k-75k, 180.5% for AGIs $75k-100k, 801.5% for AGIs $100k-200k, 21840.4% for AGIs over 200k)
Profit/loss from business: +$18,843 (reported on 24.6% of returns)
Here:
+$18,843
State:
+$15,671
(% of AGI for various income ranges: 272.6% for AGIs below $25k, 505.4% for AGIs $25k-50k, 384.2% for AGIs $50k-75k, 424.7% for AGIs $75k-100k, 750.1% for AGIs $100k-200k, 6133.1% for AGIs over 200k)
Taxable individual retirement arrangement distribution: $24,124 (reported on 9.4% of returns)
90293:
$24,124
California:
$23,505
(% of AGI for various income ranges: 101.2% for AGIs below $25k, 172.6% for AGIs $25k-50k, 194.9% for AGIs $50k-75k, 306.7% for AGIs $75k-100k, 555.2% for AGIs $100k-200k, 2355.4% for AGIs over 200k)
Self-employed (Keogh) retirement plans: $32,913 (reported on 2.1% of returns)
90293:
$32,913
California:
$30,163
(% of AGI for various income ranges: 49.9% for AGIs $50k-75k, 83.5% for AGIs $100k-200k, 1484.6% for AGIs over 200k)
Total itemized deductions: $35,129 (reported on 24.3% of returns)
Here:
$35,129
State:
$39,517
(% of AGI for various income ranges: 296.8% for AGIs below $25k, 514.4% for AGIs $25k-50k, 570.0% for AGIs $50k-75k, 890.7% for AGIs $75k-100k, 1970.3% for AGIs $100k-200k, 10886.5% for AGIs over 200k)
Charity contributions: $7,702 (reported on 20.7% of returns)
Here:
$7,702
State:
$12,598
(% of AGI for various income ranges: 12.9% for AGIs below $25k, 37.0% for AGIs $25k-50k, 55.8% for AGIs $50k-75k, 103.5% for AGIs $75k-100k, 237.9% for AGIs $100k-200k, 3008.8% for AGIs over 200k)
Taxes paid: $9,041 (reported on 24.3% of returns)
90293:
$9,041
State:
$8,807
(% of AGI for various income ranges: 53.2% for AGIs below $25k, 106.2% for AGIs $25k-50k, 156.7% for AGIs $50k-75k, 276.5% for AGIs $75k-100k, 638.5% for AGIs $100k-200k, 2336.2% for AGIs over 200k)
Earned income credit: $976 (reported on 5.4% of returns)
Here:
$976
State:
$2,074
(% of AGI for various income ranges: 40.2% for AGIs below $25k, 18.0% for AGIs $25k-50k)
Percentage of individuals using paid preparers for their 2020 taxes: 93.0%
Here:
93%
State:
92%
(% for various income ranges: 91.7% for AGIs below $25k, 91.6% for AGIs $25k-50k, 94.2% for AGIs $50k-75k, 92.7% for AGIs $75k-100k, 94.2% for AGIs $100k-200k, 93.3% for AGIs over 200k)
Averages for the 2012 tax year for zip code 90293, filed in 2013:
Average Adjusted Gross Income (AGI) in 2012: $97,954 (Individual Income Tax Returns)
Here:
$97,954
State:
$72,726
Salary/wage: $85,193 (reported on 81.3% of returns)
Here:
$85,193
State:
$59,079
(% of AGI for various income ranges: 62.4% for AGIs below $25k, 75.0% for AGIs $25k-50k, 81.3% for AGIs $50k-75k, 80.5% for AGIs $75k-100k, 77.7% for AGIs $100k-200k, 59.0% for AGIs over 200k)
Taxable interest for individuals: $1,763 (reported on 48.8% of returns)
This zip code:
$1,763
California:
$2,146
(% of AGI for various income ranges: 2.1% for AGIs below $25k, 1.1% for AGIs $25k-50k, 0.8% for AGIs $50k-75k, 0.8% for AGIs $75k-100k, 0.8% for AGIs $100k-200k, 0.9% for AGIs over 200k)
Ordinary dividends: $7,231 (reported on 32.2% of returns)
Here:
$7,231
State:
$9,308
(% of AGI for various income ranges: 3.2% for AGIs below $25k, 2.2% for AGIs $25k-50k, 1.4% for AGIs $50k-75k, 1.4% for AGIs $75k-100k, 1.8% for AGIs $100k-200k, 3.4% for AGIs over 200k)
Net capital gain/loss in AGI: +$8,560 (reported on 28.5% of returns)
Here:
+$8,560
State:
+$30,460
(% of AGI for various income ranges: 0.2% for AGIs $50k-75k, 0.6% for AGIs $75k-100k, 1.0% for AGIs $100k-200k, 5.6% for AGIs over 200k)
Profit/loss from business: +$21,390 (reported on 25.0% of returns)
Here:
+$21,390
State:
+$17,064
(% of AGI for various income ranges: 17.6% for AGIs below $25k, 8.9% for AGIs $25k-50k, 5.2% for AGIs $50k-75k, 3.4% for AGIs $75k-100k, 3.9% for AGIs $100k-200k, 5.8% for AGIs over 200k)
Taxable individual retirement arrangement distribution: $20,942 (reported on 10.6% of returns)
90293:
$20,942
California:
$19,557
(% of AGI for various income ranges: 4.0% for AGIs below $25k, 2.5% for AGIs $25k-50k, 2.3% for AGIs $50k-75k, 2.3% for AGIs $75k-100k, 2.7% for AGIs $100k-200k, 1.8% for AGIs over 200k)
Self-employment retirement plans: $27,731 (reported on 2.3% of returns)
90293:
$27,731
California:
$24,530
(% of AGI for various income ranges: 0.7% for AGIs $50k-75k, 0.4% for AGIs $100k-200k, 1.2% for AGIs over 200k)
Total itemized deductions: $32,234 (22% of AGI, reported on 53.8% of returns)
Here:
$32,234
State:
$34,004
Here:
22.2% of AGI
State:
22.7% of AGI
(% of AGI for various income ranges: 24.0% for AGIs below $25k, 14.9% for AGIs $25k-50k, 15.3% for AGIs $50k-75k, 17.7% for AGIs $75k-100k, 18.6% for AGIs $100k-200k, 17.8% for AGIs over 200k)
Charity contributions: $3,427 (reported on 44.4% of returns)
Here:
$3,427
State:
$4,659
(% of AGI for various income ranges: 0.9% for AGIs below $25k, 1.1% for AGIs $25k-50k, 1.2% for AGIs $50k-75k, 1.5% for AGIs $75k-100k, 1.6% for AGIs $100k-200k, 1.8% for AGIs over 200k)
Taxes paid: $14,612 (reported on 53.6% of returns)
90293:
$14,612
State:
$14,448
(% of AGI for various income ranges: 4.9% for AGIs below $25k, 3.5% for AGIs $25k-50k, 4.7% for AGIs $50k-75k, 7.1% for AGIs $75k-100k, 8.1% for AGIs $100k-200k, 10.2% for AGIs over 200k)
Earned income credit: $981 (reported on 6.0% of returns)
Here:
$981
State:
$2,286
(% of AGI for various income ranges: 1.9% for AGIs below $25k, 0.1% for AGIs $25k-50k)
Percentage of individuals using paid preparers for their 2012 taxes: 61.3%
Here:
61%
State:
64%
(% for various income ranges: 55.9% for AGIs below $25k, 56.6% for AGIs $25k-50k, 56.8% for AGIs $50k-75k, 62.2% for AGIs $75k-100k, 67.8% for AGIs $100k-200k, 77.0% for AGIs over 200k)
Averages for the 2004 tax year for zip code 90293, filed in 2005:
Average Adjusted Gross Income (AGI) in 2004: $88,319 (Individual Income Tax Returns)
Here:
$88,319
State:
$58,600
Salary/wage: $70,173 (reported on 81.5% of returns)
Here:
$70,173
State:
$49,455
(% of AGI for various income ranges: 67.3% for AGIs $10k-25k, 83.6% for AGIs $25k-50k, 84.8% for AGIs $50k-75k, 82.7% for AGIs $75k-100k, 53.4% for AGIs over 100k)
Taxable interest for individuals: $2,834 (reported on 56.9% of returns)
This zip code:
$2,834
California:
$2,365
(% of AGI for various income ranges: 3.6% for AGIs $10k-25k, 1.3% for AGIs $25k-50k, 1.0% for AGIs $50k-75k, 1.5% for AGIs $75k-100k, 1.9% for AGIs over 100k)
Taxable dividends: $4,809 (reported on 36.1% of returns)
Here:
$4,809
State:
$4,746
(% of AGI for various income ranges: 4.0% for AGIs $10k-25k, 1.1% for AGIs $25k-50k, 1.7% for AGIs $50k-75k, 1.5% for AGIs $75k-100k, 2.1% for AGIs over 100k)
Net capital gain/loss: +$45,895 (reported on 31.8% of returns)
Here:
+$45,895
State:
+$23,418
(% of AGI for various income ranges: 0.4% for AGIs $10k-25k, 0.4% for AGIs $25k-50k, 0.0% for AGIs $50k-75k, 1.0% for AGIs $75k-100k, 25.7% for AGIs over 100k)
Profit/loss from business: +$17,880 (reported on 24.6% of returns)
Here:
+$17,880
State:
+$16,826
(% of AGI for various income ranges: 14.8% for AGIs $10k-25k, 4.8% for AGIs $25k-50k, 4.9% for AGIs $50k-75k, 3.5% for AGIs $75k-100k, 4.8% for AGIs over 100k)
IRA payment deduction: $2,985 (reported on 4.1% of returns)
90293:
$2,985
California:
$3,192
(% of AGI for various income ranges: 0.5% for AGIs $10k-25k, 0.3% for AGIs $25k-50k, 0.2% for AGIs $50k-75k, 0.2% for AGIs $75k-100k, 0.1% for AGIs over 100k)
Self-employed pension: $19,542 (reported on 3.1% of returns)
Here:
$19,542
California:
$17,688
(% of AGI for various income ranges: 0.2% for AGIs $25k-50k, 0.5% for AGIs $50k-75k, 0.4% for AGIs $75k-100k, 0.9% for AGIs over 100k)
Total itemized deductions: $28,906 (21% of AGI, reported on 54.8% of returns)
Here:
$28,906
State:
$28,113
Here:
21.2% of AGI
State:
25.3% of AGI
(% of AGI for various income ranges: 27.1% for AGIs $10k-25k, 17.0% for AGIs $25k-50k, 20.9% for AGIs $50k-75k, 22.0% for AGIs $75k-100k, 16.0% for AGIs over 100k)
Charity contributions deductions: $3,667 (3% of AGI, reported on 49.4% of returns)
Here:
$3,667
State:
$3,923
Here:
2.6% of AGI
State:
3.3% of AGI
(% of AGI for various income ranges: 1.6% for AGIs $10k-25k, 1.7% for AGIs $25k-50k, 2.2% for AGIs $50k-75k, 2.1% for AGIs $75k-100k, 2.1% for AGIs over 100k)
Total tax: $16,514 (reported on 88.4% of returns)
90293:
$16,514
State:
$10,761
(% of AGI for various income ranges: 6.7% for AGIs $10k-25k, 9.6% for AGIs $25k-50k, 12.3% for AGIs $50k-75k, 13.2% for AGIs $75k-100k, 19.3% for AGIs over 100k)
Earned income credit: $829 (reported on 5.3% of returns)
Here:
$829
State:
$1,763
Percentage of individuals using paid preparers for their 2004 taxes: 64.3%
Here:
64%
State:
66%
(% for various income ranges: 59.7% for AGIs below $10k, 61.1% for AGIs $10k-25k, 59.4% for AGIs $25k-50k, 63.4% for AGIs $50k-75k, 69.0% for AGIs $75k-100k, 73.2% for AGIs over 100k)
Likely homosexual households (counted as self-reported same-sex unmarried-partner households)
Lesbian couples: 0.0% of all households
Gay men: 0.5% of all households
Household received Food Stamps/SNAP in the past 12 months: 335 Household did not receive Food Stamps/SNAP in the past 12 months: 6,326
Women who had a birth in the past 12 months: 49 (39 now married, 10 unmarried) Women who did not have a birth in the past 12 months: 2,902 (894 now married, 2,018 unmarried)
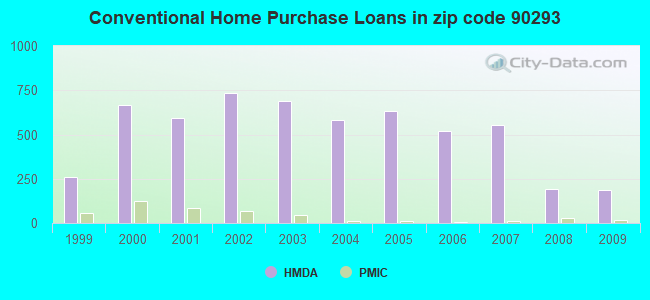
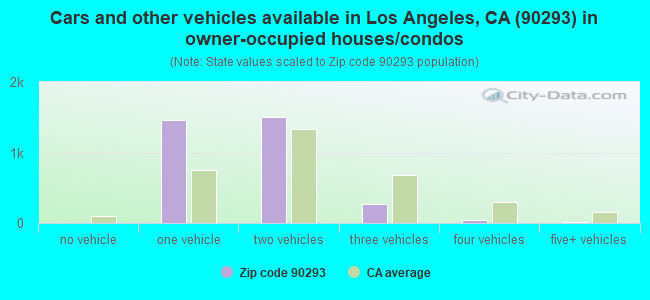
Housing units in zip code 90293 with a mortgage: 2,374 (132 second mortgage, 107 both second mortgage and home equity loan) Median monthly owner costs for units with a mortgage: $3,448 Median monthly owner costs for units without a mortgage: $1,007
Residents with income below the poverty level in 2022:
This zip code:
6.7%
Whole state:
12.2%
Residents with income below 50% of the poverty level in 2022:
This zip code:
3.4%
Whole state:
6.2%
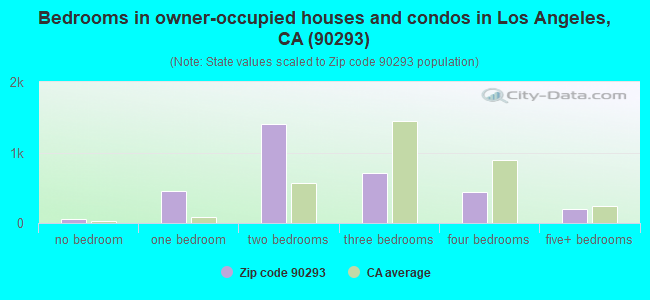
Median number of rooms in houses and condos:
Here:
5.0
State:
6.0
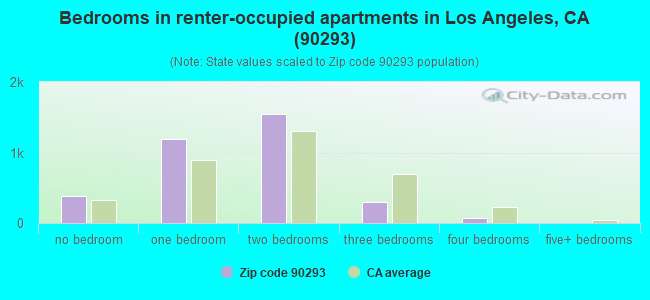
Median number of rooms in apartments:
Here:
3.7
State:
3.9
Notable locations in this zip code not listed on our city pages
865 married couples with children.
229 single-parent households (160 men, 69 women).
77.7% of residents of 90293 zip code speak English at home.
8.8% of residents speak Spanish at home (88% very well, 7% well, 4% not well, 2% not at all).
5.0% of residents speak other Indo-European language at home (80% very well, 14% well, 6% not well).
5.7% of residents speak Asian or Pacific Island language at home (64% very well, 36% well).
2.7% of residents speak other language at home (79% very well, 21% well).
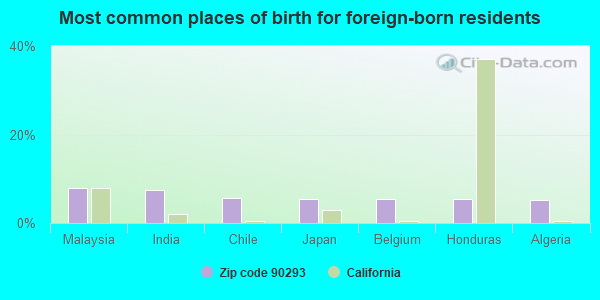
Foreign born population: 1,989 (15.4%) (72.7% of them are naturalized citizens)
This zip code:
15.4%
Whole state:
26.7%
8%Malaysia
7%India
6%Chile
5%Japan
5%Belgium
5%Honduras
5%Algeria
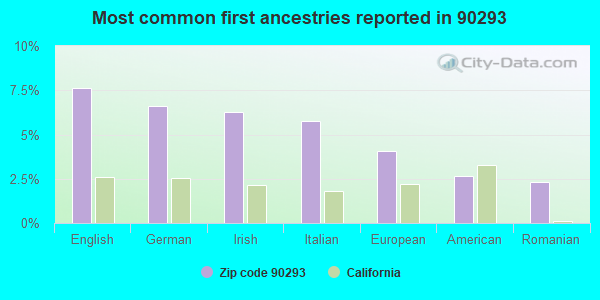
8%English
7%German
6%Irish
6%Italian
4%European
3%American
2%Romanian
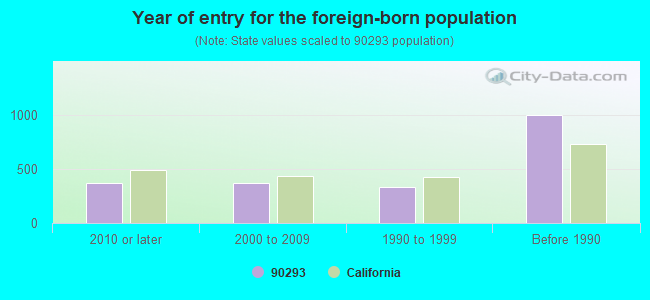
Year of entry for the foreign-born population
3722010 or later
3662000 to 2009
3321990 to 1999
996Before 1990
Private high school in in this zip code not listed on the city page:
ST BERNARD HIGH SCHOOL (Students: 357, Location: 9100 FALMOUTH AVE, Grades: 9-12)
Public elementary/middle school in in zip code 90293 not listed on the city page:
Facilities with environmental interests located in this zip code:
HYPERION TREATMENT PLANT (12000 VISTA DEL MAR in PLAYA DEL REY, CA)
AIR MAJOR (AIRS/AFS) (Integrated Compliance Information System) - ICIS-09-1977-0004, FORMAL ENFORCEMENT ACTION, ICIS-09-1986-0021, COMPLIANCE ACTIVITY (Tracking inspections of insecticide, fungicide, and rodenticide, and toxic substances) CRITERIA AND HAZARDOUS AIR POLLUTANT INVENTORY (Inventory of air pollution sources) National Pollutant Discharge Elimination System MAJOR (Tracking pollutant discharge elimination systems) - permit HAZARDOUS WASTE BIENNIAL REPORTER (Resource Conservation and Recovery Act (tracking hazardous waste)) Large Quantity Generators, more that 1000 kg of hazardous waste/month (Resource Conservation and Recovery Act (tracking hazardous waste)) - notification TRANSPORTER (Resource Conservation and Recovery Act (tracking hazardous waste)) Business SIC classification: SEWERAGE SYSTEMS; SANITARY SERVICES; AIR AND WATER RESOURCE AND SOLID WASTE MANAGEMENT Organizations: CITY OF LOS ANGELES (CONTACT/OPERATOR)
, LA CITY BUREAU OF SANITATION (CONTACT/OWNER)
Alternative names: HYPERION WASTE TREATMENT PLANT, LA CITY SANITATION BUREAU, LA CITY, SANITATION BUREAU (NS, LOS ANGELES, CITY OF, LOS ANGELES CITY OF SANITATION
EXXONMOBIL OIL CORP (449 W MANCHESTER AVE in PLAYA DEL REY, CA)
HAZARDOUS WASTE BIENNIAL REPORTER (Resource Conservation and Recovery Act (tracking hazardous waste)) Large Quantity Generators, more that 1000 kg of hazardous waste/month (Resource Conservation and Recovery Act (tracking hazardous waste)) Organizations: EXXONMOBIL OIL CORPORATION (CONTACT/OWNER)
LA HYPERION SLUDGE PLANT (12000 VISTA DEL MAR BLVD in PLAYA DEL REY, CA)
Small Quantity Generators, between 100 kg and 1000 kg of hazardous waste/month (Resource Conservation and Recovery Act (tracking hazardous waste)) - notification Organizations: CITY OF LOS ANGELES (CONTACT/OWNER)
MR SPOTLESS CLEANERS (8416 PERSHING DR in PLAYA DEL REY, CA)
Small Quantity Generators, between 100 kg and 1000 kg of hazardous waste/month (Resource Conservation and Recovery Act (tracking hazardous waste)) - notification Organizations: MATSUI NORMA (CONTACT/OWNER)
LA COUNTY BEACHES & HARBORS (8255 VISTA DEL MAR in PLAYA DEL REY, CA)
Small Quantity Generators, between 100 kg and 1000 kg of hazardous waste/month (Resource Conservation and Recovery Act (tracking hazardous waste))
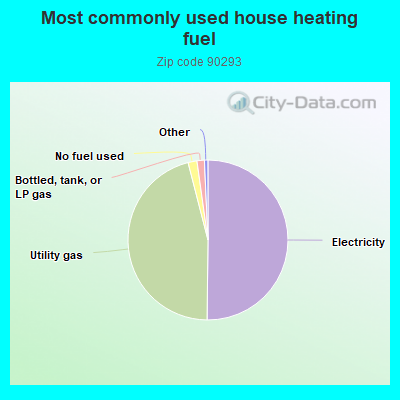
Housing units lacking complete kitchen facilities: 0.6%
50.2%Electricity
45.8%Utility gas
1.8%No fuel used
1.5%Bottled, tank, or LP gas
Population in 1990: 11,477.
Place of birth for U.S.-born residents:
This state: 5,599
Northeast: 1,918
Midwest: 1,399
South: 1,223
West: 586
48% of the 90293 zip code residents lived in the same house 5 years ago. Out of people who lived in different houses, 63% lived in this county. Out of people who lived in different counties, 50% lived in California.
84% of the 90293 zip code residents lived in the same house 1 year ago. Out of people who lived in different houses, 68% moved from this county. Out of people who lived in different houses, 9% moved from different county within same state. Out of people who lived in different houses, 18% moved from different state. Out of people who lived in different houses, 1% moved from abroad.
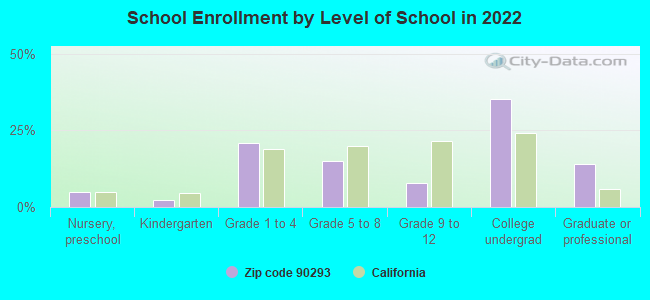
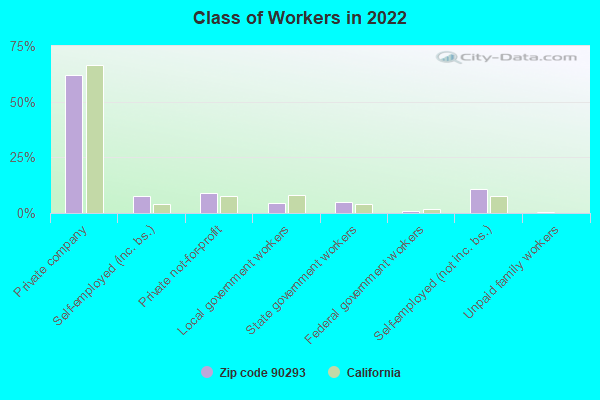
Private vs. public school enrollment:
Students in private schools in grades 1 to 8 (elementary and middle school): 492
Here:
68.8%
California:
10.5%
Students in private schools in grades 9 to 12 (high school): 81
Here:
55.2%
California:
8.5%
Students in private undergraduate colleges: 242
Here:
36.3%
California:
15.9%
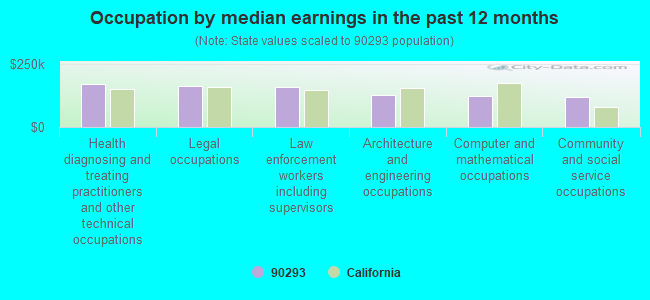
Occupation by median earnings in the past 12 months ($)
169,753Health diagnosing and treating practitioners and other technical occupations
160,474Legal occupations
158,840Law enforcement workers including supervisors
125,745Architecture and engineering occupations
123,056Computer and mathematical occupations
119,888Community and social service occupations
Companies with federal contracts located in this zip code (PLAYA DEL REY, CA):
MARTINEZ AMADOR ARCHITECTS INC (8405 PERSHING DR STE 201; small business) : $1,672,956 in 70 contractsfrom 1999 to 2005
Contracts for Other Architect and Engineering Services, Administrative and Service Buildings, Architect - Engineer Services (including landscaping, interior layout, and designing), Other Buildings, and moreby Navy, Army Signed by year:2000: $1,094,353; 2001: -$3,420; 2002: $22,383; 2003: $94,509; 2004: $38,255; 2005: -$55,109; 2006: $0.
Biggest contracts:
$202,598 with Navy for Other Architect and Engineering Services. Signed on 1999-11-04. Completion date: 1999-07-15.
$178,510 with Navy for Administrative and Service Buildings. Signed on 1999-12-01. Completion date: 2000-04-05.
$165,000, same as above.Signed on 2000-06-13. Completion date: 2000-11-06.
$157,992 with Navy for Architect - Engineer Services (including landscaping, interior layout, and designing). Signed on 2000-03-14. Completion date: 2000-12-31.
MARQUIS EVENTS, INC (355A PERSHING DR; small business) : $383,458 in 27 contractsfrom 2003 to 2005
Contracts for Other Management Support Services, Lease or Rental of Equipment -- Ship and Marine Equipment, Miscellaneous Items, Lease or Rental of Equipment -- Miscellaneous, and moreby Navy Signed by year:2000: $0; 2001: $0; 2002: $0; 2003: $110,369; 2004: $152,587; 2005: $120,502; 2006: $0.
Biggest contracts:
$59,993 with Navy for Other Management Support Services. Signed on 2003-07-07. Completion date: 2003-07-27.
$55,603, same as above.Signed on 2005-06-28. Completion date: 2005-08-03.
$54,493 with Navy for Lease or Rental of Equipment -- Ship and Marine Equipment. Signed on 2005-09-14. Completion date: 2005-11-14.
$39,435 with Navy for Miscellaneous Items. Signed on 2003-09-16. Completion date: 2003-10-20.
LASER MAGIC PRODUCTIONS (401 CAMPDELL ST; small business) : $31,850 in 2 contractsfrom 2002 to 2003
$17,150 with Army for Photographic Projection Equipment. Signed on 2003-07-10. Completion date: 2003-07-31.
$14,700, same as above.Signed on 2002-11-22. Completion date: 2002-12-02.
CONCEPTUAL RESEARCH CORPORATIO (411 REES ST; small business)
$9,360 with Air Force for ADPE System Configuration. Taking place in OH. Signed on 2003-06-19. Completion date: 2003-07-18.
Top industries in this zip code by the number of employees in 2005:


 Nearest zip codes: 90045, 90094, 90292, 90245, 90291, 90066.
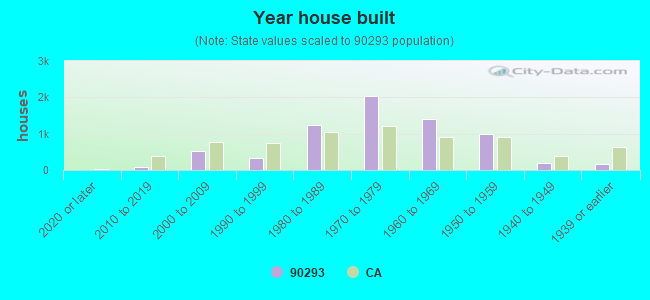


 (Students: 357, Location: 9100 FALMOUTH AVE, Grades: 9-12)