Estimated zip code population in 2022: 12,454 Zip code population in 2010: 13,361 Zip code population in 2000: 13,149
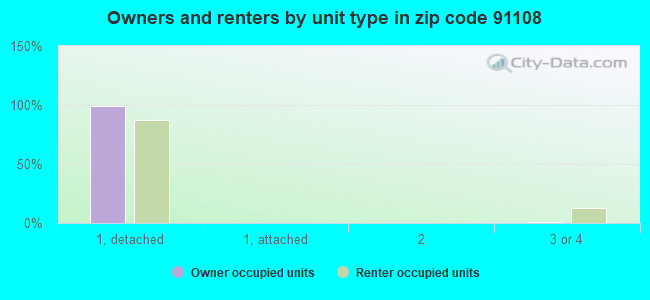
Houses and condos: 4,689 Renter-occupied apartments: 715
% of renters here:
18%
State:
44%
March 2022 cost of living index in zip code 91108: 145.9 (very high, U.S. average is 100)
Land area: 3.8 sq. mi. Water area: 0.0 sq. mi.
Population density: 3,267 people per square mile
(average).
OSM Map
General Map
Google Map
MSN Map
OSM Map
General Map
Google Map
MSN Map
OSM Map
General Map
Google Map
MSN Map
OSM Map
General Map
Google Map
MSN Map
Please wait while loading the map...
Real estate property taxes paid for housing units in 2022:
This zip code:
0.5% ($10,292)
California:
0.7% ($4,831)
Median real estate property taxes paid for housing units with mortgages in 2022: $10,330 (0.5%) Median real estate property taxes paid for housing units with no mortgage in 2022: $10,572 (0.5%)
Estimated median house/condo value in 2022: $2,171,698
91108:
$2,171,698
California:
$715,900
According to our research of California and other state lists, there were 2 registered sex offenders living in 91108 zip code as of April 25, 2024. The ratio of all residents to sex offenders in zip code 91108 is 6,936 to 1. The ratio of registered sex offenders to all residents in this zip code is much lower than the state average.
Median resident age:
This zip code:
46.5 years
California median age:
37.9 years
Average household size:
This zip code:
3.0 people
California:
2.8 people
Averages for the 2020 tax year for zip code 91108, filed in 2021:
Average Adjusted Gross Income (AGI) in 2020: $345,205 (Individual Income Tax Returns)
Here:
$345,205
State:
$95,910
Salary/wage: $169,461 (reported on 67.6% of returns)
Here:
$169,461
State:
$77,331
(% of AGI for various income ranges: 1611.7% for AGIs below $25k, 4430.5% for AGIs $25k-50k, 8443.8% for AGIs $50k-75k, 12137.5% for AGIs $75k-100k, 20747.2% for AGIs $100k-200k, 159973.3% for AGIs over 200k)
Taxable interest for individuals: $13,310 (reported on 69.3% of returns)
This zip code:
$13,310
California:
$2,294
(% of AGI for various income ranges: 181.7% for AGIs below $25k, 291.5% for AGIs $25k-50k, 610.0% for AGIs $50k-75k, 781.5% for AGIs $75k-100k, 1330.2% for AGIs $100k-200k, 13407.5% for AGIs over 200k)
Ordinary dividends: $52,923 (reported on 60.7% of returns)
Here:
$52,923
State:
$10,949
(% of AGI for various income ranges: 238.5% for AGIs below $25k, 350.3% for AGIs $25k-50k, 845.4% for AGIs $50k-75k, 1261.0% for AGIs $75k-100k, 2656.0% for AGIs $100k-200k, 52000.6% for AGIs over 200k)
Net capital gain/loss in AGI: +$133,513 (reported on 58.5% of returns)
Here:
+$133,513
State:
+$49,306
(% of AGI for various income ranges: 170.0% for AGIs below $25k, 510.0% for AGIs $25k-50k, 896.5% for AGIs $50k-75k, 1135.5% for AGIs $75k-100k, 2831.5% for AGIs $100k-200k, 133445.0% for AGIs over 200k)
Profit/loss from business: +$43,482 (reported on 21.3% of returns)
Here:
+$43,482
State:
+$15,671
(% of AGI for various income ranges: 318.8% for AGIs below $25k, 381.5% for AGIs $25k-50k, 600.0% for AGIs $50k-75k, 702.5% for AGIs $75k-100k, 1600.8% for AGIs $100k-200k, 12879.4% for AGIs over 200k)
Taxable individual retirement arrangement distribution: $49,551 (reported on 11.3% of returns)
91108:
$49,551
California:
$23,505
(% of AGI for various income ranges: 58.7% for AGIs below $25k, 241.5% for AGIs $25k-50k, 331.2% for AGIs $50k-75k, 762.0% for AGIs $75k-100k, 1860.5% for AGIs $100k-200k, 6821.1% for AGIs over 200k)
Self-employed (Keogh) retirement plans: $49,388 (reported on 3.9% of returns)
91108:
$49,388
California:
$30,163
(% of AGI for various income ranges: 124.2% for AGIs $100k-200k, 3291.7% for AGIs over 200k)
Total itemized deductions: $79,888 (reported on 32.6% of returns)
Here:
$79,888
State:
$39,517
(% of AGI for various income ranges: 362.2% for AGIs below $25k, 731.8% for AGIs $25k-50k, 1484.6% for AGIs $50k-75k, 2409.5% for AGIs $75k-100k, 4435.5% for AGIs $100k-200k, 37422.2% for AGIs over 200k)
Charity contributions: $46,338 (reported on 27.7% of returns)
Here:
$46,338
State:
$12,598
(% of AGI for various income ranges: 15.3% for AGIs below $25k, 42.1% for AGIs $25k-50k, 146.2% for AGIs $50k-75k, 351.0% for AGIs $75k-100k, 870.0% for AGIs $100k-200k, 21444.7% for AGIs over 200k)
Taxes paid: $9,512 (reported on 32.6% of returns)
91108:
$9,512
State:
$8,807
(% of AGI for various income ranges: 91.0% for AGIs below $25k, 190.8% for AGIs $25k-50k, 315.4% for AGIs $50k-75k, 589.0% for AGIs $75k-100k, 991.5% for AGIs $100k-200k, 3480.6% for AGIs over 200k)
Earned income credit: $1,192 (reported on 3.9% of returns)
Here:
$1,192
State:
$2,074
(% of AGI for various income ranges: 32.0% for AGIs below $25k, 27.2% for AGIs $25k-50k)
Percentage of individuals using paid preparers for their 2020 taxes: 90.9%
Here:
91%
State:
92%
(% for various income ranges: 88.8% for AGIs below $25k, 90.4% for AGIs $25k-50k, 91.5% for AGIs $50k-75k, 91.5% for AGIs $75k-100k, 90.2% for AGIs $100k-200k, 92.7% for AGIs over 200k)
Averages for the 2012 tax year for zip code 91108, filed in 2013:
Average Adjusted Gross Income (AGI) in 2012: $281,338 (Individual Income Tax Returns)
Here:
$281,338
State:
$72,726
Salary/wage: $168,214 (reported on 68.8% of returns)
Here:
$168,214
State:
$59,079
(% of AGI for various income ranges: 70.3% for AGIs below $25k, 64.2% for AGIs $25k-50k, 63.9% for AGIs $50k-75k, 56.8% for AGIs $75k-100k, 53.3% for AGIs $100k-200k, 38.1% for AGIs over 200k)
Taxable interest for individuals: $8,827 (reported on 72.3% of returns)
This zip code:
$8,827
California:
$2,146
(% of AGI for various income ranges: 7.3% for AGIs below $25k, 3.8% for AGIs $25k-50k, 3.6% for AGIs $50k-75k, 2.9% for AGIs $75k-100k, 2.7% for AGIs $100k-200k, 2.1% for AGIs over 200k)
Ordinary dividends: $35,868 (reported on 58.6% of returns)
Here:
$35,868
State:
$9,308
(% of AGI for various income ranges: 9.8% for AGIs below $25k, 6.2% for AGIs $25k-50k, 6.2% for AGIs $50k-75k, 6.2% for AGIs $75k-100k, 5.4% for AGIs $100k-200k, 7.8% for AGIs over 200k)
Net capital gain/loss in AGI: +$74,431 (reported on 55.2% of returns)
Here:
+$74,431
State:
+$30,460
(% of AGI for various income ranges: 0.7% for AGIs below $25k, 1.8% for AGIs $25k-50k, 2.1% for AGIs $50k-75k, 2.3% for AGIs $75k-100k, 3.0% for AGIs $100k-200k, 16.8% for AGIs over 200k)
Profit/loss from business: +$54,247 (reported on 22.8% of returns)
Here:
+$54,247
State:
+$17,064
(% of AGI for various income ranges: 14.3% for AGIs below $25k, 10.7% for AGIs $25k-50k, 5.5% for AGIs $50k-75k, 6.3% for AGIs $75k-100k, 6.8% for AGIs $100k-200k, 3.8% for AGIs over 200k)
Taxable individual retirement arrangement distribution: $44,176 (reported on 14.4% of returns)
91108:
$44,176
California:
$19,557
(% of AGI for various income ranges: 3.2% for AGIs below $25k, 3.8% for AGIs $25k-50k, 5.6% for AGIs $50k-75k, 3.7% for AGIs $75k-100k, 5.0% for AGIs $100k-200k, 1.8% for AGIs over 200k)
Self-employment retirement plans: $44,217 (reported on 5.7% of returns)
91108:
$44,217
California:
$24,530
(% of AGI for various income ranges: 1.2% for AGIs $25k-50k, 1.1% for AGIs $100k-200k, 0.9% for AGIs over 200k)
Total itemized deductions: $88,623 (21% of AGI, reported on 63.1% of returns)
Here:
$88,623
State:
$34,004
Here:
20.7% of AGI
State:
22.7% of AGI
(% of AGI for various income ranges: 36.7% for AGIs below $25k, 24.2% for AGIs $25k-50k, 24.0% for AGIs $50k-75k, 26.9% for AGIs $75k-100k, 26.6% for AGIs $100k-200k, 18.6% for AGIs over 200k)
Charity contributions: $19,973 (reported on 54.9% of returns)
Here:
$19,973
State:
$4,659
(% of AGI for various income ranges: 1.6% for AGIs below $25k, 1.5% for AGIs $25k-50k, 2.7% for AGIs $50k-75k, 3.1% for AGIs $75k-100k, 3.0% for AGIs $100k-200k, 4.1% for AGIs over 200k)
Taxes paid: $48,085 (reported on 62.8% of returns)
91108:
$48,085
State:
$14,448
(% of AGI for various income ranges: 14.3% for AGIs below $25k, 9.6% for AGIs $25k-50k, 8.8% for AGIs $50k-75k, 10.6% for AGIs $75k-100k, 11.5% for AGIs $100k-200k, 10.7% for AGIs over 200k)
Earned income credit: $1,308 (reported on 4.2% of returns)
Here:
$1,308
State:
$2,286
(% of AGI for various income ranges: 1.7% for AGIs below $25k, 0.3% for AGIs $25k-50k)
Percentage of individuals using paid preparers for their 2012 taxes: 74.8%
Here:
75%
State:
64%
(% for various income ranges: 69.4% for AGIs below $25k, 70.3% for AGIs $25k-50k, 71.2% for AGIs $50k-75k, 75.0% for AGIs $75k-100k, 76.1% for AGIs $100k-200k, 81.6% for AGIs over 200k)
Averages for the 2004 tax year for zip code 91108, filed in 2005:
Average Adjusted Gross Income (AGI) in 2004: $223,337 (Individual Income Tax Returns)
Here:
$223,337
State:
$58,600
Salary/wage: $135,530 (reported on 66.8% of returns)
Here:
$135,530
State:
$49,455
(% of AGI for various income ranges: 61.8% for AGIs $10k-25k, 63.7% for AGIs $25k-50k, 54.2% for AGIs $50k-75k, 54.5% for AGIs $75k-100k, 37.6% for AGIs over 100k)
Taxable interest for individuals: $7,148 (reported on 78.8% of returns)
This zip code:
$7,148
California:
$2,365
(% of AGI for various income ranges: 10.0% for AGIs $10k-25k, 6.3% for AGIs $25k-50k, 4.5% for AGIs $50k-75k, 3.6% for AGIs $75k-100k, 2.1% for AGIs over 100k)
Taxable dividends: $20,285 (reported on 62.3% of returns)
Here:
$20,285
State:
$4,746
(% of AGI for various income ranges: 8.4% for AGIs $10k-25k, 5.7% for AGIs $25k-50k, 5.0% for AGIs $50k-75k, 5.1% for AGIs $75k-100k, 5.4% for AGIs over 100k)
Net capital gain/loss: +$75,153 (reported on 58.4% of returns)
Here:
+$75,153
State:
+$23,418
(% of AGI for various income ranges: 0.8% for AGIs $10k-25k, 2.2% for AGIs $25k-50k, 5.2% for AGIs $50k-75k, 4.8% for AGIs $75k-100k, 20.3% for AGIs over 100k)
Profit/loss from business: +$45,934 (reported on 23.0% of returns)
Here:
+$45,934
State:
+$16,826
(% of AGI for various income ranges: 11.7% for AGIs $10k-25k, 7.2% for AGIs $25k-50k, 9.2% for AGIs $50k-75k, 6.4% for AGIs $75k-100k, 4.3% for AGIs over 100k)
Profit/loss from farming: +$12,800 (reported on 0.2% of returns)
Here:
+$12,800
State:
-$7,562
IRA payment deduction: $4,205 (reported on 6.6% of returns)
91108:
$4,205
California:
$3,192
(% of AGI for various income ranges: 0.8% for AGIs $10k-25k, 1.0% for AGIs $25k-50k, 0.6% for AGIs $50k-75k, 0.6% for AGIs $75k-100k, 0.1% for AGIs over 100k)
Self-employed pension: $31,703 (reported on 6.6% of returns)
Here:
$31,703
California:
$17,688
(% of AGI for various income ranges: 0.2% for AGIs $25k-50k, 0.7% for AGIs $50k-75k, 1.0% for AGIs $75k-100k, 0.9% for AGIs over 100k)
Total itemized deductions: $68,773 (19% of AGI, reported on 60.2% of returns)
Here:
$68,773
State:
$28,113
Here:
18.8% of AGI
State:
25.3% of AGI
(% of AGI for various income ranges: 27.4% for AGIs $10k-25k, 27.6% for AGIs $25k-50k, 29.2% for AGIs $50k-75k, 31.5% for AGIs $75k-100k, 17.1% for AGIs over 100k)
Charity contributions deductions: $16,052 (4% of AGI, reported on 54.0% of returns)
Here:
$16,052
State:
$3,923
Here:
4.1% of AGI
State:
3.3% of AGI
(% of AGI for various income ranges: 1.9% for AGIs $10k-25k, 2.7% for AGIs $25k-50k, 2.8% for AGIs $50k-75k, 3.3% for AGIs $75k-100k, 3.9% for AGIs over 100k)
Total tax: $60,311 (reported on 79.9% of returns)
91108:
$60,311
State:
$10,761
(% of AGI for various income ranges: 5.2% for AGIs $10k-25k, 7.7% for AGIs $25k-50k, 8.9% for AGIs $50k-75k, 9.5% for AGIs $75k-100k, 22.1% for AGIs over 100k)
Earned income credit: $1,196 (reported on 3.5% of returns)
Here:
$1,196
State:
$1,763
Percentage of individuals using paid preparers for their 2004 taxes: 73.6%
Here:
74%
State:
66%
(% for various income ranges: 67.1% for AGIs below $10k, 68.1% for AGIs $10k-25k, 67.4% for AGIs $25k-50k, 75.9% for AGIs $50k-75k, 72.6% for AGIs $75k-100k, 80.3% for AGIs over 100k)
Likely homosexual households (counted as self-reported same-sex unmarried-partner households)
Lesbian couples: 0.5% of all households
Gay men: 0.0% of all households
Household received Food Stamps/SNAP in the past 12 months: 0 Household did not receive Food Stamps/SNAP in the past 12 months: 3,963
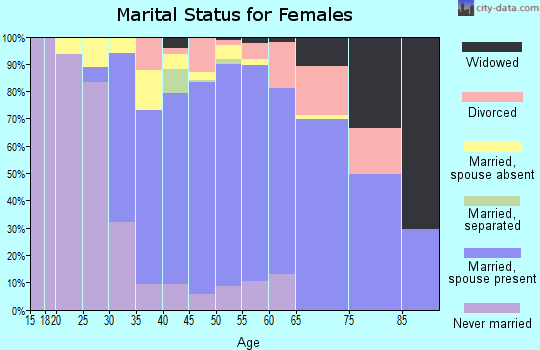
Women who had a birth in the past 12 months: 38 (38 now married, 0 unmarried) Women who did not have a birth in the past 12 months: 2,407 (1,127 now married, 1,272 unmarried)
Housing units in zip code 91108 with a mortgage: 1,811 (273 second mortgage, 13 home equity loan, 261 both second mortgage and home equity loan) Houses without a mortgage: 42
Median monthly owner costs for units with a mortgage: $3,876 Median monthly owner costs for units without a mortgage: $1,556
Residents with income below the poverty level in 2022:
This zip code:
9.2%
Whole state:
12.2%
Residents with income below 50% of the poverty level in 2022:
This zip code:
3.8%
Whole state:
6.2%
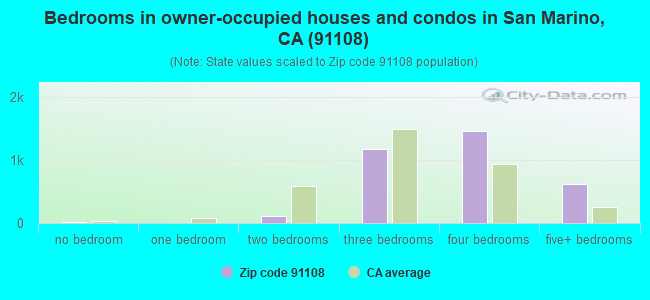
Median number of rooms in houses and condos:
Here:
7.5
State:
6.0
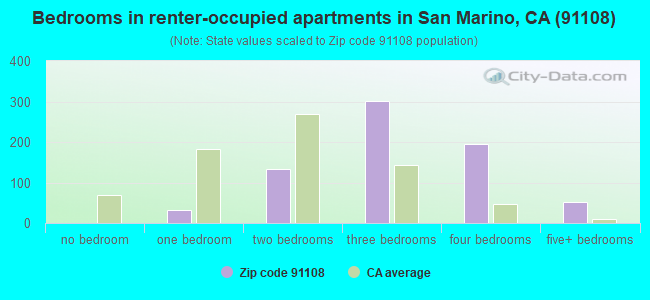
Median number of rooms in apartments:
Here:
6.2
State:
3.9
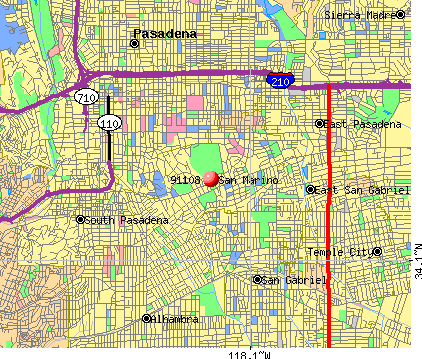
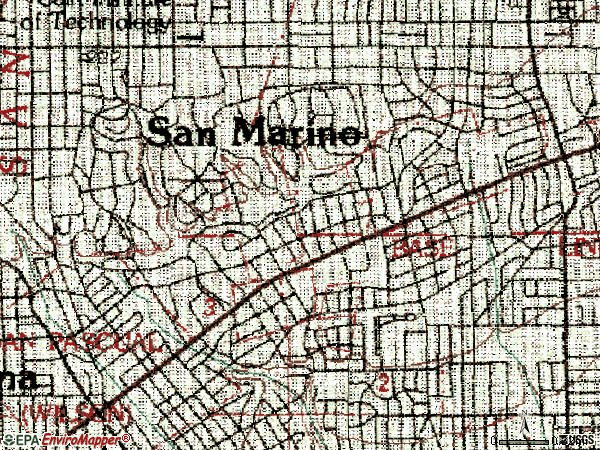
Notable locations in this zip code not listed on our city pages
Notable locations in zip code 91108: El Molino Viejo (A), Huntington Library (B), San Marino Public Library (C), San Marino City Hall (D), San Marino Fire Department (E). Display/hide their locations on the map
Churches in zip code 91108 include: Saint Edmund's Episcopal Church (A), Saints Felicitas and Perpetua Church (B), San Marino Congregational Church (C), San Marino Community Presbyterian Church (D). Display/hide their locations on the map
In group quarters: 133 (-1 institutionalized population)
Size of family households: 1,484 2-persons, 770 3-persons, 747 4-persons, 267 5-persons, 78 6-persons, 76 7-or-more-persons
Size of nonfamily households: 560 1-person, 68 2-persons
2,183 married couples with children.
198 single-parent households (89 men, 109 women).
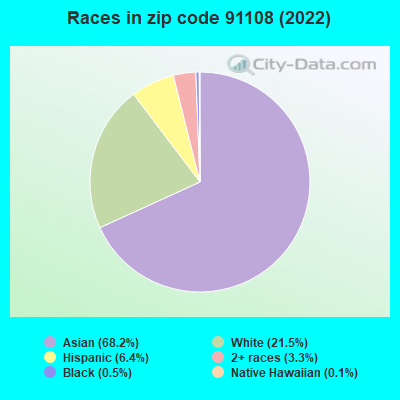
41.0% of residents of 91108 zip code speak English at home.
4.8% of residents speak Spanish at home (64% very well, 28% well, 8% not well).
2.3% of residents speak other Indo-European language at home (95% very well, 5% well).
52.3% of residents speak Asian or Pacific Island language at home (55% very well, 29% well, 13% not well, 3% not at all).
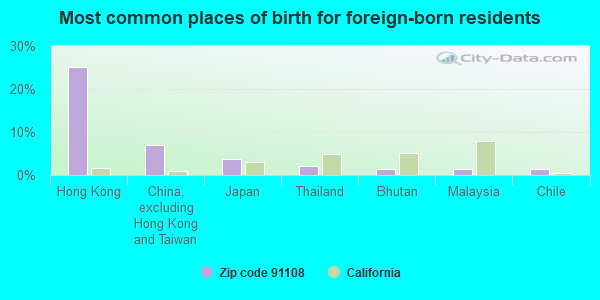
Foreign born population: 5,955 (47.8%) (60.4% of them are naturalized citizens)
This zip code:
47.8%
Whole state:
26.7%
25%Hong Kong
7%China, excluding Hong Kong and Taiwan
4%Japan
2%Thailand
1%Bhutan
1%Malaysia
1%Chile
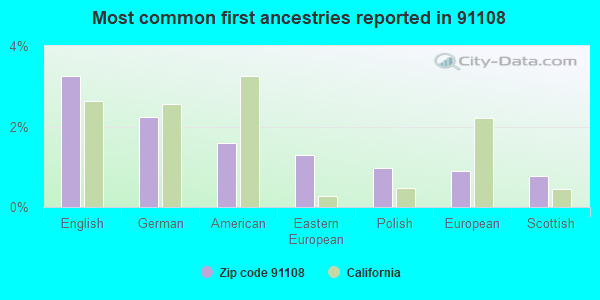
3%English
2%German
2%American
1%Eastern European
1%Polish
1%European
1%Scottish
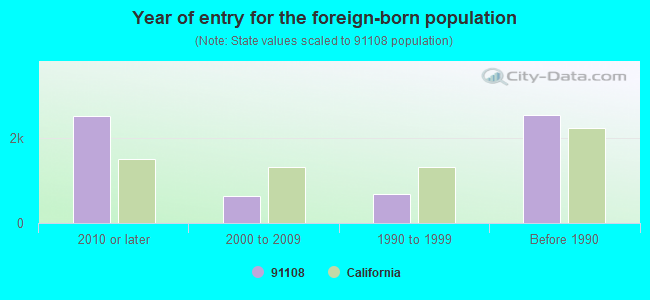
Year of entry for the foreign-born population
2,5152010 or later
6402000 to 2009
6901990 to 1999
2,547Before 1990
Facilities with environmental interests located in this zip code:
CHEVRON STATION 95984 (2155 HUNTINGTON DR in SAN MARINO, CA)
STATE MASTER (California - Hazardous Waste Tracking) - HAZARDOU WASTE PROGRAM Large Quantity Generators, more that 1000 kg of hazardous waste/month (Resource Conservation and Recovery Act (tracking hazardous waste)) Organizations: CHEVRON PRODUCTS CO. (CONTACT/OPERATOR)
Alternative names: CHEVRON STATION 9 5984
KNIGHT CLEANERS (864 HUNTINGTON DRIVE in SAN MARINO, CA)
STATE MASTER (California - Hazardous Waste Tracking) - HAZARDOU WASTE PROGRAM Small Quantity Generators, between 100 kg and 1000 kg of hazardous waste/month (Resource Conservation and Recovery Act (tracking hazardous waste)) - notification Organizations: MRS ZAURI (CONTACT/OWNER)
HUNTINGTON MIDDLE (1700 HUNTINGTON DR. in SAN MARINO, CA)
(National Center for Education Statistics) - STATE ID-6022503 Organizations: SAN MARINO UNIFIED (SCHOOL DISTRICT)
CARVER ELEMENTARY (3100 HUNTINGTON DRIVE in SAN MARINO, CA)
(National Center for Education Statistics) - STATE ID-6022495 Organizations: SAN MARINO UNIFIED (SCHOOL DISTRICT)
CALIFORNIA AMERICAN WATER COMPANY (SAN MARINO) (DRINKING WATER SYSTEM in SAN MARINO, CA)
(Integrated Compliance Information System) - ICIS-09-2004-0159, FORMAL ENFORCEMENT ACTION
FASHION CLEANERS (2285 HUNTINGTON DR in SAN MARINO, CA)
Small Quantity Generators, between 100 kg and 1000 kg of hazardous waste/month (Resource Conservation and Recovery Act (tracking hazardous waste)) - notification Organizations: MEGERDICH HARAMIAN (CONTACT/OWNER)
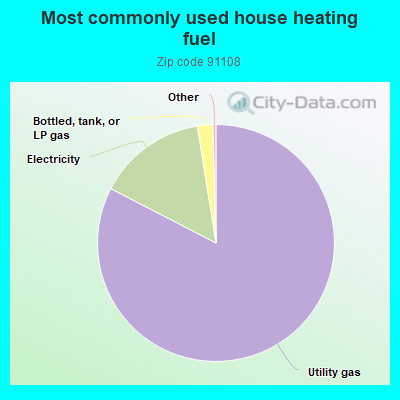
Housing units lacking complete plumbing facilities: 1.2% Housing units lacking complete kitchen facilities: 1.3%
82.6%Utility gas
14.9%Electricity
2.1%Bottled, tank, or LP gas
Population in 1990: 12,953. Population change in the 1990s: +196 (+1.5%).
Place of birth for U.S.-born residents:
This state: 5,049
Northeast: 322
Midwest: 308
South: 264
West: 320
63% of the 91108 zip code residents lived in the same house 5 years ago. Out of people who lived in different houses, 93% lived in this county. Out of people who lived in different counties, 50% lived in California.
87% of the 91108 zip code residents lived in the same house 1 year ago. Out of people who lived in different houses, 31% moved from this county. Out of people who lived in different houses, 9% moved from different county within same state. Out of people who lived in different houses, 7% moved from different state. Out of people who lived in different houses, 62% moved from abroad.
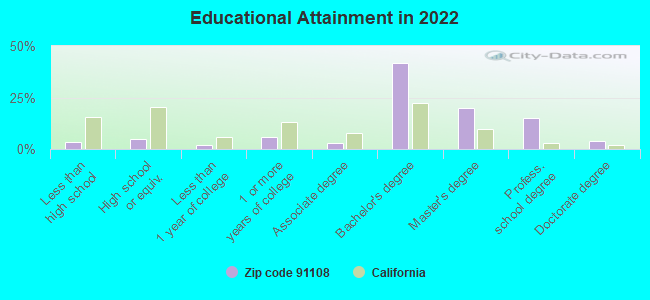
Private vs. public school enrollment:
Students in private schools in grades 1 to 8 (elementary and middle school): 263
Here:
24.2%
California:
10.5%
Students in private schools in grades 9 to 12 (high school): 209
Here:
25.8%
California:
8.5%
Students in private undergraduate colleges: 218
Here:
47.3%
California:
15.9%
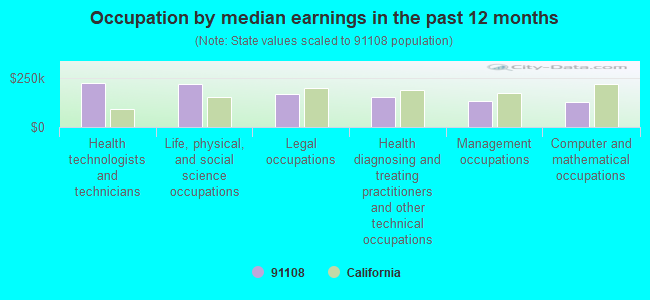
Occupation by median earnings in the past 12 months ($)
224,386Health technologists and technicians
218,502Life, physical, and social science occupations
167,582Legal occupations
150,719Health diagnosing and treating practitioners and other technical occupations
132,194Management occupations
128,782Computer and mathematical occupations
Companies with federal contracts located in this zip code:
SUNSET SOFTWARE TECHNOLOGY (1613 CHELSEA ROAD, SUITE in SAN MARINO, CA; small business) : $24,215 in 4 contractsfrom 2005 to 2006
$12,390 with Navy for ADP Software. Signed on 2005-09-29. Completion date: 2005-10-14.
$7,700, same as above.Signed on 2005-09-19. Completion date: 2005-09-22.
$4,100 with Navy for ADP Software. Taking place in VA. Signed on 2006-05-26. Completion date: 2006-06-02.
$25 with Navy for ADP Software. Signed on 2006-06-15. Completion date: 2006-06-15.
Top industries in this zip code by the number of employees in 2005:
Information: Libraries and Archives (250-499 employees: 1 establishment)
2005 - 2018 National Fire Incident Reporting System (NFIRS) incidents
Based on the data from the years 2005 - 2018 the average number of fires per year is 15. The highest number of reported fire incidents - 36 took place in 2009, and the least - 5 in 2015. The data has a constant trend.
When looking into fire subcategories, the most reports belonged to: Structure Fires (68.1%), and Outside Fires (21.3%).
Fire incident types reported to NFIRS in Zip Code 91108


+$12,800
-$7,562
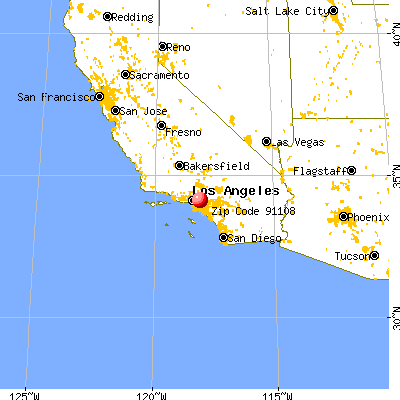
 Nearest zip codes: 91106, 91775, 91801, 91101, 91776, 91107.
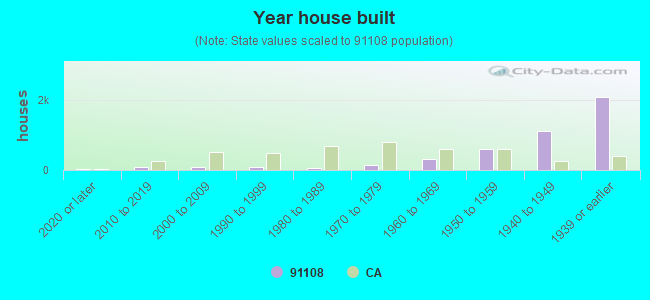


 Based on the data from the years 2005 - 2018 the average number of fires per year is 15. The highest number of reported fire incidents - 36 took place in 2009, and the least - 5 in 2015. The data has a constant trend.
 When looking into fire subcategories, the most reports belonged to: Structure Fires (68.1%), and Outside Fires (21.3%).