Estimated zip code population in 2022: 16,540 Zip code population in 2010: 13,220 Zip code population in 2000: 14,479
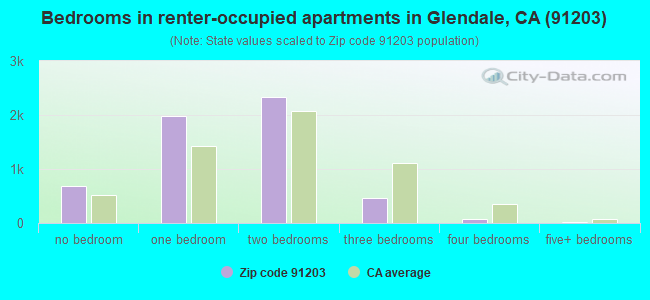
Houses and condos: 7,553 Renter-occupied apartments: 5,550
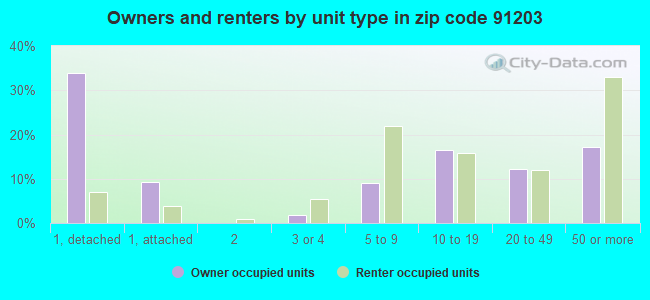
% of renters here:
80%
State:
44%
March 2022 cost of living index in zip code 91203: 137.8 (high, U.S. average is 100)
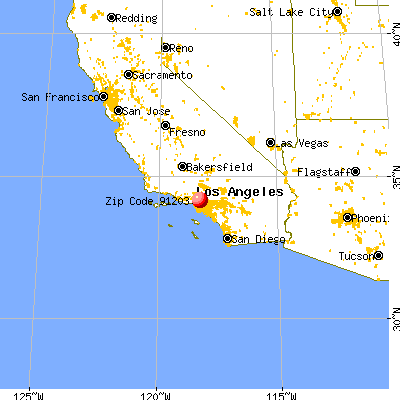
Land area: 0.8 sq. mi. Water area: 0.0 sq. mi.
Population density: 20,207 people per square mile
(very high).
OSM Map
General Map
Google Map
MSN Map
OSM Map
General Map
Google Map
MSN Map
OSM Map
General Map
Google Map
MSN Map
OSM Map
General Map
Google Map
MSN Map
Please wait while loading the map...
Real estate property taxes paid for housing units in 2022:
This zip code:
0.7% ($4,562)
California:
0.7% ($4,831)
Median real estate property taxes paid for housing units with mortgages in 2022: $4,771 (0.7%) Median real estate property taxes paid for housing units with no mortgage in 2022: $3,982 (0.6%)
Estimated median house/condo value in 2022: $700,264
91203:
$700,264
California:
$715,900
Median resident age:
This zip code:
37.4 years
California median age:
37.9 years
Average household size:
This zip code:
2.4 people
California:
2.8 people
Averages for the 2020 tax year for zip code 91203, filed in 2021:
Average Adjusted Gross Income (AGI) in 2020: $65,723 (Individual Income Tax Returns)
Here:
$65,723
State:
$95,910
Salary/wage: $60,500 (reported on 78.5% of returns)
Here:
$60,500
State:
$77,331
(% of AGI for various income ranges: 1204.5% for AGIs below $25k, 3916.6% for AGIs $25k-50k, 8123.2% for AGIs $50k-75k, 12289.8% for AGIs $75k-100k, 22344.5% for AGIs $100k-200k, 102595.0% for AGIs over 200k)
Taxable interest for individuals: $1,950 (reported on 24.9% of returns)
This zip code:
$1,950
California:
$2,294
(% of AGI for various income ranges: 14.8% for AGIs below $25k, 15.1% for AGIs $25k-50k, 34.0% for AGIs $50k-75k, 39.6% for AGIs $75k-100k, 78.0% for AGIs $100k-200k, 4238.3% for AGIs over 200k)
Ordinary dividends: $7,410 (reported on 13.6% of returns)
Here:
$7,410
State:
$10,949
(% of AGI for various income ranges: 19.1% for AGIs below $25k, 7.7% for AGIs $25k-50k, 33.1% for AGIs $50k-75k, 50.0% for AGIs $75k-100k, 95.0% for AGIs $100k-200k, 10945.0% for AGIs over 200k)
Net capital gain/loss in AGI: +$16,732 (reported on 14.9% of returns)
Here:
+$16,732
State:
+$49,306
(% of AGI for various income ranges: 8.8% for AGIs below $25k, 31.5% for AGIs $25k-50k, 98.5% for AGIs $50k-75k, 132.7% for AGIs $75k-100k, 447.3% for AGIs $100k-200k, 25766.7% for AGIs over 200k)
Profit/loss from business: +$11,069 (reported on 32.2% of returns)
Here:
+$11,069
State:
+$15,671
(% of AGI for various income ranges: 319.3% for AGIs below $25k, 427.2% for AGIs $25k-50k, 500.0% for AGIs $50k-75k, 608.4% for AGIs $75k-100k, 1017.9% for AGIs $100k-200k, 8963.3% for AGIs over 200k)
Taxable individual retirement arrangement distribution: $15,041 (reported on 2.8% of returns)
91203:
$15,041
California:
$23,505
(% of AGI for various income ranges: 19.7% for AGIs below $25k, 31.5% for AGIs $25k-50k, 89.7% for AGIs $50k-75k, 99.8% for AGIs $75k-100k, 253.9% for AGIs $100k-200k)
Self-employed (Keogh) retirement plans: $19,833 (reported on 0.4% of returns)
91203:
$19,833
California:
$30,163
(% of AGI for various income ranges: 116.7% for AGIs $75k-100k)
Total itemized deductions: $36,188 (reported on 9.0% of returns)
Here:
$36,188
State:
$39,517
(% of AGI for various income ranges: 62.8% for AGIs below $25k, 178.4% for AGIs $25k-50k, 391.9% for AGIs $50k-75k, 636.9% for AGIs $75k-100k, 1345.9% for AGIs $100k-200k, 15190.0% for AGIs over 200k)
Charity contributions: $8,980 (reported on 7.4% of returns)
Here:
$8,980
State:
$12,598
(% of AGI for various income ranges: 3.9% for AGIs below $25k, 18.8% for AGIs $25k-50k, 54.8% for AGIs $50k-75k, 117.5% for AGIs $75k-100k, 229.6% for AGIs $100k-200k, 4511.7% for AGIs over 200k)
Taxes paid: $8,036 (reported on 9.0% of returns)
91203:
$8,036
State:
$8,807
(% of AGI for various income ranges: 15.6% for AGIs below $25k, 34.5% for AGIs $25k-50k, 92.7% for AGIs $50k-75k, 182.9% for AGIs $75k-100k, 410.0% for AGIs $100k-200k, 1975.0% for AGIs over 200k)
Earned income credit: $1,711 (reported on 15.6% of returns)
Here:
$1,711
State:
$2,074
(% of AGI for various income ranges: 78.9% for AGIs below $25k, 69.3% for AGIs $25k-50k)
Percentage of individuals using paid preparers for their 2020 taxes: 93.6%
Here:
94%
State:
92%
(% for various income ranges: 92.1% for AGIs below $25k, 95.2% for AGIs $25k-50k, 94.2% for AGIs $50k-75k, 92.9% for AGIs $75k-100k, 94.5% for AGIs $100k-200k, 93.1% for AGIs over 200k)
Averages for the 2012 tax year for zip code 91203, filed in 2013:
Average Adjusted Gross Income (AGI) in 2012: $52,894 (Individual Income Tax Returns)
Here:
$52,894
State:
$72,726
Salary/wage: $43,669 (reported on 83.8% of returns)
Here:
$43,669
State:
$59,079
(% of AGI for various income ranges: 75.5% for AGIs below $25k, 84.7% for AGIs $25k-50k, 85.2% for AGIs $50k-75k, 87.6% for AGIs $75k-100k, 82.0% for AGIs $100k-200k, 28.0% for AGIs over 200k)
Taxable interest for individuals: $2,043 (reported on 25.3% of returns)
This zip code:
$2,043
California:
$2,146
(% of AGI for various income ranges: 0.5% for AGIs below $25k, 0.5% for AGIs $25k-50k, 0.4% for AGIs $50k-75k, 0.2% for AGIs $75k-100k, 0.4% for AGIs $100k-200k, 2.6% for AGIs over 200k)
Ordinary dividends: $4,602 (reported on 9.8% of returns)
Here:
$4,602
State:
$9,308
(% of AGI for various income ranges: 0.6% for AGIs below $25k, 0.6% for AGIs $25k-50k, 0.6% for AGIs $50k-75k, 0.6% for AGIs $75k-100k, 0.8% for AGIs $100k-200k, 1.5% for AGIs over 200k)
Net capital gain/loss in AGI: +$9,303 (reported on 9.3% of returns)
Here:
+$9,303
State:
+$30,460
(% of AGI for various income ranges: 0.6% for AGIs $25k-50k, 0.4% for AGIs $50k-75k, 0.2% for AGIs $75k-100k, 0.8% for AGIs $100k-200k, 5.2% for AGIs over 200k)
Profit/loss from business: +$11,226 (reported on 26.1% of returns)
Here:
+$11,226
State:
+$17,064
(% of AGI for various income ranges: 18.2% for AGIs below $25k, 6.8% for AGIs $25k-50k, 4.4% for AGIs $50k-75k, 3.9% for AGIs $75k-100k, 2.5% for AGIs $100k-200k, 3.3% for AGIs over 200k)
Taxable individual retirement arrangement distribution: $12,226 (reported on 3.6% of returns)
91203:
$12,226
California:
$19,557
(% of AGI for various income ranges: 0.9% for AGIs below $25k, 1.2% for AGIs $25k-50k, 1.1% for AGIs $50k-75k, 1.0% for AGIs $75k-100k, 1.2% for AGIs $100k-200k)
Self-employment retirement plans: $14,233 (reported on 0.5% of returns)
91203:
$14,233
California:
$24,530
Total itemized deductions: $32,057 (27% of AGI, reported on 26.9% of returns)
Here:
$32,057
State:
$34,004
Here:
27.4% of AGI
State:
22.7% of AGI
(% of AGI for various income ranges: 10.3% for AGIs below $25k, 11.8% for AGIs $25k-50k, 14.7% for AGIs $50k-75k, 17.8% for AGIs $75k-100k, 18.4% for AGIs $100k-200k, 20.7% for AGIs over 200k)
Charity contributions: $4,829 (reported on 20.7% of returns)
Here:
$4,829
State:
$4,659
(% of AGI for various income ranges: 0.4% for AGIs below $25k, 0.6% for AGIs $25k-50k, 1.4% for AGIs $50k-75k, 1.5% for AGIs $75k-100k, 2.2% for AGIs $100k-200k, 3.6% for AGIs over 200k)
Taxes paid: $10,335 (reported on 26.9% of returns)
91203:
$10,335
State:
$14,448
(% of AGI for various income ranges: 1.3% for AGIs below $25k, 2.3% for AGIs $25k-50k, 3.5% for AGIs $50k-75k, 5.1% for AGIs $75k-100k, 6.7% for AGIs $100k-200k, 9.1% for AGIs over 200k)
Earned income credit: $1,945 (reported on 23.5% of returns)
Here:
$1,945
State:
$2,286
(% of AGI for various income ranges: 6.8% for AGIs below $25k, 1.0% for AGIs $25k-50k)
Percentage of individuals using paid preparers for their 2012 taxes: 73.6%
Here:
74%
State:
64%
(% for various income ranges: 75.4% for AGIs below $25k, 71.6% for AGIs $25k-50k, 70.7% for AGIs $50k-75k, 67.3% for AGIs $75k-100k, 77.8% for AGIs $100k-200k, 91.7% for AGIs over 200k)
Averages for the 2004 tax year for zip code 91203, filed in 2005:
Average Adjusted Gross Income (AGI) in 2004: $41,225 (Individual Income Tax Returns)
Here:
$41,225
State:
$58,600
Salary/wage: $36,974 (reported on 84.8% of returns)
Here:
$36,974
State:
$49,455
(% of AGI for various income ranges: 222.2% for AGIs below $10k, 80.6% for AGIs $10k-25k, 87.3% for AGIs $25k-50k, 87.7% for AGIs $50k-75k, 84.3% for AGIs $75k-100k, 53.6% for AGIs over 100k)
Taxable interest for individuals: $1,252 (reported on 32.0% of returns)
This zip code:
$1,252
California:
$2,365
(% of AGI for various income ranges: 10.4% for AGIs below $10k, 0.9% for AGIs $10k-25k, 0.9% for AGIs $25k-50k, 0.6% for AGIs $50k-75k, 1.2% for AGIs $75k-100k, 0.9% for AGIs over 100k)
Taxable dividends: $2,495 (reported on 11.3% of returns)
Here:
$2,495
State:
$4,746
(% of AGI for various income ranges: 4.2% for AGIs below $10k, 0.6% for AGIs $10k-25k, 0.5% for AGIs $25k-50k, 0.8% for AGIs $50k-75k, 0.7% for AGIs $75k-100k, 0.7% for AGIs over 100k)
Net capital gain/loss: +$11,907 (reported on 11.0% of returns)
Here:
+$11,907
State:
+$23,418
(% of AGI for various income ranges: 4.0% for AGIs below $10k, -0.1% for AGIs $10k-25k, 0.0% for AGIs $25k-50k, 0.6% for AGIs $50k-75k, 2.0% for AGIs $75k-100k, 8.2% for AGIs over 100k)
Profit/loss from business: +$10,830 (reported on 24.4% of returns)
Here:
+$10,830
State:
+$16,826
(% of AGI for various income ranges: 57.0% for AGIs below $10k, 13.6% for AGIs $10k-25k, 6.0% for AGIs $25k-50k, 4.7% for AGIs $50k-75k, 4.4% for AGIs $75k-100k, 4.3% for AGIs over 100k)
IRA payment deduction: $2,933 (reported on 2.2% of returns)
91203:
$2,933
California:
$3,192
(% of AGI for various income ranges: 0.1% for AGIs $10k-25k, 0.2% for AGIs $25k-50k, 0.2% for AGIs $50k-75k, 0.2% for AGIs $75k-100k, 0.1% for AGIs over 100k)
Self-employed pension: $12,179 (reported on 0.5% of returns)
Here:
$12,179
California:
$17,688
Total itemized deductions: $23,805 (27% of AGI, reported on 28.0% of returns)
Here:
$23,805
State:
$28,113
Here:
27.1% of AGI
State:
25.3% of AGI
(% of AGI for various income ranges: 38.2% for AGIs below $10k, 11.1% for AGIs $10k-25k, 14.4% for AGIs $25k-50k, 16.1% for AGIs $50k-75k, 19.5% for AGIs $75k-100k, 17.4% for AGIs over 100k)
Charity contributions deductions: $3,014 (3% of AGI, reported on 22.5% of returns)
Here:
$3,014
State:
$3,923
Here:
3.2% of AGI
State:
3.3% of AGI
(% of AGI for various income ranges: 0.5% for AGIs below $10k, 0.6% for AGIs $10k-25k, 1.4% for AGIs $25k-50k, 1.9% for AGIs $50k-75k, 2.3% for AGIs $75k-100k, 1.9% for AGIs over 100k)
Total tax: $7,217 (reported on 76.1% of returns)
91203:
$7,217
State:
$10,761
(% of AGI for various income ranges: 12.9% for AGIs below $10k, 5.1% for AGIs $10k-25k, 7.4% for AGIs $25k-50k, 9.7% for AGIs $50k-75k, 11.6% for AGIs $75k-100k, 22.8% for AGIs over 100k)
Earned income credit: $1,656 (reported on 22.4% of returns)
Here:
$1,656
State:
$1,763
Percentage of individuals using paid preparers for their 2004 taxes: 72.7%
Here:
73%
State:
66%
(% for various income ranges: 68.4% for AGIs below $10k, 74.8% for AGIs $10k-25k, 72.8% for AGIs $25k-50k, 71.5% for AGIs $50k-75k, 72.3% for AGIs $75k-100k, 82.1% for AGIs over 100k)
Likely homosexual households (counted as self-reported same-sex unmarried-partner households)
Lesbian couples: 0.0% of all households
Gay men: 0.2% of all households
Household received Food Stamps/SNAP in the past 12 months: 1,124 Household did not receive Food Stamps/SNAP in the past 12 months: 5,902
Women who had a birth in the past 12 months: 105 (64 now married, 41 unmarried) Women who did not have a birth in the past 12 months: 4,458 (1,867 now married, 2,586 unmarried)
Housing units in zip code 91203 with a mortgage: 888 (51 second mortgage, 30 both second mortgage and home equity loan) Houses without a mortgage: 28
Median monthly owner costs for units with a mortgage: $2,593 Median monthly owner costs for units without a mortgage: $855
Residents with income below the poverty level in 2022:
This zip code:
18.1%
Whole state:
12.2%
Residents with income below 50% of the poverty level in 2022:
This zip code:
9.2%
Whole state:
6.2%
Median number of rooms in houses and condos:
Here:
4.9
State:
6.0
Median number of rooms in apartments:
Here:
3.9
State:
3.9
Notable locations in this zip code not listed on our city pages
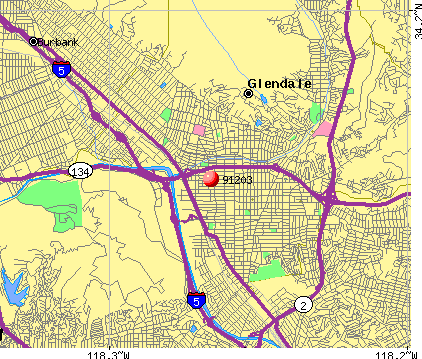
Churches in zip code 91203 include: Free Methodist Church (A), Glendale Community Church of God (B), First Congregational Church (C), First Southern Baptist Church (D), Church of the Brethren (E). Display/hide their locations on the map
In group quarters: 4 (-1 institutionalized population)
Size of family households: 1,702 2-persons, 1,147 3-persons, 961 4-persons, 200 5-persons, 77 6-persons, 94 7-or-more-persons
Size of nonfamily households: 2,203 1-person, 518 2-persons, 94 3-persons
1,676 married couples with children.
568 single-parent households (205 men, 363 women).
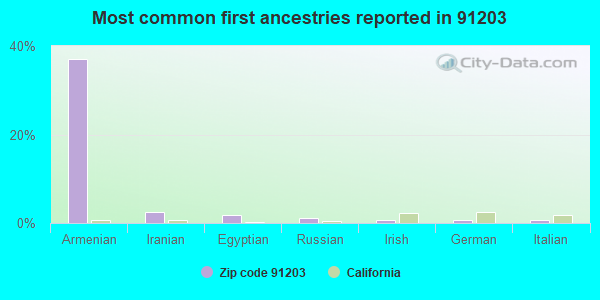
30.9% of residents of 91203 zip code speak English at home.
16.2% of residents speak Spanish at home (62% very well, 15% well, 21% not well, 2% not at all).
42.4% of residents speak other Indo-European language at home (39% very well, 39% well, 17% not well, 5% not at all).
10.7% of residents speak Asian or Pacific Island language at home (56% very well, 39% well, 4% not well, 1% not at all).
1.8% of residents speak other language at home (48% very well, 42% well, 10% not well).
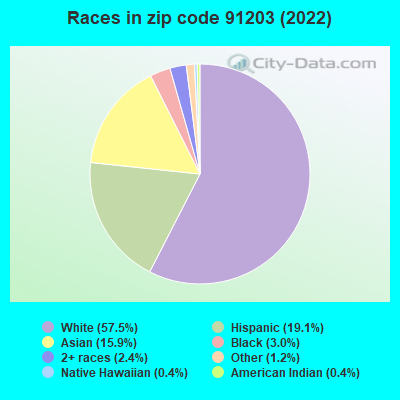
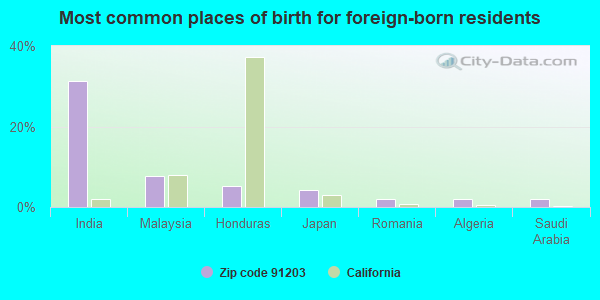
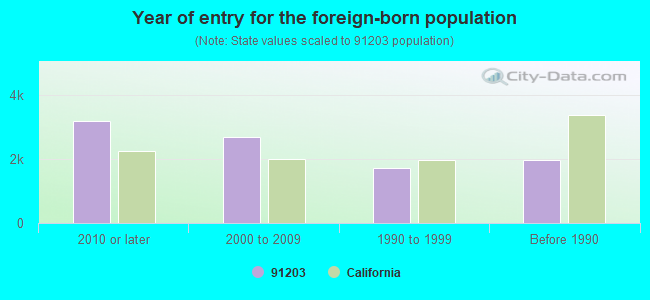
Foreign born population: 9,062 (54.8%) (58.1% of them are naturalized citizens)
Major facilities with environmental interests located in this zip code:
H & M GRAPHIC SERVICES INC (731 W WILSON AVENUE in GLENDALE, CA)
STATE MASTER (California - Hazardous Waste Tracking) - HAZARDOU WASTE PROGRAM Small Quantity Generators, between 100 kg and 1000 kg of hazardous waste/month (Resource Conservation and Recovery Act (tracking hazardous waste)) - notification Business NAICS classification: COMMERCIAL LITHOGRAPHIC PRINTING.
HARRINGTON TOOLS INCORPORATED (5420 WEST SAN FERNANDO ROAD in GLENDALE, CA)
SUPERFUND (Superfund database) (Integrated Compliance Information System) - ICIS-09-2002-0014, FORMAL ENFORCEMENT ACTION Business SIC classification: HAND AND EDGE TOOLS, EXCEPT MACHINE TOOLS AND HANDSAWS; ELECTROPLATING, PLATING, POLISHING, ANODIZING, AND COLORING
GLENDALE ALTERNATOR DBA BUCHAK INC (5404 SAN FERNANDO RD in GLENDALE, CA)
(Resource Conservation and Recovery Act (tracking hazardous waste)) Business NAICS classification: OTHER AUTOMOTIVE MECHANICAL AND ELECTRICAL REPAIR AND MAINTENANCE. Organizations: BUCHAK INC GLENDALE ALT (CONTACT/OWNER)
LARRY BROWN LITHOGRAPHERS INCORPORATED (127 CONCORD ST. in GLENDALE, CA)
CRITERIA AND HAZARDOUS AIR POLLUTANT INVENTORY (Inventory of air pollution sources) Small Quantity Generators, between 100 kg and 1000 kg of hazardous waste/month (Resource Conservation and Recovery Act (tracking hazardous waste)) - notification TRI REPORTER (Tracking of toxic chemicals releasing facilities) Business SIC classification: COMMERCIAL PRINTING, LITHOGRAPHIC Business NAICS classification: COMMERCIAL LITHOGRAPHIC PRINTING. Organizations: LARRY R BROWN (CONTACT/OWNER)
CINETECH CORP (730 SALEM ST in GLENDALE, CA)
(Resource Conservation and Recovery Act (tracking hazardous waste)) Organizations: STANLEY COHEN (CONTACT/OWNER)
HARTRENN INC (743 WEST SALEM ST in GLENDALE, CA)
Small Quantity Generators, between 100 kg and 1000 kg of hazardous waste/month (Resource Conservation and Recovery Act (tracking hazardous waste)) Organizations: ALFONSO HARTING (CONTACT/OWNER)
CHEVRON STATION 9 3848 (201 N CENTRAL AVE in GLENDALE, CA)
Small Quantity Generators, between 100 kg and 1000 kg of hazardous waste/month (Resource Conservation and Recovery Act (tracking hazardous waste)) - notification Organizations: CHEVRON U S A PRODUCTS CO (CONTACT/OWNER)
1/2 HOUR PHOTO EXPRESS (224 W COLORADO BLVD #103 in GLENDALE, CA)
Small Quantity Generators, between 100 kg and 1000 kg of hazardous waste/month (Resource Conservation and Recovery Act (tracking hazardous waste))
FIRST CLASS PRINT AND GRAPH (213 N ORANGE UNIT C AND D in GLENDALE, CA)
Small Quantity Generators, between 100 kg and 1000 kg of hazardous waste/month (Resource Conservation and Recovery Act (tracking hazardous waste)) - notification Organizations: CAMPEN INS (CONTACT/OWNER)
INTERNATIONAL POLYMER CORP (5426 SAN FERNANDO RD in GLENDALE, CA)
Small Quantity Generators, between 100 kg and 1000 kg of hazardous waste/month (Resource Conservation and Recovery Act (tracking hazardous waste)) Business NAICS classification: ALL OTHER MISCELLANEOUS CHEMICAL PRODUCT AND PREPARATION MANUFACTURING.
CHAMP ENTERPRISES INC (760 W CALIFORNIA AVE in GLENDALE, CA)
Small Quantity Generators, between 100 kg and 1000 kg of hazardous waste/month (Resource Conservation and Recovery Act (tracking hazardous waste)) - notification Organizations: JOSE GONZALES (CONTACT/OWNER)
CALIFORNIA ENVIRONMENT AND NAT DEF INC (100 N BRAND BLVD UNIT 322 in GLENDALE, CA)
Small Quantity Generators, between 100 kg and 1000 kg of hazardous waste/month (Resource Conservation and Recovery Act (tracking hazardous waste)) - notification Organizations: OGANES ADJARIAN (CONTACT/OWNER)
CARL J KENNEDY CO, INC (521 COMMERCIAL ST in GLENDALE, CA)
Small Quantity Generators, between 100 kg and 1000 kg of hazardous waste/month (Resource Conservation and Recovery Act (tracking hazardous waste))
Housing units lacking complete plumbing facilities: 0.5% Housing units lacking complete kitchen facilities: 5.0%
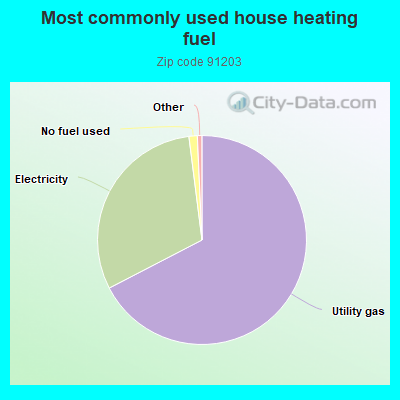
67.4%Utility gas
30.6%Electricity
1.3%No fuel used
Population in 1990: 12,714. Population change in the 1990s: +1,765 (+13.9%).
Place of birth for U.S.-born residents:
This state: 5,215
Northeast: 477
Midwest: 523
South: 533
West: 437
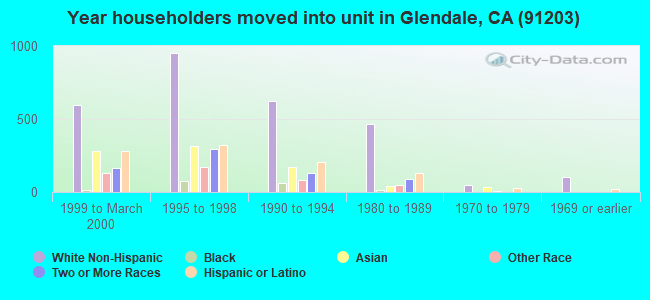
53% of the 91203 zip code residents lived in the same house 5 years ago. Out of people who lived in different houses, 86% lived in this county. Out of people who lived in different counties, 50% lived in California.
87% of the 91203 zip code residents lived in the same house 1 year ago. Out of people who lived in different houses, 63% moved from this county. Out of people who lived in different houses, 4% moved from different county within same state. Out of people who lived in different houses, 21% moved from different state. Out of people who lived in different houses, 12% moved from abroad.
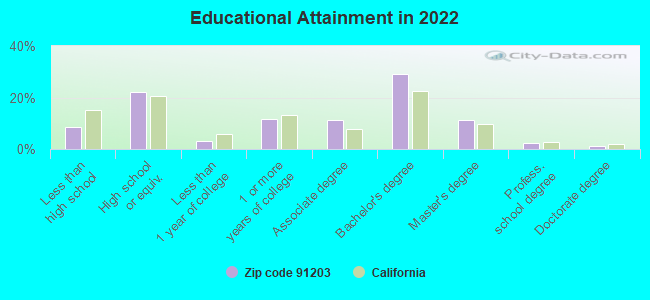
Private vs. public school enrollment:
Students in private schools in grades 1 to 8 (elementary and middle school): 153
Here:
12.5%
California:
10.5%
Students in private schools in grades 9 to 12 (high school): 82
Here:
11.9%
California:
8.5%
Students in private undergraduate colleges: 115
Here:
11.6%
California:
15.9%
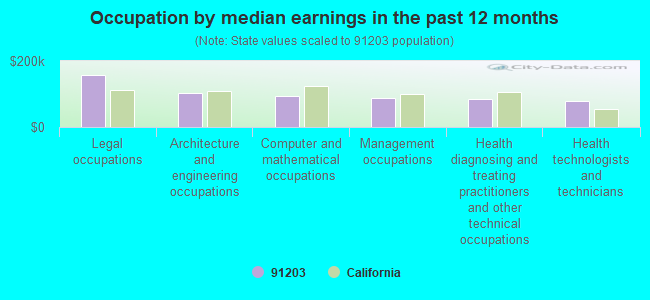
Occupation by median earnings in the past 12 months ($)
157,706Legal occupations
104,129Architecture and engineering occupations
94,859Computer and mathematical occupations
87,166Management occupations
84,374Health diagnosing and treating practitioners and other technical occupations
77,587Health technologists and technicians
Companies with federal contracts located in this zip code:
NESTLE REFRIGERATED FOOD COMPA (800 N BRAND BLVD in GLENDALE, CA) : $6,182,482 in 8 contractsfrom 2004 to 2006
Contracts for Non-Food Items For Resale, Food Items For Resale by Defense Commissary Agency Signed by year:2000: $0; 2001: $0; 2002: $0; 2003: $0; 2004: $1,337,349; 2005: $3,277,966; 2006: $1,567,167.
Biggest contracts:
$1,567,167 with Defense Commissary Agency for Non-Food Items For Resale. Taking place in VA. Signed on 2006-01-01. Completion date: 2006-03-31.
$1,337,284 with Defense Commissary Agency for Food Items For Resale. Signed on 2004-10-01. Completion date: 2005-02-28.
$1,325,431, same as above.Signed on 2005-04-01. Completion date: 2005-08-31.
$1,033,832 with Defense Commissary Agency for Food Items For Resale. Taking place in VA. Signed on 2005-10-01. Completion date: 2005-12-31.
PRC-DESOTO INTERNATIONAL (5430 SAN FERNANDO ROAD in GLENDALE, CA) : $1,572,464 in 661 contractsfrom 1999 to 2006
Contracts for Preservative and Sealing Compounds, Paints, Dopes, Varnishes, and Related Products, Hand Tools, Power Driven by Navy, Federal Supply Service Signed by year:2000: $431,683; 2001: $243,608; 2002: $0; 2003: $158,690; 2004: $185,560; 2005: $90,488; 2006: $185,795.
Biggest contracts:
$174,640 with Navy for Preservative and Sealing Compounds. Signed on 1999-12-23. Completion date: 2000-03-23.
$102,000 with Federal Supply Service for Preservative and Sealing Compounds. Signed on 1999-12-15. Completion date: 2000-03-15.
$99,719 with Navy for Paints, Dopes, Varnishes, and Related Products. Signed on 2006-04-10. Completion date: 2007-06-01.
$96,052 with Navy for Preservative and Sealing Compounds. Signed on 2000-07-03. Completion date: 2000-10-02.
NOTRON MANUFACTURING, INC (801 MILFORD ST in GLENDALE, CA; small business) : $9,748 in 3 contractsin 2005
$4,678 with Navy for Electrical and Electronic Properties Measuring and Testing Instruments. Signed on 2005-01-28. Completion date: 2005-02-24.
$4,110 with Navy for Packing and Gasket Materials. Signed on 2005-03-17. Completion date: 2005-04-06.
$960 with Navy for Electrical and Electronic Properties Measuring and Testing Instruments. Signed on 2005-02-14. Completion date: 2005-02-24.
Top industries in this zip code by the number of employees in 2005:
2005 - 2018 National Fire Incident Reporting System (NFIRS) incidents
Based on the data from the years 2005 - 2018 the average number of fires per year is 11. The highest number of reported fire incidents - 19 took place in 2014, and the least - 0 in 2015. The data has a growing trend.
When looking into fire subcategories, the most incidents belonged to: Structure Fires (38.0%), and Outside Fires (28.7%).
Fire incident types reported to NFIRS in Zip Code 91203


 Nearest zip codes: 91210, 91202, 91204, 91205, 91207, 91201.


 Based on the data from the years 2005 - 2018 the average number of fires per year is 11. The highest number of reported fire incidents - 19 took place in 2014, and the least - 0 in 2015. The data has a growing trend.
 When looking into fire subcategories, the most incidents belonged to: Structure Fires (38.0%), and Outside Fires (28.7%).