Estimated zip code population in 2022: 1,349 Zip code population in 2010: 1,239 Zip code population in 2000: 804
Houses and condos: 621 Renter-occupied apartments: 93
% of renters here:
20%
State:
44%
March 2022 cost of living index in zip code 92282: 73.3 (low, U.S. average is 100)
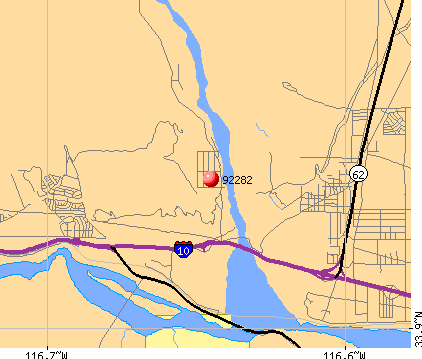
Land area: 71.1 sq. mi. Water area: 2.1 sq. mi.
Population density: 19 people per square mile
(very low).
OSM Map
General Map
Google Map
MSN Map
OSM Map
General Map
Google Map
MSN Map
OSM Map
General Map
Google Map
MSN Map
OSM Map
General Map
Google Map
MSN Map
Please wait while loading the map...
Real estate property taxes paid for housing units in 2022:
This zip code:
0.7% ($2,081)
California:
0.7% ($4,831)
Median real estate property taxes paid for housing units with mortgages in 2022: $2,458 (0.8%) Median real estate property taxes paid for housing units with no mortgage in 2022: $1,321 (0.5%)
Business Search- 14 Million verified businesses
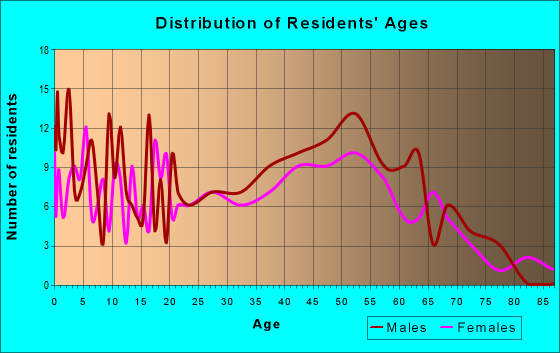
Males: 707
(52.4%)
Females: 641
(47.6%)
For population 25 years and over in 92282:
High school or higher: 86.1%
Bachelor's degree or higher: 20.4%
Graduate or professional degree: 10.2%
Unemployed: 8.2%
Mean travel time to work (commute): 30.6 minutes
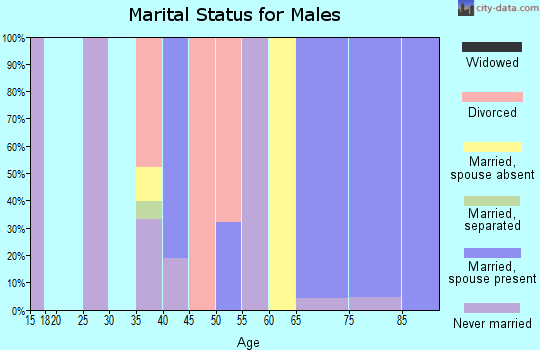
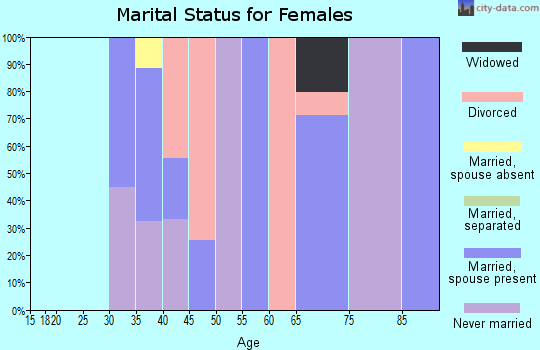
For population 15 years and over in 92282:
Never married: 31.1%
Now married: 50.1%
Separated: 0.0%
Widowed: 3.9%
Divorced: 15.0%
Zip code 92282 compared to state average:
Median house value significantly below state average.
Median age above state average.
Foreign-born population percentage significantly below state average.
Renting percentage below state average.
Length of stay since moving in significantly below state average.
House age below state average.
Percentage of population with a bachelor's degree or higher below state average.
Averages for the 2020 tax year for zip code 92282, filed in 2021:
Average Adjusted Gross Income (AGI) in 2020: $43,343 (Individual Income Tax Returns)
Here:
$43,343
State:
$95,910
Salary/wage: $36,497 (reported on 80.9% of returns)
Here:
$36,497
State:
$77,331
(% of AGI for various income ranges: 1126.9% for AGIs below $25k, 3588.2% for AGIs $25k-50k, 8218.0% for AGIs $50k-75k, 10975.0% for AGIs $75k-100k)
Taxable interest for individuals: $136 (reported on 23.4% of returns)
This zip code:
$136
California:
$2,294
(% of AGI for various income ranges: 5.4% for AGIs below $25k, 3.6% for AGIs $25k-50k, 4.0% for AGIs $50k-75k, 10.0% for AGIs $75k-100k)
Profit/loss from business: +$8,762 (reported on 17.0% of returns)
Here:
+$8,762
State:
+$15,671
(% of AGI for various income ranges: 174.6% for AGIs below $25k, 430.9% for AGIs $25k-50k)
Total itemized deductions: $22,767 (reported on 6.4% of returns)
Here:
$22,767
State:
$39,517
(% of AGI for various income ranges: 1366.0% for AGIs $50k-75k)
Taxes paid: $5,967 (reported on 6.4% of returns)
92282:
$5,967
State:
$8,807
(% of AGI for various income ranges: 358.0% for AGIs $50k-75k)
Earned income credit: $2,108 (reported on 25.5% of returns)
Here:
$2,108
State:
$2,074
(% of AGI for various income ranges: 113.8% for AGIs below $25k, 95.5% for AGIs $25k-50k)
Percentage of individuals using paid preparers for their 2020 taxes: 91.5%
Here:
91%
State:
92%
(% for various income ranges: 94.7% for AGIs below $25k, 92.9% for AGIs $25k-50k, 87.5% for AGIs $50k-75k, 100.0% for AGIs $75k-100k, 66.7% for AGIs $100k-200k)
Averages for the 2012 tax year for zip code 92282, filed in 2013:
Average Adjusted Gross Income (AGI) in 2012: $33,836 (Individual Income Tax Returns)
Here:
$33,836
State:
$72,726
Salary/wage: $32,635 (reported on 78.8% of returns)
Here:
$32,635
State:
$59,079
(% of AGI for various income ranges: 69.3% for AGIs below $25k, 84.6% for AGIs $25k-50k, 82.4% for AGIs $50k-75k, 64.1% for AGIs $75k-100k)
Taxable interest for individuals: $133 (reported on 18.2% of returns)
This zip code:
$133
California:
$2,146
Profit/loss from business: +$6,233 (reported on 18.2% of returns)
Here:
+$6,233
State:
+$17,064
Total itemized deductions: $16,244 (28% of AGI, reported on 27.3% of returns)
Here:
$16,244
State:
$34,004
Here:
27.8% of AGI
State:
22.7% of AGI
(% of AGI for various income ranges: 13.2% for AGIs below $25k, 10.7% for AGIs $25k-50k, 28.2% for AGIs $50k-75k)
Charity contributions: $1,850 (reported on 18.2% of returns)
Here:
$1,850
State:
$4,659
Taxes paid: $3,911 (reported on 27.3% of returns)
92282:
$3,911
State:
$14,448
Earned income credit: $2,073 (reported on 33.3% of returns)
Here:
$2,073
State:
$2,286
(% of AGI for various income ranges: 11.2% for AGIs below $25k)
Percentage of individuals using paid preparers for their 2012 taxes: 63.6%
Here:
64%
State:
64%
(% for various income ranges: 62.5% for AGIs below $25k, 55.6% for AGIs $25k-50k, 120.0% for AGIs $50k-75k)
Averages for the 2004 tax year for zip code 92282, filed in 2005:
Average Adjusted Gross Income (AGI) in 2004: $32,680 (Individual Income Tax Returns)
Here:
$32,680
State:
$58,600
Salary/wage: $33,760 (reported on 83.0% of returns)
Here:
$33,760
State:
$49,455
(% of AGI for various income ranges: 80.2% for AGIs below $10k, 78.3% for AGIs $10k-25k, 85.3% for AGIs $25k-50k, 90.5% for AGIs $50k-75k, 87.8% for AGIs $75k-100k)
Taxable interest for individuals: $339 (reported on 30.1% of returns)
This zip code:
$339
California:
$2,365
Taxable dividends: $267 (reported on 7.3% of returns)
Here:
$267
State:
$4,746
Net capital gain/loss: +$500 (reported on 8.7% of returns)
Here:
+$500
State:
+$23,418
Profit/loss from business: +$3,519 (reported on 13.1% of returns)
Here:
+$3,519
State:
+$16,826
Total itemized deductions: $14,180 (28% of AGI, reported on 29.6% of returns)
Here:
$14,180
State:
$28,113
Here:
27.7% of AGI
State:
25.3% of AGI
(% of AGI for various income ranges: 12.3% for AGIs $10k-25k, 12.9% for AGIs $25k-50k, 19.1% for AGIs $50k-75k, 9.7% for AGIs $75k-100k)
Charity contributions deductions: $1,558 (3% of AGI, reported on 20.9% of returns)
Here:
$1,558
State:
$3,923
Here:
2.9% of AGI
State:
3.3% of AGI
Total tax: $3,560 (reported on 72.8% of returns)
92282:
$3,560
State:
$10,761
(% of AGI for various income ranges: 4.1% for AGIs below $10k, 4.3% for AGIs $10k-25k, 7.1% for AGIs $25k-50k, 7.2% for AGIs $50k-75k, 12.3% for AGIs $75k-100k)
Earned income credit: $1,600 (reported on 21.8% of returns)
Here:
$1,600
State:
$1,763
Percentage of individuals using paid preparers for their 2004 taxes: 65.0%
Here:
65%
State:
66%
(% for various income ranges: 55.6% for AGIs below $10k, 66.7% for AGIs $10k-25k, 60.7% for AGIs $25k-50k, 87.0% for AGIs $50k-75k, 70.6% for AGIs $75k-100k)
Likely homosexual households (counted as self-reported same-sex unmarried-partner households)
Lesbian couples: 3.5% of all households
Gay men: 0.7% of all households
Household received Food Stamps/SNAP in the past 12 months: 152 Household did not receive Food Stamps/SNAP in the past 12 months: 329
Women who had a birth in the past 12 months: 11 (11 now married, 0 unmarried) Women who did not have a birth in the past 12 months: 323 (139 now married, 183 unmarried)
Housing units in zip code 92282 with a mortgage: 223 (32 second mortgage, 27 both second mortgage and home equity loan) Median monthly owner costs for units with a mortgage: $1,689 Median monthly owner costs for units without a mortgage: $557
Residents with income below the poverty level in 2022:
This zip code:
20.0%
Whole state:
12.2%
Residents with income below 50% of the poverty level in 2022:
This zip code:
14.6%
Whole state:
6.2%
Median number of rooms in houses and condos:
Here:
5.6
State:
6.0
Median number of rooms in apartments:
Here:
4.7
State:
3.9
Notable locations in this zip code not listed on our city pages
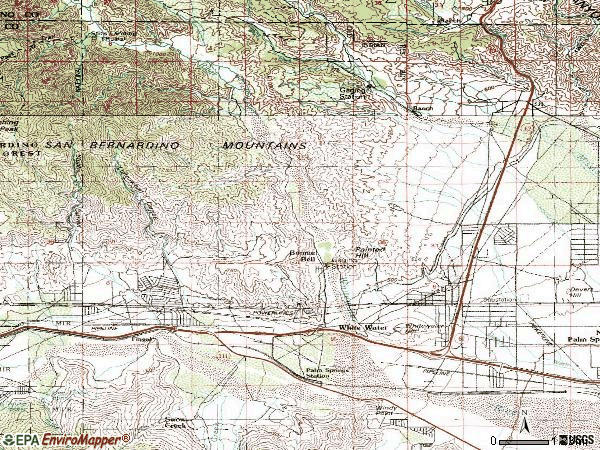
Notable locations in zip code 92282: Palm Springs Station (A), Cox Ranch (B), T Cross K Ranch (C), Whitewater Trout Farm (D), Stills Landing (E). Display/hide their locations on the map
Rivers and creeks: West Fork Mission Creek (A), Super Creek (B), Snow Creek (C), San Gorgonio River (D), One Horse Creek (E). Display/hide their locations on the map
113 married couples with children.
67 single-parent households (67 women).
69.5% of residents of 92282 zip code speak English at home.
25.4% of residents speak Spanish at home (82% very well, 13% well, 3% not well, 2% not at all).
0.5% of residents speak other Indo-European language at home (57% very well, 43% well).
2.1% of residents speak Asian or Pacific Island language at home (52% very well, 48% well).
1.5% of residents speak other language at home (100% very well).
Foreign born population: 141 (10.5%) (34.9% of them are naturalized citizens)
This zip code:
10.5%
Whole state:
26.7%
73%Honduras
10%Japan
5%Sweden
5%United Kingdom, excluding England and Scotland
4%Bulgaria
1%Greece
6%American
3%English
3%Croatian
2%German
2%Swedish
1%Italian
1%Dutch
Year of entry for the foreign-born population
322010 or later
122000 to 2009
631990 to 1999
39Before 1990
Housing units lacking complete kitchen facilities: 2.4%
60.6%Bottled, tank, or LP gas
28.5%Electricity
10.6%Utility gas
0.7%Wood
Population in 1990: 420. Population change in the 1990s: +384 (+91.4%).
Place of birth for U.S.-born residents:
This state: 895
Northeast: 93
Midwest: 91
South: 51
West: 63
47% of the 92282 zip code residents lived in the same house 5 years ago. Out of people who lived in different houses, 60% lived in this county. Out of people who lived in different counties, 50% lived in California.
93% of the 92282 zip code residents lived in the same house 1 year ago. Out of people who lived in different houses, 66% moved from this county. Out of people who lived in different houses, 10% moved from different county within same state. Out of people who lived in different houses, 24% moved from different state.
Private vs. public school enrollment:
Students in private schools in grades 1 to 8 (elementary and middle school):
Here:
0.0%
California:
10.5%
Students in private schools in grades 9 to 12 (high school):
Here:
0.0%
California:
8.5%
Students in private undergraduate colleges: 6
Here:
15.8%
California:
15.9%
Occupation by median earnings in the past 12 months ($)
43,674Office and administrative support occupations
43,282Production occupations
37,867Management occupations
34,915Transportation occupations
29,002Arts, design, entertainment, sports, and media occupations
26,594Food preparation and serving related occupations
Top industries in this zip code by the number of employees in 2005:
Wholesale Trade: Electrical Apparatus and Equipment, Wiring Supplies, and Related Equipment Merchant Wholesalers (250-499 employees: 1 establishment)
Health Care and Social Assistance: Other Residential Care Facilities (100-249: 1)
Health Care and Social Assistance: Home Health Care Services (50-99: 1)
Utilities: Electric Power Distribution (20-49: 1)
Mining: Other Crushed and Broken Stone Mining and Quarrying (20-49: 1)
Other Services (except Public Administration): Pet Care (except Veterinary) Services (10-19: 1)
Construction: Highway, Street, and Bridge Construction (10-19: 1)
Construction: New Single-Family Housing Construction (except Operative Builders) (5-9: 1)
Construction: Site Preparation Contractors (5-9: 1)
People in group quarters in 2000:
92 people in other group homes
Fatal accident statistics in 2014:
Fatal accident count: 4
Vehicles involved in fatal accidents: 6
Fatal accidents caused by drunken drivers: 1
Fatalities: 4
Persons involved in fatal accidents: 16
Pedestrians involved in fatal accidents: 0
Fatal accident statistics in 2013:
Fatal accident count: 1
Vehicles involved in fatal accidents: 1
Fatal accidents caused by drunken drivers: 0
Fatalities: 1
Persons involved in fatal accidents: 1
Pedestrians involved in fatal accidents: 0
Home Mortgage Disclosure Act Aggregated Statistics For Year 2009 (Based on 4 partial tracts)
A) FHA, FSA/RHS & VA Home Purchase Loans
B) Conventional Home Purchase Loans
C) Refinancings
D) Home Improvement Loans
F) Non-occupant Loans on < 5 Family Dwellings (A B C & D)
G) Loans On Manufactured Home Dwelling (A B C & D)
Number
Average Value
Number
Average Value
Number
Average Value
Number
Average Value
Number
Average Value
Number
Average Value
LOANS ORIGINATED
57
$118,299
32
$130,456
31
$188,000
0
$0
23
$153,484
7
$97,387
APPLICATIONS APPROVED, NOT ACCEPTED
11
$118,739
2
$237,525
3
$269,637
0
$0
2
$191,805
2
$57,305
APPLICATIONS DENIED
14
$126,396
11
$106,375
26
$200,361
2
$40,880
8
$224,298
5
$93,230
APPLICATIONS WITHDRAWN
11
$111,691
9
$122,700
21
$222,092
2
$10,135
5
$156,150
4
$47,425
FILES CLOSED FOR INCOMPLETENESS
6
$129,240
2
$129,285
1
$304,980
0
$0
0
$0
0
$0
Aggregated Statistics For Year 2008 (Based on 4 partial tracts)
A) FHA, FSA/RHS & VA Home Purchase Loans
B) Conventional Home Purchase Loans
C) Refinancings
D) Home Improvement Loans
F) Non-occupant Loans on < 5 Family Dwellings (A B C & D)
G) Loans On Manufactured Home Dwelling (A B C & D)
Number
Average Value
Number
Average Value
Number
Average Value
Number
Average Value
Number
Average Value
Number
Average Value
LOANS ORIGINATED
57
$185,666
65
$152,646
32
$215,581
3
$36,583
34
$178,065
7
$120,234
APPLICATIONS APPROVED, NOT ACCEPTED
2
$175,365
13
$174,470
16
$143,826
2
$41,890
9
$180,946
10
$94,629
APPLICATIONS DENIED
17
$182,098
41
$208,328
59
$200,517
7
$66,987
28
$197,296
8
$112,095
APPLICATIONS WITHDRAWN
9
$184,517
24
$138,309
16
$186,276
0
$0
14
$132,875
2
$105,215
FILES CLOSED FOR INCOMPLETENESS
3
$185,447
2
$248,490
9
$179,052
1
$77,750
5
$168,360
1
$53,900
Aggregated Statistics For Year 2007 (Based on 4 partial tracts)
A) FHA, FSA/RHS & VA Home Purchase Loans
B) Conventional Home Purchase Loans
C) Refinancings
D) Home Improvement Loans
F) Non-occupant Loans on < 5 Family Dwellings (A B C & D)
G) Loans On Manufactured Home Dwelling (A B C & D)
Number
Average Value
Number
Average Value
Number
Average Value
Number
Average Value
Number
Average Value
Number
Average Value
LOANS ORIGINATED
34
$266,915
171
$222,865
92
$244,144
32
$127,188
75
$250,415
35
$129,960
APPLICATIONS APPROVED, NOT ACCEPTED
1
$253,680
42
$228,265
32
$175,418
3
$116,933
17
$201,940
11
$127,711
APPLICATIONS DENIED
6
$274,050
119
$235,928
150
$239,609
21
$131,227
60
$288,557
33
$119,257
APPLICATIONS WITHDRAWN
3
$305,107
69
$194,855
43
$251,867
4
$210,478
33
$218,411
4
$135,535
FILES CLOSED FOR INCOMPLETENESS
0
$0
7
$256,674
9
$165,580
1
$95,500
3
$170,907
0
$0
Aggregated Statistics For Year 2006 (Based on 4 partial tracts)
A) FHA, FSA/RHS & VA Home Purchase Loans
B) Conventional Home Purchase Loans
C) Refinancings
D) Home Improvement Loans
F) Non-occupant Loans on < 5 Family Dwellings (A B C & D)
G) Loans On Manufactured Home Dwelling (A B C & D)
Number
Average Value
Number
Average Value
Number
Average Value
Number
Average Value
Number
Average Value
Number
Average Value
LOANS ORIGINATED
19
$179,114
267
$196,926
160
$228,030
30
$252,591
97
$252,301
70
$118,101
APPLICATIONS APPROVED, NOT ACCEPTED
1
$260,190
52
$179,704
43
$227,027
7
$169,634
16
$258,904
10
$111,272
APPLICATIONS DENIED
5
$251,272
163
$186,902
133
$231,005
31
$124,204
48
$209,668
39
$103,441
APPLICATIONS WITHDRAWN
2
$163,785
73
$194,621
79
$220,388
15
$103,604
17
$217,807
13
$144,408
FILES CLOSED FOR INCOMPLETENESS
1
$252,750
14
$173,214
18
$290,427
3
$47,307
3
$283,270
5
$161,466
Aggregated Statistics For Year 2005 (Based on 4 partial tracts)
A) FHA, FSA/RHS & VA Home Purchase Loans
B) Conventional Home Purchase Loans
C) Refinancings
D) Home Improvement Loans
F) Non-occupant Loans on < 5 Family Dwellings (A B C & D)
G) Loans On Manufactured Home Dwelling (A B C & D)
Number
Average Value
Number
Average Value
Number
Average Value
Number
Average Value
Number
Average Value
Number
Average Value
LOANS ORIGINATED
8
$184,385
354
$205,529
146
$198,911
28
$153,031
128
$237,715
32
$137,729
APPLICATIONS APPROVED, NOT ACCEPTED
0
$0
41
$202,085
33
$194,620
3
$55,113
15
$213,517
8
$137,439
APPLICATIONS DENIED
5
$227,016
175
$195,275
76
$176,133
17
$105,661
51
$228,170
31
$144,947
APPLICATIONS WITHDRAWN
0
$0
71
$186,485
50
$182,752
5
$127,408
20
$239,074
8
$118,431
FILES CLOSED FOR INCOMPLETENESS
0
$0
16
$192,619
19
$165,996
2
$39,895
3
$281,027
3
$82,583
Aggregated Statistics For Year 2004 (Based on 4 partial tracts)
A) FHA, FSA/RHS & VA Home Purchase Loans
B) Conventional Home Purchase Loans
C) Refinancings
D) Home Improvement Loans
E) Loans on Dwellings For 5+ Families
F) Non-occupant Loans on < 5 Family Dwellings (A B C & D)
G) Loans On Manufactured Home Dwelling (A B C & D)
Number
Average Value
Number
Average Value
Number
Average Value
Number
Average Value
Number
Average Value
Number
Average Value
Number
Average Value
LOANS ORIGINATED
15
$107,807
114
$149,858
106
$167,543
12
$127,112
1
$1,421,690
47
$164,648
40
$78,262
APPLICATIONS APPROVED, NOT ACCEPTED
1
$126,470
24
$143,869
40
$127,371
3
$63,717
0
$0
10
$135,443
11
$92,629
APPLICATIONS DENIED
0
$0
47
$190,559
74
$150,390
8
$82,862
0
$0
19
$159,142
12
$112,546
APPLICATIONS WITHDRAWN
3
$92,603
22
$208,890
54
$120,180
7
$123,224
1
$1,385,420
7
$147,439
7
$71,743
FILES CLOSED FOR INCOMPLETENESS
0
$0
4
$121,530
15
$120,903
0
$0
0
$0
4
$110,230
5
$92,050
Aggregated Statistics For Year 2003 (Based on 4 partial tracts)
A) FHA, FSA/RHS & VA Home Purchase Loans
B) Conventional Home Purchase Loans
C) Refinancings
D) Home Improvement Loans
F) Non-occupant Loans on < 5 Family Dwellings (A B C & D)
Number
Average Value
Number
Average Value
Number
Average Value
Number
Average Value
Number
Average Value
LOANS ORIGINATED
8
$86,360
78
$140,922
121
$140,648
2
$24,525
36
$155,660
APPLICATIONS APPROVED, NOT ACCEPTED
2
$168,965
16
$97,018
33
$124,923
2
$52,695
10
$136,763
APPLICATIONS DENIED
2
$137,915
44
$93,175
100
$103,172
6
$40,997
24
$96,039
APPLICATIONS WITHDRAWN
2
$161,190
19
$153,034
48
$124,122
1
$24,610
16
$121,771
FILES CLOSED FOR INCOMPLETENESS
2
$141,580
2
$91,045
9
$181,508
1
$30,330
2
$80,225
Aggregated Statistics For Year 1999 (Based on 1 partial tract)
A) FHA, FSA/RHS & VA Home Purchase Loans
B) Conventional Home Purchase Loans
C) Refinancings
D) Home Improvement Loans
E) Loans on Dwellings For 5+ Families
F) Non-occupant Loans on < 5 Family Dwellings (A B C & D)
Detailed PMIC statistics for the following Tracts:0445.03
, 0446.01
2006 - 2018 National Fire Incident Reporting System (NFIRS) incidents
Based on the data from the years 2006 - 2018 the average number of fires per year is 14. The highest number of fire incidents - 30 took place in 2007, and the least - 3 in 2006. The data has a growing trend.
When looking into fire subcategories, the most reports belonged to: Outside Fires (62.0%), and Mobile Property/Vehicle Fires (29.4%).
Fire incident types reported to NFIRS in Zip Code 92282


 Nearest zip codes: 92230, 92256, 92258, 92220, 92240, 92262.


 Based on the data from the years 2006 - 2018 the average number of fires per year is 14. The highest number of fire incidents - 30 took place in 2007, and the least - 3 in 2006. The data has a growing trend.
 When looking into fire subcategories, the most reports belonged to: Outside Fires (62.0%), and Mobile Property/Vehicle Fires (29.4%).