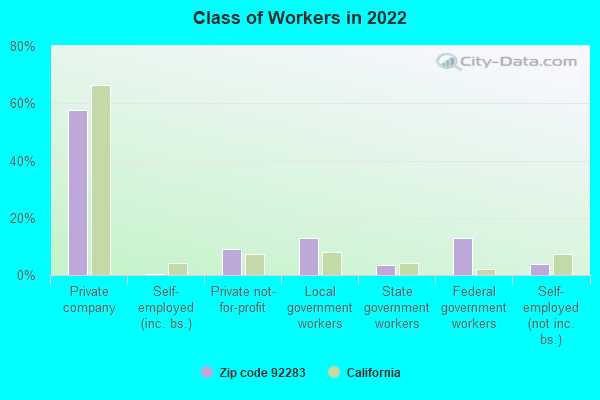
Averages for the 2020 tax year for zip code 92283, filed in 2021:
Average Adjusted Gross Income (AGI) in 2020: $32,730 (Individual Income Tax Returns)
Here:
$32,730
State:
$95,910
Salary/wage: $27,808 (reported on 83.6% of returns)
Here:
$27,808
State:
$77,331
(% of AGI for various income ranges: 1142.2% for AGIs below $25k, 3319.4% for AGIs $25k-50k, 6236.7% for AGIs $50k-75k, 7220.0% for AGIs $75k-100k)
Taxable interest for individuals: $118 (reported on 10.0% of returns)
This zip code:
$118
California:
$2,294
(% of AGI for various income ranges: 0.3% for AGIs below $25k, 2.3% for AGIs $25k-50k, 5.6% for AGIs $50k-75k)
Profit/loss from business: +$1,667 (reported on 8.2% of returns)
Here:
+$1,667
State:
+$15,671
(% of AGI for various income ranges: 46.7% for AGIs below $25k)
Earned income credit: $2,748 (reported on 38.2% of returns)
Here:
$2,748
State:
$2,074
(% of AGI for various income ranges: 190.6% for AGIs below $25k, 151.0% for AGIs $25k-50k)
Percentage of individuals using paid preparers for their 2020 taxes: 89.1%
Here:
89%
State:
92%
(% for various income ranges: 89.8% for AGIs below $25k, 90.0% for AGIs $25k-50k, 92.3% for AGIs $50k-75k, 80.0% for AGIs $75k-100k, 66.7% for AGIs $100k-200k)
Averages for the 2012 tax year for zip code 92283, filed in 2013:
Average Adjusted Gross Income (AGI) in 2012: $27,922 (Individual Income Tax Returns)
Here:
$27,922
State:
$72,726
Salary/wage: $22,916 (reported on 88.5% of returns)
Here:
$22,916
State:
$59,079
(% of AGI for various income ranges: 78.9% for AGIs below $25k, 72.5% for AGIs $25k-50k, 72.2% for AGIs $50k-75k, 63.0% for AGIs $75k-100k)
Taxable interest for individuals: $560 (reported on 9.6% of returns)
This zip code:
$560
California:
$2,146
(% of AGI for various income ranges: 0.2% for AGIs $25k-50k, 0.7% for AGIs $75k-100k)
Ordinary dividends: $400 (reported on 2.9% of returns)
Here:
$400
State:
$9,308
Profit/loss from business: +$6,417 (reported on 5.8% of returns)
Here:
+$6,417
State:
+$17,064
Total itemized deductions: $19,333 (29% of AGI, reported on 5.8% of returns)
Here:
$19,333
State:
$34,004
Here:
28.9% of AGI
State:
22.7% of AGI
Charity contributions: $2,600 (reported on 3.8% of returns)
Here:
$2,600
State:
$4,659
Taxes paid: $4,633 (reported on 5.8% of returns)
92283:
$4,633
State:
$14,448
Earned income credit: $2,829 (reported on 46.2% of returns)
Here:
$2,829
State:
$2,286
(% of AGI for various income ranges: 12.9% for AGIs below $25k, 2.5% for AGIs $25k-50k)
Percentage of individuals using paid preparers for their 2012 taxes: 68.3%
Here:
68%
State:
64%
(% for various income ranges: 65.6% for AGIs below $25k, 73.3% for AGIs $25k-50k, 62.5% for AGIs $50k-75k, 80.0% for AGIs $75k-100k)
Averages for the 2004 tax year for zip code 92283, filed in 2005:
Average Adjusted Gross Income (AGI) in 2004: $24,138 (Individual Income Tax Returns)
Here:
$24,138
State:
$58,600
Salary/wage: $20,684 (reported on 91.5% of returns)
Here:
$20,684
State:
$49,455
(% of AGI for various income ranges: 74.8% for AGIs below $10k, 83.5% for AGIs $10k-25k, 81.9% for AGIs $25k-50k, 81.8% for AGIs $50k-75k, 82.9% for AGIs $75k-100k, 33.9% for AGIs over 100k)
Taxable interest for individuals: $818 (reported on 13.5% of returns)
This zip code:
$818
California:
$2,365
(% of AGI for various income ranges: 0.6% for AGIs below $10k, 0.2% for AGIs $10k-25k, 0.4% for AGIs $25k-50k, 0.9% for AGIs $50k-75k, 1.4% for AGIs $75k-100k)
Taxable dividends: $722 (reported on 3.3% of returns)
Here:
$722
State:
$4,746
Profit/loss from business: +$4,771 (reported on 3.2% of returns)
Here:
+$4,771
State:
+$16,826
IRA payment deduction: $2,000 (reported on 1.1% of returns)
92283:
$2,000
California:
$3,192
Total itemized deductions: $15,420 (25% of AGI, reported on 4.6% of returns)
Here:
$15,420
State:
$28,113
Here:
25.3% of AGI
State:
25.3% of AGI
Charity contributions deductions: $1,727 (3% of AGI, reported on 4.0% of returns)
Here:
$1,727
State:
$3,923
Here:
2.9% of AGI
State:
3.3% of AGI
Total tax: $2,694 (reported on 46.6% of returns)
92283:
$2,694
State:
$10,761
(% of AGI for various income ranges: 0.8% for AGIs below $10k, 1.8% for AGIs $10k-25k, 4.6% for AGIs $25k-50k, 7.8% for AGIs $50k-75k, 11.5% for AGIs $75k-100k, 15.0% for AGIs over 100k)
Earned income credit: $2,089 (reported on 48.4% of returns)
Here:
$2,089
State:
$1,763
Percentage of individuals using paid preparers for their 2004 taxes: 68.3%
Here:
68%
State:
66%
(% for various income ranges: 61.7% for AGIs below $10k, 67.5% for AGIs $10k-25k, 72.0% for AGIs $25k-50k, 80.0% for AGIs $50k-75k, 58.8% for AGIs $75k-100k, 92.3% for AGIs over 100k)
Household received Food Stamps/SNAP in the past 12 months: 340 Household did not receive Food Stamps/SNAP in the past 12 months: 321
Women who had a birth in the past 12 months: 44 (5 now married, 39 unmarried) Women who did not have a birth in the past 12 months: 437 (51 now married, 391 unmarried)
Housing units in zip code 92283 with a mortgage: 5 Residents with income below the poverty level in 2022:
This zip code:
42.1%
Whole state:
12.2%
Residents with income below 50% of the poverty level in 2022:
This zip code:
15.4%
Whole state:
6.2%
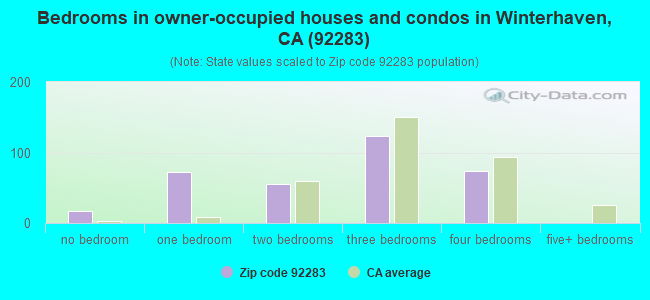
Median number of rooms in houses and condos:
Here:
4.9
State:
6.0
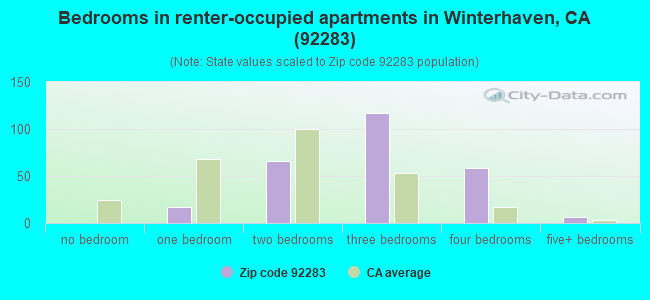
Median number of rooms in apartments:
Here:
5.1
State:
3.9
Notable locations in this zip code not listed on our city pages
Notable locations in zip code 92283: Hedges (A), Draper Ranch (B), Old Araz Stage Depot (C), Picacho Mill Ruins (D), Potholes (E), Taylor Lake Overlook (F), Taylor Lake Boat-in Camp (G), Paddlewheeler Boat-in Camp (H), Gilmores Camp (I), Carrizo Wash Boat-in Camp (J), Walters Camp (K), Four-S Ranch (L), Gold Rock Ranch (M), Gordons Well (N), Grays Well (O), Yuma Test Station (P), Pilot Knob Substation (Q), Pilot Knob Hydro-electric Plant (R), Pilot Knob Check and Wasteway (S), Araz (T). Display/hide their locations on the map
Lakes and reservoirs: Haughtelin Lake (A), Bard Lake (B), Red Rock Lake (C), Stewarts Lake (D), Taylor Lake (E), Draper Lake (F), Squaw Lake (G), Ferguson Lake (H). Display/hide their locations on the map
Streams, rivers, and creeks: Gavilan Wash (A), Gatuna Wash (B), Ferguson Wash (C), Draper Wash (D), Carrizo Wash (E), Burro Wash (F), Bee Wash (G), Arrastia Wash (H), Araz Wash (I). Display/hide their locations on the map
In group quarters: 26 (-1 institutionalized population)
Size of family households: 118 2-persons, 78 3-persons, 58 4-persons, 40 5-persons, 33 6-persons, 41 7-or-more-persons
Size of nonfamily households: 198 1-person, 31 2-persons, 6 4-persons
31 married couples with children.
411 single-parent households (104 men, 307 women).
84.6% of residents of 92283 zip code speak English at home.
7.3% of residents speak Spanish at home (49% very well, 14% well, 37% not well).
0.2% of residents speak Asian or Pacific Island language at home (100% well).
7.1% of residents speak other language at home (83% very well, 17% well).
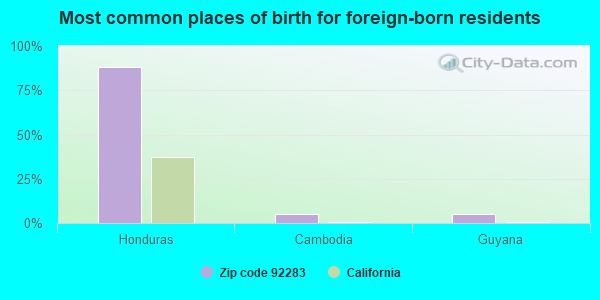
Foreign born population: 61 (3.1%) (82.2% of them are naturalized citizens)
This zip code:
3.1%
Whole state:
26.7%
88%Honduras
5%Cambodia
5%Guyana
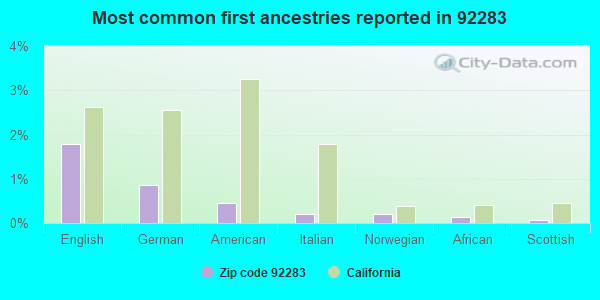
2%English
1%German
0%American
0%Italian
0%Norwegian
0%African
0%Scottish
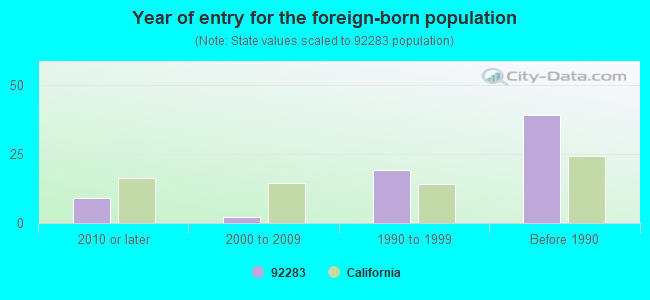
Year of entry for the foreign-born population
92010 or later
22000 to 2009
191990 to 1999
39Before 1990
Facilities with environmental interests located in this zip code:
LAGUNA FIELD OFFICE US GOV (RT 1 2400 IMPERIAL RD in WINTERHAVEN, CA) . Federal Facility
STATE MASTER (California - Hazardous Waste Tracking) - HAZARDOU WASTE PROGRAM HAZARDOUS WASTE BIENNIAL REPORTER (Resource Conservation and Recovery Act (tracking hazardous waste)) Small Quantity Generators, between 100 kg and 1000 kg of hazardous waste/month (Resource Conservation and Recovery Act (tracking hazardous waste)) - notification Organizations: US GOVERNMENT (CONTACT/OWNER)
Alternative names: LAGUNA FIELD OFFICE UNITED STATES BUREAU OF RECLAMA
AMERICAN GIRL MINING JOINT VENTURE (6 MILES OFF INTERSTATE #8 in WINTERHAVEN, CA)
STATE MASTER (California - Hazardous Waste Tracking) - HAZARDOU WASTE PROGRAM CRITERIA AND HAZARDOUS AIR POLLUTANT INVENTORY (Inventory of air pollution sources) Small Quantity Generators, between 100 kg and 1000 kg of hazardous waste/month (Resource Conservation and Recovery Act (tracking hazardous waste)) - notification Business SIC classification: GOLD ORES; PRIMARY METAL PRODUCTS Business NAICS classification: GOLD ORE MINING. Organizations: MORRISON KNUDSEN CORP (CONTACT/OWNER)
Alternative names: AMERICAN GIRL MINE
MANES (BILL M.) HIGH (CONT.) (676 BASELINE ROAD in WINTERHAVEN, CA)
(National Center for Education Statistics) - STATE ID-1330018 Organizations: SAN PASQUAL VALLEY UNIFIED (SCHOOL DISTRICT)
GLAMIS PICACHO MINE (3481 PICACHO RD. in WINTERHAVEN, CA)
TRI REPORTER (Tracking of toxic chemicals releasing facilities) Business SIC classification: GOLD ORES Alternative names: CHEMGOLD INC.
CHEMGOLD, INC (PICACHO PARK in WINTERHAVEN, CA)
CRITERIA AND HAZARDOUS AIR POLLUTANT INVENTORY (Inventory of air pollution sources) Business SIC classification: GOLD ORES Business NAICS classification: GOLD ORE MINING.
Housing units lacking complete plumbing facilities: 2.9% Housing units lacking complete kitchen facilities: 8.5%
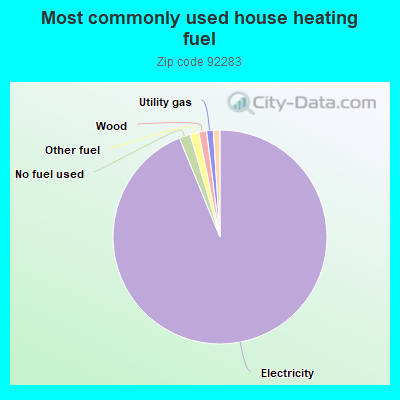
94.0%Electricity
1.7%No fuel used
1.3%Other fuel
1.2%Wood
1.0%Utility gas
1.0%Bottled, tank, or LP gas
Population in 1990: 3,867.
Place of birth for U.S.-born residents:
This state: 534
Northeast: 27
Midwest: 77
South: 39
West: 1,145
63% of the 92283 zip code residents lived in the same house 5 years ago. Out of people who lived in different houses, 46% lived in this county. Out of people who lived in different counties, 50% lived in California.
92% of the 92283 zip code residents lived in the same house 1 year ago. Out of people who lived in different houses, 38% moved from this county. Out of people who lived in different houses, 5% moved from different county within same state. Out of people who lived in different houses, 59% moved from different state.
Private vs. public school enrollment:
Students in private schools in grades 1 to 8 (elementary and middle school):
Here:
0.0%
California:
10.5%
Students in private schools in grades 9 to 12 (high school): 9
Here:
6.4%
California:
8.5%
Students in private undergraduate colleges: 9
Here:
18.7%
California:
15.9%
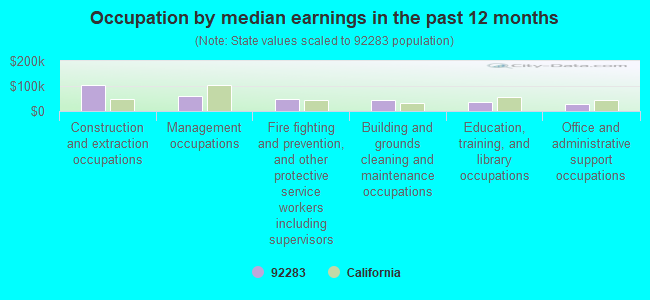
Occupation by median earnings in the past 12 months ($)
104,277Construction and extraction occupations
61,723Management occupations
48,528Fire fighting and prevention, and other protective service workers including supervisors
42,874Building and grounds cleaning and maintenance occupations
37,635Education, training, and library occupations
29,681Office and administrative support occupations
Companies with federal contracts located in this zip code:
PALASZYNSKI, LUCINDA E (2225 FERGUSON RD in WINTERHAVEN, CA; small business) : $7,915 in 8 contractsfrom 2004 to 2006
Contracts for Chaplain Services by Army Signed by year:2000: $0; 2001: $0; 2002: $0; 2003: $0; 2004: $5,520; 2005: $775; 2006: $1,620.
Biggest contracts:
$2,760 with Army for Chaplain Services. Taking place in AZ. Signed on 2004-11-02. Completion date: 2005-09-30.
$2,760, same as above.Signed on 2004-10-01. Completion date: 2005-09-30.
$1,285, same as above.Signed on 2006-04-10. Completion date: 2006-09-30.
$700, same as above.Signed on 2006-01-23. Completion date: 2006-09-30.
CACHORA, LOREY (1852 W MIGUEL RD in WINTERHAVEN, CA; small business) : $2,740 in 2 contractsin 2004
$3,600 with Army for Archeological/Paleontological Studies. Taking place in AZ. Signed on 2004-03-02. Completion date: 2004-03-17.
-$860, same as above.Signed on 2004-09-13. Completion date: 2004-03-17.
Top industries in this zip code by the number of employees in 2005:
Health Care and Social Assistance: General Medical and Surgical Hospitals (50-99 employees: 1 establishment)
Mining: Support Activities for Metal Mining (20-49: 1)
Accommodation and Food Services: RV (Recreational Vehicle) Parks and Campgrounds (10-19: 1, 1-4: 1)
Accommodation and Food Services: Snack and Nonalcoholic Beverage Bars (5-9: 1, 1-4: 1)
Health Care and Social Assistance: All Other Outpatient Care Centers (5-9: 1)
Construction: New Single-Family Housing Construction (except Operative Builders) (1-4: 1)
Health Care and Social Assistance: Offices of Chiropractors (1-4: 1)
People in group quarters in 2010:
49 people in other noninstitutional facilities
Fatal accident statistics in 2013:
Fatal accident count: 3
Vehicles involved in fatal accidents: 4
Fatal accidents caused by drunken drivers: 1
Fatalities: 3
Persons involved in fatal accidents: 5
Pedestrians involved in fatal accidents: 0
Fatal accident statistics in 2012:
Fatal accident count: 2
Vehicles involved in fatal accidents: 2
Fatal accidents caused by drunken drivers: 0
Fatalities: 2
Persons involved in fatal accidents: 4
Pedestrians involved in fatal accidents: 0
Home Mortgage Disclosure Act Aggregated Statistics For Year 2009 (Based on 2 full tracts)
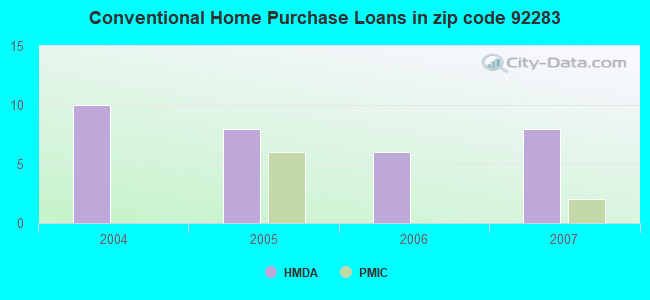
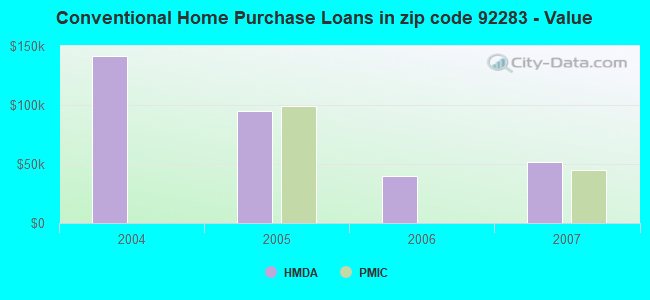
B) Conventional Home Purchase Loans
C) Refinancings
D) Home Improvement Loans
F) Non-occupant Loans on < 5 Family Dwellings (A B C & D)
G) Loans On Manufactured Home Dwelling (A B C & D)
Number
Average Value
Number
Average Value
Number
Average Value
Number
Average Value
Number
Average Value
LOANS ORIGINATED
0
$0
0
$0
0
$0
0
$0
0
$0
APPLICATIONS APPROVED, NOT ACCEPTED
0
$0
0
$0
0
$0
0
$0
0
$0
APPLICATIONS DENIED
2
$59,900
4
$37,438
14
$35,654
4
$39,932
0
$0
APPLICATIONS WITHDRAWN
0
$0
2
$149,745
2
$85,855
0
$0
2
$149,745
FILES CLOSED FOR INCOMPLETENESS
0
$0
2
$129,780
0
$0
0
$0
2
$129,780
Aggregated Statistics For Year 2008 (Based on 2 full tracts)
A) FHA, FSA/RHS & VA Home Purchase Loans
B) Conventional Home Purchase Loans
C) Refinancings
D) Home Improvement Loans
G) Loans On Manufactured Home Dwelling (A B C & D)
Number
Average Value
Number
Average Value
Number
Average Value
Number
Average Value
Number
Average Value
LOANS ORIGINATED
2
$130,775
0
$0
0
$0
0
$0
2
$130,775
APPLICATIONS APPROVED, NOT ACCEPTED
0
$0
2
$147,750
0
$0
0
$0
2
$147,750
APPLICATIONS DENIED
0
$0
2
$123,790
14
$137,766
4
$29,950
2
$24,955
APPLICATIONS WITHDRAWN
2
$31,945
0
$0
4
$205,650
0
$0
0
$0
FILES CLOSED FOR INCOMPLETENESS
0
$0
0
$0
0
$0
2
$86,850
0
$0
Aggregated Statistics For Year 2007 (Based on 2 full tracts)
A) FHA, FSA/RHS & VA Home Purchase Loans
B) Conventional Home Purchase Loans
C) Refinancings
D) Home Improvement Loans
F) Non-occupant Loans on < 5 Family Dwellings (A B C & D)
G) Loans On Manufactured Home Dwelling (A B C & D)
Number
Average Value
Number
Average Value
Number
Average Value
Number
Average Value
Number
Average Value
Number
Average Value
LOANS ORIGINATED
2
$112,810
8
$51,662
12
$140,428
2
$61,895
2
$44,925
4
$116,800
APPLICATIONS APPROVED, NOT ACCEPTED
2
$73,875
0
$0
2
$179,695
0
$0
0
$0
0
$0
APPLICATIONS DENIED
2
$95,835
0
$0
22
$133,046
8
$66,636
0
$0
6
$100,828
APPLICATIONS WITHDRAWN
0
$0
4
$195,168
10
$124,588
2
$49,915
6
$120,462
0
$0
FILES CLOSED FOR INCOMPLETENESS
0
$0
0
$0
6
$128,115
0
$0
2
$174,700
2
$134,770
Aggregated Statistics For Year 2006 (Based on 2 full tracts)
B) Conventional Home Purchase Loans
C) Refinancings
D) Home Improvement Loans
F) Non-occupant Loans on < 5 Family Dwellings (A B C & D)
G) Loans On Manufactured Home Dwelling (A B C & D)
Number
Average Value
Number
Average Value
Number
Average Value
Number
Average Value
Number
Average Value
LOANS ORIGINATED
6
$39,600
8
$104,072
6
$53,575
0
$0
0
$0
APPLICATIONS APPROVED, NOT ACCEPTED
2
$49,915
0
$0
0
$0
0
$0
0
$0
APPLICATIONS DENIED
30
$93,108
28
$115,446
12
$51,080
8
$93,591
20
$109,713
APPLICATIONS WITHDRAWN
0
$0
18
$101,716
0
$0
0
$0
0
$0
FILES CLOSED FOR INCOMPLETENESS
0
$0
2
$74,875
0
$0
2
$74,875
0
$0
Aggregated Statistics For Year 2005 (Based on 2 full tracts)
A) FHA, FSA/RHS & VA Home Purchase Loans
B) Conventional Home Purchase Loans
C) Refinancings
D) Home Improvement Loans
F) Non-occupant Loans on < 5 Family Dwellings (A B C & D)
G) Loans On Manufactured Home Dwelling (A B C & D)
Number
Average Value
Number
Average Value
Number
Average Value
Number
Average Value
Number
Average Value
Number
Average Value
LOANS ORIGINATED
0
$0
8
$94,839
4
$80,862
4
$20,965
2
$83,855
2
$93,840
APPLICATIONS APPROVED, NOT ACCEPTED
2
$75,870
4
$64,390
4
$180,192
0
$0
0
$0
2
$75,870
APPLICATIONS DENIED
2
$245,580
6
$171,375
28
$91,130
6
$58,233
8
$98,082
4
$81,860
APPLICATIONS WITHDRAWN
0
$0
8
$94,589
8
$127,532
4
$39,932
2
$69,880
0
$0
FILES CLOSED FOR INCOMPLETENESS
0
$0
0
$0
4
$117,800
0
$0
0
$0
0
$0
Aggregated Statistics For Year 2004 (Based on 2 full tracts)
B) Conventional Home Purchase Loans
C) Refinancings
D) Home Improvement Loans
F) Non-occupant Loans on < 5 Family Dwellings (A B C & D)
G) Loans On Manufactured Home Dwelling (A B C & D)
Detailed PMIC statistics for the following Tracts:0125.00
2005 - 2018 National Fire Incident Reporting System (NFIRS) incidents
Based on the data from the years 2005 - 2018 the average number of fires per year is 20. The highest number of fire incidents - 70 took place in 2014, and the least - 0 in 2009. The data has a growing trend.
When looking into fire subcategories, the most reports belonged to: Outside Fires (58.4%), and Structure Fires (23.4%).
Fire incident types reported to NFIRS in Zip Code 92283
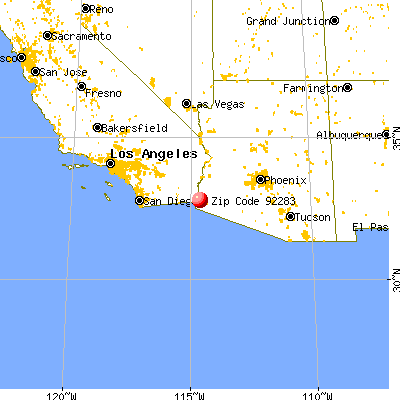


 Nearest zip codes: 85364, 92222, 85350, 85336, 85349, 92250.


 . Federal Facility

 Based on the data from the years 2005 - 2018 the average number of fires per year is 20. The highest number of fire incidents - 70 took place in 2014, and the least - 0 in 2009. The data has a growing trend.
 When looking into fire subcategories, the most reports belonged to: Outside Fires (58.4%), and Structure Fires (23.4%).