Estimated zip code population in 2022: 5,016 Zip code population in 2010: 4,894 Zip code population in 2000: 4,247
Houses and condos: 3,080 Renter-occupied apartments: 457
% of renters here:
19%
State:
44%
March 2022 cost of living index in zip code 92397: 82.0 (low, U.S. average is 100)
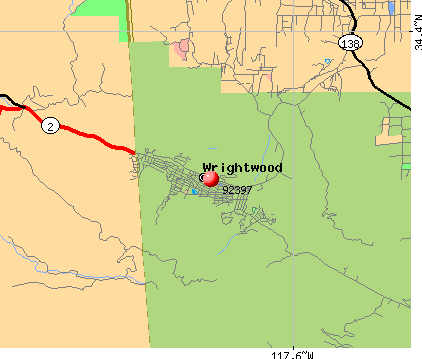
Land area: 10.3 sq. mi. Water area: 0.0 sq. mi.
Population density: 486 people per square mile
(low).
OSM Map
General Map
Google Map
MSN Map
OSM Map
General Map
Google Map
MSN Map
OSM Map
General Map
Google Map
MSN Map
OSM Map
General Map
Google Map
MSN Map
Please wait while loading the map...
Real estate property taxes paid for housing units in 2022:
This zip code:
0.5% ($2,460)
California:
0.7% ($4,831)
Median real estate property taxes paid for housing units with mortgages in 2022: $2,789 (0.6%) Median real estate property taxes paid for housing units with no mortgage in 2022: $2,132 (0.5%)
Business Search- 14 Million verified businesses
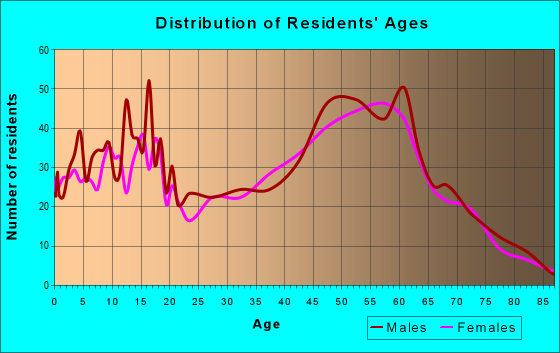
Males: 2,689
(53.6%)
Females: 2,327
(46.4%)
For population 25 years and over in 92397:
High school or higher: 94.8%
Bachelor's degree or higher: 42.9%
Graduate or professional degree: 18.5%
Unemployed: 2.5%
Mean travel time to work (commute): 35.8 minutes
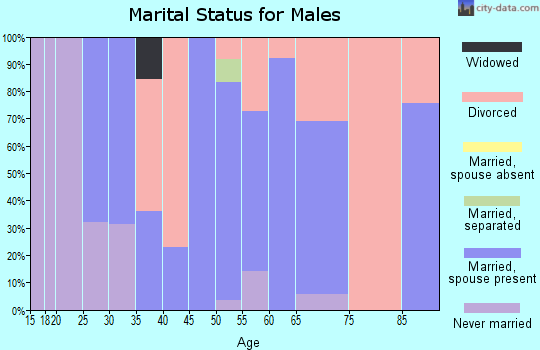
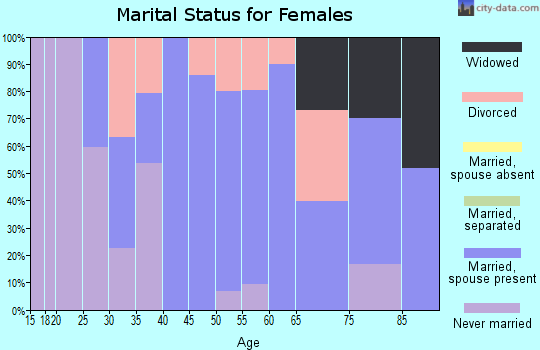
For population 15 years and over in 92397:
Never married: 13.6%
Now married: 65.7%
Separated: 3.4%
Widowed: 4.6%
Divorced: 12.8%
Zip code 92397 compared to state average:
Median house value below state average.
Unemployed percentage below state average.
Black race population percentage significantly below state average.
Hispanic race population percentage significantly below state average.
Median age significantly above state average.
Foreign-born population percentage significantly below state average.
Renting percentage significantly below state average.
Length of stay since moving in significantly above state average.
Estimated median house/condo value in 2022: $463,114
92397:
$463,114
California:
$715,900
According to our research of California and other state lists, there were 4 registered sex offenders living in 92397 zip code as of April 23, 2024. The ratio of all residents to sex offenders in zip code 92397 is 1,231 to 1. The ratio of registered sex offenders to all residents in this zip code is lower than the state average.
Median resident age:
This zip code:
54.0 years
California median age:
37.9 years
Average household size:
This zip code:
2.1 people
California:
2.8 people
Averages for the 2020 tax year for zip code 92397, filed in 2021:
Average Adjusted Gross Income (AGI) in 2020: $82,185 (Individual Income Tax Returns)
Here:
$82,185
State:
$95,910
Salary/wage: $76,062 (reported on 74.4% of returns)
Here:
$76,062
State:
$77,331
(% of AGI for various income ranges: 995.8% for AGIs below $25k, 3585.2% for AGIs $25k-50k, 6931.8% for AGIs $50k-75k, 9289.5% for AGIs $75k-100k, 17950.3% for AGIs $100k-200k, 64998.0% for AGIs over 200k)
Taxable interest for individuals: $918 (reported on 46.1% of returns)
This zip code:
$918
California:
$2,294
(% of AGI for various income ranges: 14.2% for AGIs below $25k, 16.3% for AGIs $25k-50k, 50.5% for AGIs $50k-75k, 40.5% for AGIs $75k-100k, 71.7% for AGIs $100k-200k, 1060.0% for AGIs over 200k)
Ordinary dividends: $2,971 (reported on 17.4% of returns)
Here:
$2,971
State:
$10,949
(% of AGI for various income ranges: 23.3% for AGIs below $25k, 74.1% for AGIs $25k-50k, 38.2% for AGIs $50k-75k, 101.4% for AGIs $75k-100k, 71.1% for AGIs $100k-200k, 958.0% for AGIs over 200k)
Net capital gain/loss in AGI: +$15,511 (reported on 17.4% of returns)
Here:
+$15,511
State:
+$49,306
(% of AGI for various income ranges: 7.6% for AGIs below $25k, 107.0% for AGIs $25k-50k, 80.5% for AGIs $50k-75k, 139.0% for AGIs $75k-100k, 417.5% for AGIs $100k-200k, 9370.0% for AGIs over 200k)
Profit/loss from business: +$12,717 (reported on 18.2% of returns)
Here:
+$12,717
State:
+$15,671
(% of AGI for various income ranges: 126.4% for AGIs below $25k, 397.0% for AGIs $25k-50k, 230.5% for AGIs $50k-75k, 506.2% for AGIs $75k-100k, 283.3% for AGIs $100k-200k, 3492.0% for AGIs over 200k)
Taxable individual retirement arrangement distribution: $20,009 (reported on 8.9% of returns)
92397:
$20,009
California:
$23,505
(% of AGI for various income ranges: 70.2% for AGIs below $25k, 86.7% for AGIs $25k-50k, 187.3% for AGIs $50k-75k, 356.2% for AGIs $75k-100k, 803.3% for AGIs $100k-200k)
Total itemized deductions: $30,113 (reported on 17.8% of returns)
Here:
$30,113
State:
$39,517
(% of AGI for various income ranges: 488.1% for AGIs $25k-50k, 611.4% for AGIs $50k-75k, 1010.5% for AGIs $75k-100k, 1606.1% for AGIs $100k-200k, 6570.0% for AGIs over 200k)
Charity contributions: $6,736 (reported on 15.1% of returns)
Here:
$6,736
State:
$12,598
(% of AGI for various income ranges: 55.9% for AGIs $25k-50k, 84.5% for AGIs $50k-75k, 157.6% for AGIs $75k-100k, 332.5% for AGIs $100k-200k, 1524.0% for AGIs over 200k)
Taxes paid: $8,567 (reported on 17.8% of returns)
92397:
$8,567
State:
$8,807
(% of AGI for various income ranges: 85.2% for AGIs $25k-50k, 184.1% for AGIs $50k-75k, 322.4% for AGIs $75k-100k, 534.2% for AGIs $100k-200k, 1412.0% for AGIs over 200k)
Earned income credit: $1,796 (reported on 9.7% of returns)
Here:
$1,796
State:
$2,074
(% of AGI for various income ranges: 66.7% for AGIs below $25k, 55.2% for AGIs $25k-50k)
Percentage of individuals using paid preparers for their 2020 taxes: 93.0%
Here:
93%
State:
92%
(% for various income ranges: 91.2% for AGIs below $25k, 92.9% for AGIs $25k-50k, 91.7% for AGIs $50k-75k, 97.0% for AGIs $75k-100k, 93.5% for AGIs $100k-200k, 94.1% for AGIs over 200k)
Averages for the 2012 tax year for zip code 92397, filed in 2013:
Average Adjusted Gross Income (AGI) in 2012: $73,591 (Individual Income Tax Returns)
Here:
$73,591
State:
$72,726
Salary/wage: $59,423 (reported on 78.9% of returns)
Here:
$59,423
State:
$59,079
(% of AGI for various income ranges: 60.2% for AGIs below $25k, 68.6% for AGIs $25k-50k, 79.1% for AGIs $50k-75k, 75.8% for AGIs $75k-100k, 74.8% for AGIs $100k-200k, 30.5% for AGIs over 200k)
Taxable interest for individuals: $849 (reported on 45.2% of returns)
This zip code:
$849
California:
$2,146
(% of AGI for various income ranges: 1.1% for AGIs below $25k, 0.9% for AGIs $25k-50k, 0.3% for AGIs $50k-75k, 0.5% for AGIs $75k-100k, 0.5% for AGIs $100k-200k, 0.4% for AGIs over 200k)
Ordinary dividends: $2,998 (reported on 17.5% of returns)
Here:
$2,998
State:
$9,308
(% of AGI for various income ranges: 1.5% for AGIs below $25k, 0.8% for AGIs $25k-50k, 0.6% for AGIs $50k-75k, 0.8% for AGIs $75k-100k, 0.4% for AGIs $100k-200k, 1.0% for AGIs over 200k)
Net capital gain/loss in AGI: +$23,697 (reported on 14.5% of returns)
Here:
+$23,697
State:
+$30,460
(% of AGI for various income ranges: 0.3% for AGIs $75k-100k, 0.9% for AGIs $100k-200k, 18.4% for AGIs over 200k)
Profit/loss from business: +$12,080 (reported on 18.0% of returns)
Here:
+$12,080
State:
+$17,064
(% of AGI for various income ranges: 8.2% for AGIs below $25k, 5.7% for AGIs $25k-50k, 1.1% for AGIs $50k-75k, 2.4% for AGIs $75k-100k, 4.7% for AGIs $100k-200k)
Taxable individual retirement arrangement distribution: $16,971 (reported on 10.5% of returns)
92397:
$16,971
California:
$19,557
(% of AGI for various income ranges: 4.5% for AGIs below $25k, 2.0% for AGIs $25k-50k, 2.0% for AGIs $50k-75k, 2.7% for AGIs $75k-100k, 4.1% for AGIs $100k-200k)
Total itemized deductions: $24,495 (21% of AGI, reported on 49.6% of returns)
Here:
$24,495
State:
$34,004
Here:
21.3% of AGI
State:
22.7% of AGI
(% of AGI for various income ranges: 19.1% for AGIs below $25k, 14.9% for AGIs $25k-50k, 19.2% for AGIs $50k-75k, 18.9% for AGIs $75k-100k, 19.5% for AGIs $100k-200k, 9.3% for AGIs over 200k)
Charity contributions: $3,488 (reported on 40.4% of returns)
Here:
$3,488
State:
$4,659
(% of AGI for various income ranges: 1.2% for AGIs below $25k, 1.5% for AGIs $25k-50k, 1.7% for AGIs $50k-75k, 2.5% for AGIs $75k-100k, 2.4% for AGIs $100k-200k, 1.3% for AGIs over 200k)
Taxes paid: $8,504 (reported on 49.6% of returns)
92397:
$8,504
State:
$14,448
(% of AGI for various income ranges: 3.2% for AGIs below $25k, 3.5% for AGIs $25k-50k, 5.5% for AGIs $50k-75k, 5.9% for AGIs $75k-100k, 7.0% for AGIs $100k-200k, 5.5% for AGIs over 200k)
Earned income credit: $2,108 (reported on 11.4% of returns)
Here:
$2,108
State:
$2,286
(% of AGI for various income ranges: 5.0% for AGIs below $25k, 0.9% for AGIs $25k-50k)
Percentage of individuals using paid preparers for their 2012 taxes: 62.7%
Here:
63%
State:
64%
(% for various income ranges: 50.0% for AGIs below $25k, 61.4% for AGIs $25k-50k, 71.1% for AGIs $50k-75k, 70.0% for AGIs $75k-100k, 69.2% for AGIs $100k-200k, 85.7% for AGIs over 200k)
Averages for the 2004 tax year for zip code 92397, filed in 2005:
Average Adjusted Gross Income (AGI) in 2004: $55,811 (Individual Income Tax Returns)
Here:
$55,811
State:
$58,600
Salary/wage: $52,119 (reported on 80.7% of returns)
Here:
$52,119
State:
$49,455
(% of AGI for various income ranges: 130.6% for AGIs below $10k, 62.3% for AGIs $10k-25k, 72.4% for AGIs $25k-50k, 82.6% for AGIs $50k-75k, 82.8% for AGIs $75k-100k, 69.7% for AGIs over 100k)
Taxable interest for individuals: $1,621 (reported on 55.4% of returns)
This zip code:
$1,621
California:
$2,365
(% of AGI for various income ranges: 8.6% for AGIs below $10k, 2.9% for AGIs $10k-25k, 1.5% for AGIs $25k-50k, 0.7% for AGIs $50k-75k, 0.8% for AGIs $75k-100k, 2.2% for AGIs over 100k)
Taxable dividends: $1,635 (reported on 21.3% of returns)
Here:
$1,635
State:
$4,746
(% of AGI for various income ranges: 4.9% for AGIs below $10k, 2.0% for AGIs $10k-25k, 0.7% for AGIs $25k-50k, 0.4% for AGIs $50k-75k, 0.9% for AGIs $75k-100k, 0.3% for AGIs over 100k)
Net capital gain/loss: +$10,894 (reported on 19.6% of returns)
Here:
+$10,894
State:
+$23,418
(% of AGI for various income ranges: -7.3% for AGIs below $10k, -0.7% for AGIs $10k-25k, 0.4% for AGIs $25k-50k, -0.1% for AGIs $50k-75k, 1.5% for AGIs $75k-100k, 8.9% for AGIs over 100k)
Profit/loss from business: +$13,985 (reported on 19.9% of returns)
Here:
+$13,985
State:
+$16,826
(% of AGI for various income ranges: 7.9% for AGIs below $10k, 6.2% for AGIs $10k-25k, 7.9% for AGIs $25k-50k, 2.4% for AGIs $50k-75k, 4.5% for AGIs $75k-100k, 5.4% for AGIs over 100k)
IRA payment deduction: $3,210 (reported on 2.6% of returns)
92397:
$3,210
California:
$3,192
Self-employed pension: $18,235 (reported on 0.7% of returns)
Here:
$18,235
California:
$17,688
Total itemized deductions: $21,450 (26% of AGI, reported on 54.8% of returns)
Here:
$21,450
State:
$28,113
Here:
26.0% of AGI
State:
25.3% of AGI
(% of AGI for various income ranges: 26.8% for AGIs below $10k, 17.5% for AGIs $10k-25k, 21.0% for AGIs $25k-50k, 24.0% for AGIs $50k-75k, 23.4% for AGIs $75k-100k, 18.8% for AGIs over 100k)
Charity contributions deductions: $3,072 (4% of AGI, reported on 48.4% of returns)
Here:
$3,072
State:
$3,923
Here:
3.6% of AGI
State:
3.3% of AGI
(% of AGI for various income ranges: 1.5% for AGIs below $10k, 1.8% for AGIs $10k-25k, 2.3% for AGIs $25k-50k, 2.9% for AGIs $50k-75k, 2.9% for AGIs $75k-100k, 2.7% for AGIs over 100k)
Total tax: $7,592 (reported on 80.9% of returns)
92397:
$7,592
State:
$10,761
(% of AGI for various income ranges: 6.1% for AGIs below $10k, 4.5% for AGIs $10k-25k, 7.1% for AGIs $25k-50k, 8.3% for AGIs $50k-75k, 9.5% for AGIs $75k-100k, 15.3% for AGIs over 100k)
Earned income credit: $1,396 (reported on 9.4% of returns)
Here:
$1,396
State:
$1,763
Percentage of individuals using paid preparers for their 2004 taxes: 67.2%
Here:
67%
State:
66%
(% for various income ranges: 53.7% for AGIs below $10k, 61.9% for AGIs $10k-25k, 68.8% for AGIs $25k-50k, 70.5% for AGIs $50k-75k, 69.8% for AGIs $75k-100k, 79.7% for AGIs over 100k)
Household received Food Stamps/SNAP in the past 12 months: 100 Household did not receive Food Stamps/SNAP in the past 12 months: 2,216
Women who had a birth in the past 12 months: 47 (46 now married, 0 unmarried) Women who did not have a birth in the past 12 months: 744 (377 now married, 364 unmarried)
Housing units in zip code 92397 with a mortgage: 1,137 (48 second mortgage, 20 both second mortgage and home equity loan) Houses without a mortgage: 17
Median monthly owner costs for units with a mortgage: $1,974 Median monthly owner costs for units without a mortgage: $493
Residents with income below the poverty level in 2022:
This zip code:
14.2%
Whole state:
12.2%
Residents with income below 50% of the poverty level in 2022:
This zip code:
8.7%
Whole state:
6.2%
Median number of rooms in houses and condos:
Here:
6.2
State:
6.0
Median number of rooms in apartments:
Here:
4.3
State:
3.9
Notable locations in this zip code not listed on our city pages
Notable locations in zip code 92397: Camp Maria Stella (A), San Bernardino County Fire Department Station 14 Wrightwood (B). Display/hide their locations on the map
Size of family households: 1,076 2-persons, 158 3-persons, 97 4-persons, 124 5-persons, 72 6-persons
Size of nonfamily households: 691 1-person, 160 2-persons
750 married couples with children.
85 single-parent households (59 men, 26 women).
92.1% of residents of 92397 zip code speak English at home.
7.7% of residents speak Spanish at home (70% very well, 30% not well).
0.5% of residents speak other Indo-European language at home (100% very well).
0.2% of residents speak Asian or Pacific Island language at home (100% very well).
Foreign born population: 565 (11.3%) (45.1% of them are naturalized citizens)
This zip code:
11.3%
Whole state:
26.7%
37%Honduras
25%Malaysia
7%Belgium
3%Azores Islands
1%Singapore
18%Irish
12%English
9%German
6%Polish
5%American
4%European
3%Scottish
Year of entry for the foreign-born population
1372010 or later
872000 to 2009
1791990 to 1999
163Before 1990
Facilities with environmental interests located in this zip code:
JPL TABLE MOUNTAIN OBSERVATORY (24490 TABLE MOUNTAIN ROAD in WRIGHTWOOD, CA) . Federal Facility. NATIONAL AERONAUTICS AND SPACE ADMINISTRATION
STATE MASTER (California - Hazardous Waste Tracking) - HAZARDOU WASTE PROGRAM Small Quantity Generators, between 100 kg and 1000 kg of hazardous waste/month (Resource Conservation and Recovery Act (tracking hazardous waste)) - notification Organizations: N A S A (CONTACT/OWNER)
Alternative names: J P L TABLE MOUNTAIN OBSERVATORY, USNASA JPL TABLE MTN FACILITY
MOUNTAIN HIGH SKI RESORT (WEST) (24512 BIG PINES HWY in WRIGHTWOOD, CA) . Federal Facility
AIR SYNTHETIC MINOR (AIRS/AFS) CRITERIA AND HAZARDOUS AIR POLLUTANT INVENTORY (Inventory of air pollution sources) National Pollutant Discharge Elimination System NON-MAJOR (Tracking pollutant discharge elimination systems) - permit Small Quantity Generators, between 100 kg and 1000 kg of hazardous waste/month (Resource Conservation and Recovery Act (tracking hazardous waste)) - notification Business SIC classification: AMUSEMENT AND RECREATION SERVICES Organizations: MOUNTAIN HIGH HOLDING L L C (CONTACT/OWNER)
Alternative names: MOUNTAIN HIGH/HOL HILL CORP, MOUNTAIN HIGH/HOLIDAY HILL COR, MOUNTAIN HIGH RESORT WEST
MOUNTAIN HIGH RESORT EAST (25234 STATE HIGHWAY 2 in WRIGHTWOOD, CA) . Federal Facility
Small Quantity Generators, between 100 kg and 1000 kg of hazardous waste/month (Resource Conservation and Recovery Act (tracking hazardous waste)) - notification Organizations: MOUNTAIN HIGH HOLDING L L C (CONTACT/OWNER)
CALTRANS DISTRICT 8 WRIGHTWOOD (26249 E BIG PINES HIGHWAY in WRIGHTWOOD, CA)
Small Quantity Generators, between 100 kg and 1000 kg of hazardous waste/month (Resource Conservation and Recovery Act (tracking hazardous waste))
Housing units lacking complete plumbing facilities: 2.2% Housing units lacking complete kitchen facilities: 1.9%
77.6%Utility gas
11.3%Wood
10.1%Electricity
1.0%Bottled, tank, or LP gas
Population in 1990: 4,148. Population change in the 1990s: +99 (+2.4%).
Place of birth for U.S.-born residents:
This state: 2,919
Northeast: 348
Midwest: 446
South: 418
West: 283
50% of the 92397 zip code residents lived in the same house 5 years ago. Out of people who lived in different houses, 52% lived in this county. Out of people who lived in different counties, 50% lived in California.
93% of the 92397 zip code residents lived in the same house 1 year ago. Out of people who lived in different houses, 74% moved from this county. Out of people who lived in different houses, 26% moved from different county within same state.
Private vs. public school enrollment:
Students in private schools in grades 1 to 8 (elementary and middle school): 59
Here:
14.6%
California:
10.5%
Students in private schools in grades 9 to 12 (high school):
Here:
0.0%
California:
8.5%
Students in private undergraduate colleges: 48
Here:
35.2%
California:
15.9%
Occupation by median earnings in the past 12 months ($)
166,023Architecture and engineering occupations
131,490Management occupations
123,322Business and financial operations occupations
104,471Construction and extraction occupations
100,086Community and social service occupations
93,486Production occupations
Companies with federal contracts located in this zip code:
HEINZ H STEINMANN (5797 CEDAR ST in WRIGHTWOOD, CA; small business) : $20,528 in 2 contractsfrom 2002 to 2003
$10,264 with Public Buildings Service for Lease or Rental of Facilities -- Office Buildings. Signed on 2002-12-15. Completion date: 2002-12-15.
$10,264, same as above.Signed on 2003-03-15. Completion date: 2003-03-15.
VAN DER STAHL SCIENTIFIC, INC (2043 OUTER HIGHWAY 2 BOX in WRIGHTWOOD, CA; small business)
$3,995 with Army for Laboratory Equipment and Supplies. Signed on 2002-08-05. Completion date: 2002-08-30.
Top industries in this zip code by the number of employees in 2005:
Accommodation and Food Services: Hotels (except Casino Hotels) and Motels (500-999 employees: 1 establishment, 1-4 employees: 2 establishments)
Accommodation and Food Services: Full-Service Restaurants (20-49: 1, 10-19: 3)


 Nearest zip codes: 92372, 92371, 91759, 93563, 92358, 93544.


 . Federal Facility. NATIONAL AERONAUTICS AND SPACE ADMINISTRATION