Estimated zip code population in 2022: 58,892 Zip code population in 2010: 16,366 Zip code population in 2000: 6,297
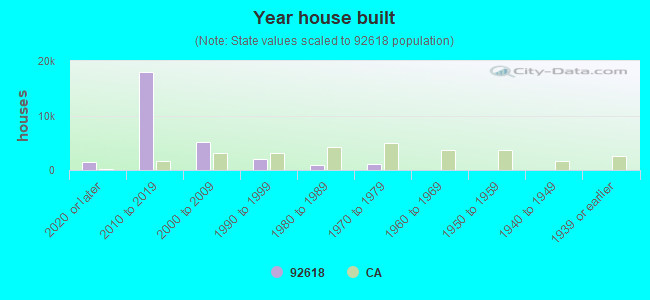
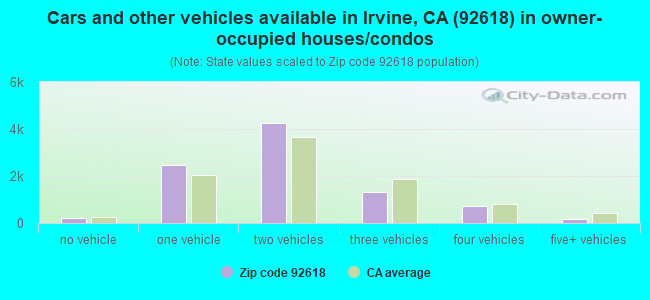
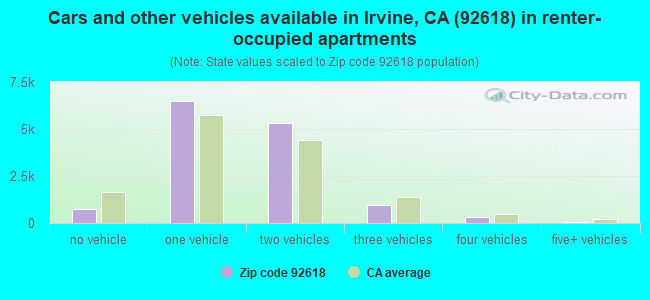
Houses and condos: 25,303 Renter-occupied apartments: 13,840
% of renters here:
60%
State:
44%
March 2022 cost of living index in zip code 92618: 88.6 (less than average, U.S. average is 100)
Land area: 21.1 sq. mi. Water area: 0.0 sq. mi.
Population density: 2,787 people per square mile
(average).
OSM Map
General Map
Google Map
MSN Map
OSM Map
General Map
Google Map
MSN Map
OSM Map
General Map
Google Map
MSN Map
OSM Map
General Map
Google Map
MSN Map
Please wait while loading the map...
Real estate property taxes paid for housing units in 2022:
This zip code:
0.9% ($10,292)
California:
0.7% ($4,831)
Median real estate property taxes paid for housing units with mortgages in 2022: $10,330 (0.9%) Median real estate property taxes paid for housing units with no mortgage in 2022: $10,572 (0.8%)
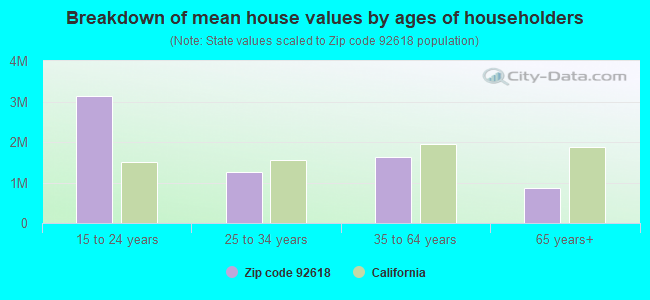
Estimated median house/condo value in 2022: $1,198,343
92618:
$1,198,343
California:
$715,900
According to our research of California and other state lists, there were 5 registered sex offenders living in 92618 zip code as of April 24, 2024. The ratio of all residents to sex offenders in zip code 92618 is 6,070 to 1. The ratio of registered sex offenders to all residents in this zip code is much lower than the state average.
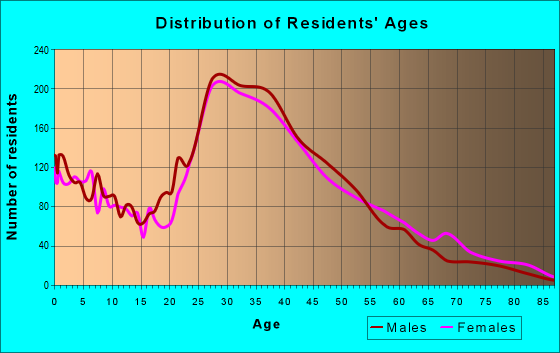
Median resident age:
This zip code:
34.4 years
California median age:
37.9 years
Average household size:
This zip code:
2.6 people
California:
2.8 people
Averages for the 2020 tax year for zip code 92618, filed in 2021:
Average Adjusted Gross Income (AGI) in 2020: $160,418 (Individual Income Tax Returns)
Here:
$160,418
State:
$95,910
Salary/wage: $141,539 (reported on 83.4% of returns)
Here:
$141,539
State:
$77,331
(% of AGI for various income ranges: 1144.8% for AGIs below $25k, 3695.5% for AGIs $25k-50k, 7583.7% for AGIs $50k-75k, 11629.3% for AGIs $75k-100k, 22838.3% for AGIs $100k-200k, 133910.4% for AGIs over 200k)
Taxable interest for individuals: $3,150 (reported on 43.6% of returns)
This zip code:
$3,150
California:
$2,294
(% of AGI for various income ranges: 55.5% for AGIs below $25k, 97.0% for AGIs $25k-50k, 137.2% for AGIs $50k-75k, 100.1% for AGIs $75k-100k, 203.7% for AGIs $100k-200k, 1468.5% for AGIs over 200k)
Ordinary dividends: $7,506 (reported on 32.7% of returns)
Here:
$7,506
State:
$10,949
(% of AGI for various income ranges: 35.5% for AGIs below $25k, 73.1% for AGIs $25k-50k, 97.2% for AGIs $50k-75k, 128.9% for AGIs $75k-100k, 251.5% for AGIs $100k-200k, 3503.7% for AGIs over 200k)
Net capital gain/loss in AGI: +$37,424 (reported on 36.1% of returns)
Here:
+$37,424
State:
+$49,306
(% of AGI for various income ranges: 81.9% for AGIs below $25k, 149.6% for AGIs $25k-50k, 182.4% for AGIs $50k-75k, 342.6% for AGIs $75k-100k, 1015.1% for AGIs $100k-200k, 21791.8% for AGIs over 200k)
Profit/loss from business: +$16,453 (reported on 22.1% of returns)
Here:
+$16,453
State:
+$15,671
(% of AGI for various income ranges: 207.3% for AGIs below $25k, 498.0% for AGIs $25k-50k, 381.3% for AGIs $50k-75k, 323.7% for AGIs $75k-100k, 568.8% for AGIs $100k-200k, 3132.8% for AGIs over 200k)
Taxable individual retirement arrangement distribution: $27,865 (reported on 4.1% of returns)
92618:
$27,865
California:
$23,505
(% of AGI for various income ranges: 34.5% for AGIs below $25k, 63.3% for AGIs $25k-50k, 99.0% for AGIs $50k-75k, 119.7% for AGIs $75k-100k, 286.2% for AGIs $100k-200k, 979.2% for AGIs over 200k)
Self-employed (Keogh) retirement plans: $37,803 (reported on 1.4% of returns)
92618:
$37,803
California:
$30,163
(% of AGI for various income ranges: 25.9% for AGIs $50k-75k, 30.9% for AGIs $100k-200k, 863.2% for AGIs over 200k)
Total itemized deductions: $39,457 (reported on 22.2% of returns)
Here:
$39,457
State:
$39,517
(% of AGI for various income ranges: 112.1% for AGIs below $25k, 304.1% for AGIs $25k-50k, 477.3% for AGIs $50k-75k, 808.6% for AGIs $75k-100k, 1755.6% for AGIs $100k-200k, 9836.7% for AGIs over 200k)
Charity contributions: $9,846 (reported on 17.5% of returns)
Here:
$9,846
State:
$12,598
(% of AGI for various income ranges: 4.5% for AGIs below $25k, 17.5% for AGIs $25k-50k, 40.9% for AGIs $50k-75k, 93.2% for AGIs $75k-100k, 233.1% for AGIs $100k-200k, 2475.4% for AGIs over 200k)
Taxes paid: $9,494 (reported on 22.2% of returns)
92618:
$9,494
State:
$8,807
(% of AGI for various income ranges: 28.4% for AGIs below $25k, 79.4% for AGIs $25k-50k, 133.3% for AGIs $50k-75k, 249.8% for AGIs $75k-100k, 536.1% for AGIs $100k-200k, 1996.6% for AGIs over 200k)
Earned income credit: $1,723 (reported on 7.9% of returns)
Here:
$1,723
State:
$2,074
(% of AGI for various income ranges: 57.7% for AGIs below $25k, 59.2% for AGIs $25k-50k, 0.5% for AGIs $50k-75k)
Percentage of individuals using paid preparers for their 2020 taxes: 94.3%
Here:
94%
State:
92%
(% for various income ranges: 92.3% for AGIs below $25k, 94.0% for AGIs $25k-50k, 95.1% for AGIs $50k-75k, 94.8% for AGIs $75k-100k, 94.9% for AGIs $100k-200k, 95.4% for AGIs over 200k)
Averages for the 2012 tax year for zip code 92618, filed in 2013:
Average Adjusted Gross Income (AGI) in 2012: $118,096 (Individual Income Tax Returns)
Here:
$118,096
State:
$72,726
Salary/wage: $99,788 (reported on 87.7% of returns)
Here:
$99,788
State:
$59,079
(% of AGI for various income ranges: 77.1% for AGIs below $25k, 83.7% for AGIs $25k-50k, 88.7% for AGIs $50k-75k, 90.0% for AGIs $75k-100k, 88.7% for AGIs $100k-200k, 59.1% for AGIs over 200k)
Taxable interest for individuals: $2,596 (reported on 48.1% of returns)
This zip code:
$2,596
California:
$2,146
(% of AGI for various income ranges: 2.5% for AGIs below $25k, 0.9% for AGIs $25k-50k, 0.7% for AGIs $50k-75k, 0.5% for AGIs $75k-100k, 0.5% for AGIs $100k-200k, 1.5% for AGIs over 200k)
Ordinary dividends: $10,477 (reported on 25.9% of returns)
Here:
$10,477
State:
$9,308
(% of AGI for various income ranges: 1.9% for AGIs below $25k, 0.8% for AGIs $25k-50k, 0.7% for AGIs $50k-75k, 0.6% for AGIs $75k-100k, 0.8% for AGIs $100k-200k, 3.9% for AGIs over 200k)
Net capital gain/loss in AGI: +$15,620 (reported on 25.7% of returns)
Here:
+$15,620
State:
+$30,460
(% of AGI for various income ranges: 0.3% for AGIs $50k-75k, 0.1% for AGIs $75k-100k, 0.6% for AGIs $100k-200k, 6.7% for AGIs over 200k)
Profit/loss from business: +$19,842 (reported on 19.5% of returns)
Here:
+$19,842
State:
+$17,064
(% of AGI for various income ranges: 16.9% for AGIs below $25k, 7.4% for AGIs $25k-50k, 4.1% for AGIs $50k-75k, 3.0% for AGIs $75k-100k, 2.8% for AGIs $100k-200k, 2.4% for AGIs over 200k)
Taxable individual retirement arrangement distribution: $17,990 (reported on 5.2% of returns)
92618:
$17,990
California:
$19,557
(% of AGI for various income ranges: 2.3% for AGIs below $25k, 1.4% for AGIs $25k-50k, 0.7% for AGIs $50k-75k, 1.1% for AGIs $75k-100k, 0.8% for AGIs $100k-200k, 0.6% for AGIs over 200k)
Self-employment retirement plans: $26,435 (reported on 1.5% of returns)
92618:
$26,435
California:
$24,530
(% of AGI for various income ranges: 0.5% for AGIs $50k-75k, 0.2% for AGIs $100k-200k, 0.5% for AGIs over 200k)
Total itemized deductions: $37,972 (20% of AGI, reported on 51.3% of returns)
Here:
$37,972
State:
$34,004
Here:
20.3% of AGI
State:
22.7% of AGI
(% of AGI for various income ranges: 14.7% for AGIs below $25k, 12.5% for AGIs $25k-50k, 12.8% for AGIs $50k-75k, 16.4% for AGIs $75k-100k, 17.5% for AGIs $100k-200k, 17.0% for AGIs over 200k)
Charity contributions: $4,997 (reported on 39.7% of returns)
Here:
$4,997
State:
$4,659
(% of AGI for various income ranges: 0.7% for AGIs below $25k, 1.2% for AGIs $25k-50k, 1.3% for AGIs $50k-75k, 1.4% for AGIs $75k-100k, 1.5% for AGIs $100k-200k, 2.0% for AGIs over 200k)
Taxes paid: $19,621 (reported on 51.1% of returns)
92618:
$19,621
State:
$14,448
(% of AGI for various income ranges: 3.6% for AGIs below $25k, 3.6% for AGIs $25k-50k, 4.1% for AGIs $50k-75k, 6.7% for AGIs $75k-100k, 8.4% for AGIs $100k-200k, 10.3% for AGIs over 200k)
Earned income credit: $1,617 (reported on 7.0% of returns)
Here:
$1,617
State:
$2,286
(% of AGI for various income ranges: 3.6% for AGIs below $25k, 0.4% for AGIs $25k-50k)
Percentage of individuals using paid preparers for their 2012 taxes: 57.1%
Here:
57%
State:
64%
(% for various income ranges: 53.8% for AGIs below $25k, 54.0% for AGIs $25k-50k, 53.3% for AGIs $50k-75k, 55.3% for AGIs $75k-100k, 58.1% for AGIs $100k-200k, 71.6% for AGIs over 200k)
Averages for the 2004 tax year for zip code 92618, filed in 2005:
Average Adjusted Gross Income (AGI) in 2004: $106,313 (Individual Income Tax Returns)
Here:
$106,313
State:
$58,600
Salary/wage: $70,165 (reported on 88.0% of returns)
Here:
$70,165
State:
$49,455
(% of AGI for various income ranges: 74.0% for AGIs $10k-25k, 87.3% for AGIs $25k-50k, 90.0% for AGIs $50k-75k, 89.1% for AGIs $75k-100k, 44.5% for AGIs over 100k)
Taxable interest for individuals: $2,044 (reported on 55.2% of returns)
This zip code:
$2,044
California:
$2,365
(% of AGI for various income ranges: 3.5% for AGIs $10k-25k, 1.2% for AGIs $25k-50k, 0.9% for AGIs $50k-75k, 0.8% for AGIs $75k-100k, 0.9% for AGIs over 100k)
Taxable dividends: $2,623 (reported on 27.5% of returns)
Here:
$2,623
State:
$4,746
(% of AGI for various income ranges: 1.4% for AGIs $10k-25k, 0.7% for AGIs $25k-50k, 0.5% for AGIs $50k-75k, 0.5% for AGIs $75k-100k, 0.6% for AGIs over 100k)
Net capital gain/loss: +$64,572 (reported on 25.5% of returns)
Here:
+$64,572
State:
+$23,418
(% of AGI for various income ranges: 0.9% for AGIs $10k-25k, -0.0% for AGIs $25k-50k, 0.1% for AGIs $50k-75k, -0.3% for AGIs $75k-100k, 20.4% for AGIs over 100k)
Profit/loss from business: +$16,976 (reported on 17.2% of returns)
Here:
+$16,976
State:
+$16,826
(% of AGI for various income ranges: 9.7% for AGIs $10k-25k, 6.1% for AGIs $25k-50k, 3.9% for AGIs $50k-75k, 4.5% for AGIs $75k-100k, 1.8% for AGIs over 100k)
IRA payment deduction: $3,312 (reported on 3.3% of returns)
92618:
$3,312
California:
$3,192
(% of AGI for various income ranges: 0.3% for AGIs $10k-25k, 0.3% for AGIs $25k-50k, 0.2% for AGIs $50k-75k, 0.1% for AGIs $75k-100k, 0.1% for AGIs over 100k)
Self-employed pension: $16,512 (reported on 1.6% of returns)
Here:
$16,512
California:
$17,688
(% of AGI for various income ranges: 0.5% for AGIs $10k-25k, 0.5% for AGIs $50k-75k, 0.3% for AGIs over 100k)
Total itemized deductions: $30,621 (18% of AGI, reported on 54.8% of returns)
Here:
$30,621
State:
$28,113
Here:
17.8% of AGI
State:
25.3% of AGI
(% of AGI for various income ranges: 15.9% for AGIs $10k-25k, 17.1% for AGIs $25k-50k, 20.9% for AGIs $50k-75k, 22.0% for AGIs $75k-100k, 13.6% for AGIs over 100k)
Charity contributions deductions: $4,419 (2% of AGI, reported on 41.7% of returns)
Here:
$4,419
State:
$3,923
Here:
2.4% of AGI
State:
3.3% of AGI
(% of AGI for various income ranges: 1.2% for AGIs $10k-25k, 1.7% for AGIs $25k-50k, 1.9% for AGIs $50k-75k, 2.1% for AGIs $75k-100k, 1.6% for AGIs over 100k)
Total tax: $21,698 (reported on 85.7% of returns)
92618:
$21,698
State:
$10,761
(% of AGI for various income ranges: 5.7% for AGIs $10k-25k, 8.6% for AGIs $25k-50k, 11.0% for AGIs $50k-75k, 11.8% for AGIs $75k-100k, 19.6% for AGIs over 100k)
Earned income credit: $1,363 (reported on 5.0% of returns)
Here:
$1,363
State:
$1,763
Percentage of individuals using paid preparers for their 2004 taxes: 60.2%
Here:
60%
State:
66%
(% for various income ranges: 60.8% for AGIs below $10k, 61.1% for AGIs $10k-25k, 53.6% for AGIs $25k-50k, 57.6% for AGIs $50k-75k, 62.7% for AGIs $75k-100k, 65.8% for AGIs over 100k)
Likely homosexual households (counted as self-reported same-sex unmarried-partner households)
Lesbian couples: 0.1% of all households
Gay men: 0.1% of all households
Household received Food Stamps/SNAP in the past 12 months: 1,020 Household did not receive Food Stamps/SNAP in the past 12 months: 21,517
Women who had a birth in the past 12 months: 992 (952 now married, 34 unmarried) Women who did not have a birth in the past 12 months: 15,986 (8,292 now married, 7,611 unmarried)
Housing units in zip code 92618 with a mortgage: 6,232 (457 second mortgage, 355 both second mortgage and home equity loan) Houses without a mortgage: 167
Median monthly owner costs for units with a mortgage: $3,876 Median monthly owner costs for units without a mortgage: $1,556
Residents with income below the poverty level in 2022:
This zip code:
8.7%
Whole state:
12.2%
Residents with income below 50% of the poverty level in 2022:
This zip code:
2.4%
Whole state:
6.2%
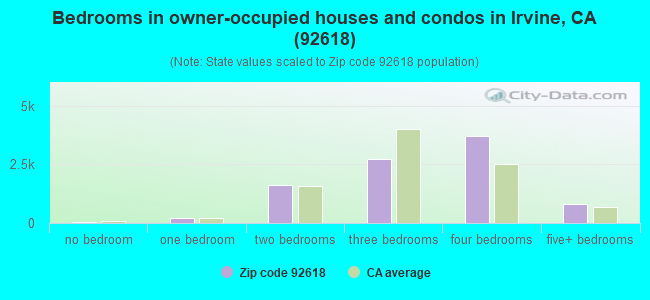
Median number of rooms in houses and condos:
Here:
5.8
State:
6.0
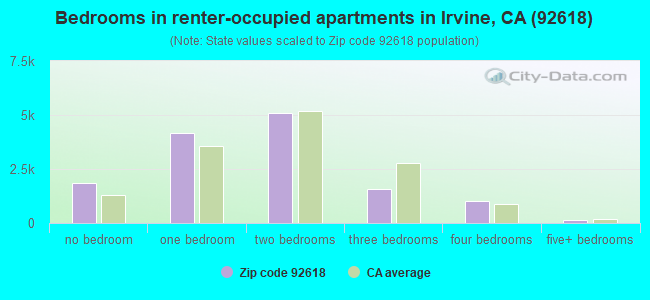
Median number of rooms in apartments:
Here:
3.4
State:
3.9
Notable locations in this zip code not listed on our city pages
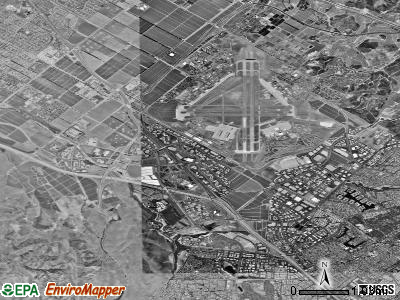
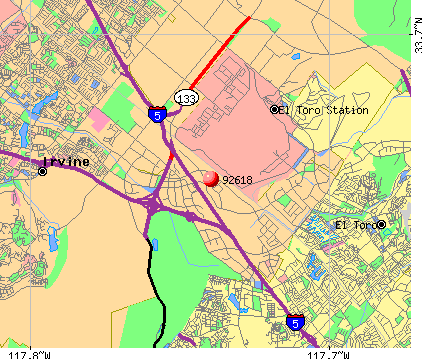
Notable locations in zip code 92618: County Industrial Farm (A), Marine Memorial Golf Course (B), International Raceway (C), James H Musick Branch Jail (D), Orange County Fire Authority Station 51 (E), Orange County Fire Authority Station 27 (F), Orange County Fire Authority Station 38 (G). Display/hide their locations on the map
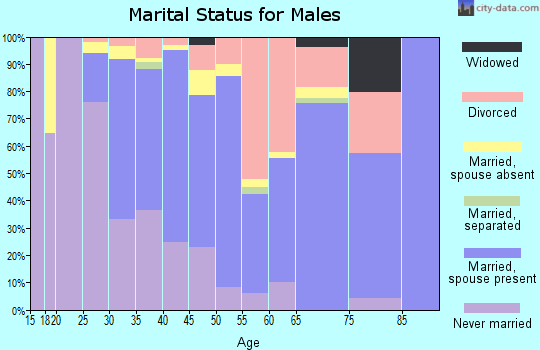
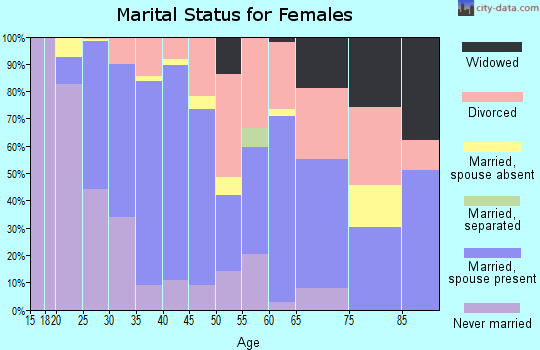
11,647 married couples with children.
1,779 single-parent households (411 men, 1,368 women).
43.1% of residents of 92618 zip code speak English at home.
6.7% of residents speak Spanish at home (82% very well, 14% well, 3% not well, 1% not at all).
12.6% of residents speak other Indo-European language at home (72% very well, 19% well, 7% not well, 2% not at all).
33.4% of residents speak Asian or Pacific Island language at home (58% very well, 24% well, 15% not well, 3% not at all).
4.1% of residents speak other language at home (71% very well, 22% well, 6% not well, 1% not at all).
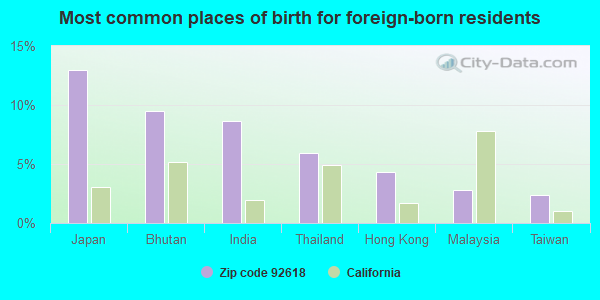
Foreign born population: 25,467 (43.2%) (50.1% of them are naturalized citizens)
Major facilities with environmental interests located in this zip code:
MULTILAYER TECHNOLOGY INCORPORATED (16 HAMMOND 24 HAMMOND in IRVINE, CA)
STATE MASTER (California - Hazardous Waste Tracking) - HAZARDOU WASTE PROGRAM (Integrated Compliance Information System) - ICIS-09-2000-0255, FORMAL ENFORCEMENT ACTION COMPLIANCE ACTIVITY (Tracking inspections of insecticide, fungicide, and rodenticide, and toxic substances) CRITERIA AND HAZARDOUS AIR POLLUTANT INVENTORY (Inventory of air pollution sources) HAZARDOUS WASTE BIENNIAL REPORTER (Resource Conservation and Recovery Act (tracking hazardous waste)) (Resource Conservation and Recovery Act (tracking hazardous waste)) Large Quantity Generators, more that 1000 kg of hazardous waste/month (Resource Conservation and Recovery Act (tracking hazardous waste)) TRI REPORTER (Tracking of toxic chemicals releasing facilities) Business SIC classification: PRINTED CIRCUIT BOARDS Business NAICS classification: BARE PRINTED CIRCUIT BOARD MANUFACTURING.; BARE PRINTED CIRCUIT BOARD MANUFACTURING.; BARE PRINTED CIRCUIT BOARD MANUFACTURING. Organizations: MULTEK INC (CONTACT/OPERATOR)
Alternative names: MULTEK, MULTILAYER TECHNOLOGY, INC. AKA MULTECH, MULTILAYER TECHNOLOGY, INC (MULTEK INC), MULTILAYER TECH. NOLOGY INC.
GENSIASICOR PHARMACEUTICALS (19-21 HUGHES in IRVINE, CA)
AIR MAJOR (AIRS/AFS) STATE MASTER (California - Hazardous Waste Tracking) - HAZARDOU WASTE PROGRAM CRITERIA AND HAZARDOUS AIR POLLUTANT INVENTORY (Inventory of air pollution sources) HAZARDOUS WASTE BIENNIAL REPORTER (Resource Conservation and Recovery Act (tracking hazardous waste)) Large Quantity Generators, more that 1000 kg of hazardous waste/month (Resource Conservation and Recovery Act (tracking hazardous waste)) Business SIC classification: PHARMACEUTICAL PREPARATIONS Business NAICS classification: PHARMACEUTICAL PREPARATION MANUFACTURING. Organizations: SICOR PHARMACEUTICALS, INC (CONTACT/OPERATOR)
, SICOR INC. (CONTACT/OWNER)
Alternative names: GENSIA LABS LTD, GENSIA SICOR PHARMACEUTICALS INC
FRANK R. BOWERMAN SANITARY LF (11002 BEE CANYON ACCESS ROAD in IRVINE, CA)
AIR MAJOR (AIRS/AFS) STATE MASTER (California Solid Waste disposal sites tracking) - REFUSE DISPOSAL CRITERIA AND HAZARDOUS AIR POLLUTANT INVENTORY (Inventory of air pollution sources) Small Quantity Generators, between 100 kg and 1000 kg of hazardous waste/month (Resource Conservation and Recovery Act (tracking hazardous waste)) REFUSE DISPOSAL (Solid waste facilities tracking) Business SIC classification: REFUSE SYSTEMS Business NAICS classification: SOLID WASTE LANDFILL. Organizations: COUNTY OF ORANGE INTEG WASTE MGT DEPT (CONTACT/OPERATOR)
Alternative names: ORANGE COUNTY BEE CYN LANDFILL, ORANGE COUNTY - IWMD - FRB
MULTILAYER TECHNOLOGY INC (40 PARKER in IRVINE, CA)
STATE MASTER (California - Hazardous Waste Tracking) - HAZARDOU WASTE PROGRAM Large Quantity Generators, more that 1000 kg of hazardous waste/month (Resource Conservation and Recovery Act (tracking hazardous waste)) TRI REPORTER (Tracking of toxic chemicals releasing facilities) Organizations: MULTEK INC (CONTACT/OPERATOR)
Alternative names: SONY TRANS COM INC.
NATIONAL SEMICONDUCTOR CO. (11 STUDEBAKER in IRVINE, CA)
STATE MASTER (California - Hazardous Waste Tracking) - HAZARDOU WASTE PROGRAM CRITERIA AND HAZARDOUS AIR POLLUTANT INVENTORY (Inventory of air pollution sources) Small Quantity Generators, between 100 kg and 1000 kg of hazardous waste/month (Resource Conservation and Recovery Act (tracking hazardous waste)) TRI REPORTER (Tracking of toxic chemicals releasing facilities) Business SIC classification: ELECTRONIC CONNECTORS Business NAICS classification: ELECTRONIC CONNECTOR MANUFACTURING. Organizations: NATIONAL SEMICONDUCTOR CORP (CONTACT/OPERATOR)
IRVINE MEDICAL CENTER (16200 SAND CANYON AVENUE in IRVINE, CA)
STATE MASTER (California - Hazardous Waste Tracking) - HAZARDOU WASTE PROGRAM CRITERIA AND HAZARDOUS AIR POLLUTANT INVENTORY (Inventory of air pollution sources) Small Quantity Generators, between 100 kg and 1000 kg of hazardous waste/month (Resource Conservation and Recovery Act (tracking hazardous waste)) - notification Business SIC classification: OFFICES AND CLINICS OF DOCTORS OF MEDICINE Organizations: AMI - IRVINE MEDICAL - CTR (CONTACT/OWNER)
Alternative names: IRVINE REGIONAL HOSPITAL & MEDICAL CTR
ADGRAPHICS (#4 WRIGLEY in IRVINE, CA)
STATE MASTER (California - Hazardous Waste Tracking) - HAZARDOU WASTE PROGRAM Small Quantity Generators, between 100 kg and 1000 kg of hazardous waste/month (Resource Conservation and Recovery Act (tracking hazardous waste)) Business NAICS classification: TRADEBINDING AND RELATED WORK.; PREPRESS SERVICES. Organizations: JIM MAJEWSKI (CONTACT/OPERATOR)
J HEWITT INC (6 FARADAY UNIT B in IRVINE, CA) . Federal Facility
STATE MASTER (California - Hazardous Waste Tracking) - HAZARDOU WASTE PROGRAM Small Quantity Generators, between 100 kg and 1000 kg of hazardous waste/month (Resource Conservation and Recovery Act (tracking hazardous waste)) - notification Business NAICS classification: SURGICAL AND MEDICAL INSTRUMENT MANUFACTURING. Organizations: JAMES D HEWITT (CONTACT/OWNER)
IRVINE MAZDA (11 AUTO CENTER DRIVE in IRVINE, CA)
STATE MASTER (California - Hazardous Waste Tracking) - HAZARDOU WASTE PROGRAM Small Quantity Generators, between 100 kg and 1000 kg of hazardous waste/month (Resource Conservation and Recovery Act (tracking hazardous waste)) - notification Organizations: JUSAK KERTO (CONTACT/OPERATOR)
, INDEMOBILE AMERICA INC (CONTACT/OWNER)
IRVINE NISSAN (30 AUTO CENTER DRIVE in IRVINE, CA)
STATE MASTER (California - Hazardous Waste Tracking) - HAZARDOU WASTE PROGRAM Small Quantity Generators, between 100 kg and 1000 kg of hazardous waste/month (Resource Conservation and Recovery Act (tracking hazardous waste)) - notification Organizations: AUTONATION (CONTACT/OWNER)
Alternative names: LEW WEBBS IRVINE TOYOTA, POWER NISSAN IRVINE
CHEVRON STATION NO 208060 (3921 IRVINE BOULEVARD in IRVINE, CA)
STATE MASTER (California - Hazardous Waste Tracking) - HAZARDOU WASTE PROGRAM Small Quantity Generators, between 100 kg and 1000 kg of hazardous waste/month (Resource Conservation and Recovery Act (tracking hazardous waste)) - notification Organizations: CHEVRON PRODUCTS CO (CONTACT/OWNER)
CHEVRON STATION NO 205222 (16221 LAKE FOREST DR in IRVINE, CA)
STATE MASTER (California - Hazardous Waste Tracking) - HAZARDOU WASTE PROGRAM Small Quantity Generators, between 100 kg and 1000 kg of hazardous waste/month (Resource Conservation and Recovery Act (tracking hazardous waste)) - notification Organizations: CHEVRON PRODUCTS CO (CONTACT/OWNER)
KAWASAKI MOTOR CORP (9950 JERONIMO RD in IRVINE, CA)
STATE MASTER (California - Hazardous Waste Tracking) - HAZARDOU WASTE PROGRAM Small Quantity Generators, between 100 kg and 1000 kg of hazardous waste/month (Resource Conservation and Recovery Act (tracking hazardous waste)) - notification
Housing units lacking complete plumbing facilities: 0.2% Housing units lacking complete kitchen facilities: 0.3%
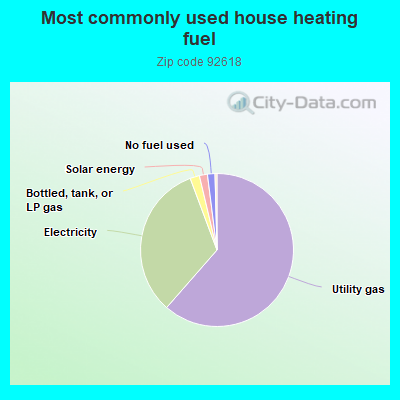
61.5%Utility gas
32.9%Electricity
2.0%Bottled, tank, or LP gas
1.7%Solar energy
1.6%No fuel used
Place of birth for U.S.-born residents:
This state: 23,512
Northeast: 2,479
Midwest: 2,526
South: 2,313
West: 1,840
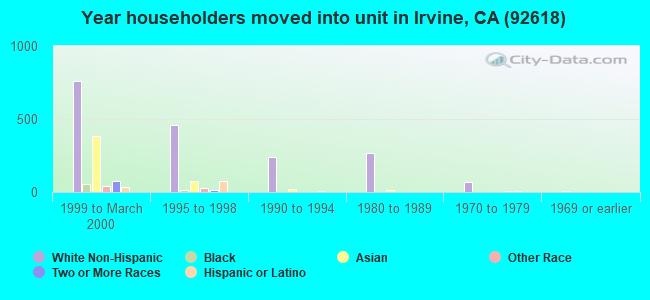
27% of the 92618 zip code residents lived in the same house 5 years ago. Out of people who lived in different houses, 54% lived in this county. Out of people who lived in different counties, 50% lived in California.
73% of the 92618 zip code residents lived in the same house 1 year ago. Out of people who lived in different houses, 50% moved from this county. Out of people who lived in different houses, 22% moved from different county within same state. Out of people who lived in different houses, 16% moved from different state. Out of people who lived in different houses, 10% moved from abroad.
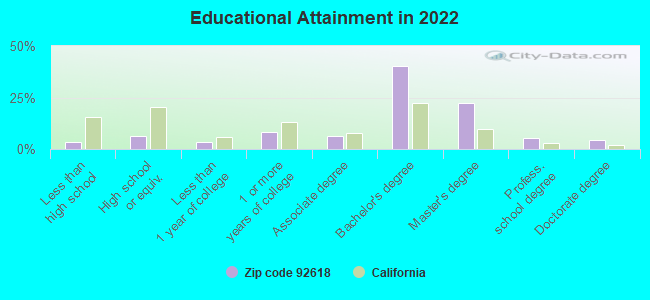
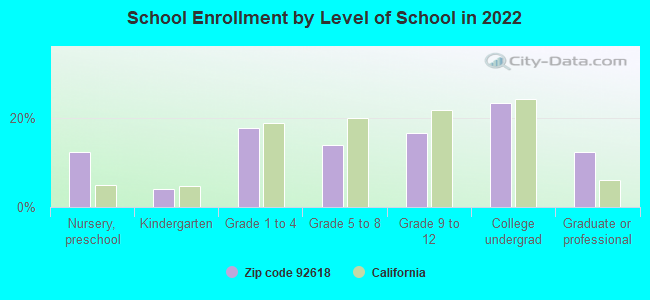
Private vs. public school enrollment:
Students in private schools in grades 1 to 8 (elementary and middle school): 564
Here:
10.7%
California:
10.5%
Students in private schools in grades 9 to 12 (high school): 584
Here:
21.2%
California:
8.5%
Students in private undergraduate colleges: 528
Here:
13.6%
California:
15.9%
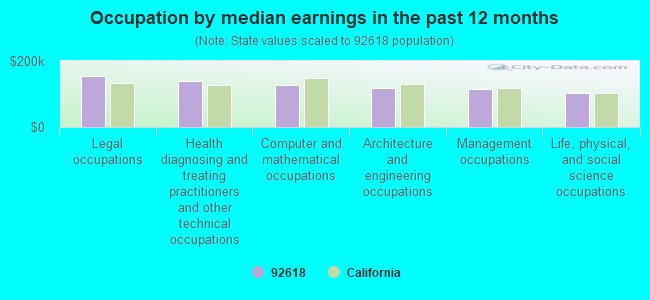
Occupation by median earnings in the past 12 months ($)
155,748Legal occupations
140,482Health diagnosing and treating practitioners and other technical occupations
127,641Computer and mathematical occupations
119,635Architecture and engineering occupations
116,614Management occupations
102,640Life, physical, and social science occupations
Companies with biggest federal contracts located in this zip code (IRVINE, CA):
PARKER HANNIFIN CUSTOMER SUPPO (14300 ALTON PARKWAY) : $808,816,031 in 5544 contractsfrom 1999 to 2006
Contracts for Power and Hand Pumps, Aircraft Hydraulic, Vacuum, and De-icing System Components, Hose, Pipe, Tube, Lubrication, and Railing Fittings, Miscellaneous Engine Accessories, Aircraft, and moreby Army, Air Force, Navy, Defense Logistics Agency, and others Signed by year:2000: $81,868,946; 2001: $104,259,728; 2002: $117,510,415; 2003: $170,803,335; 2004: $137,174,751; 2005: $129,386,684; 2006: $50,506,218.
Biggest contracts:
$28,776,700 with Army for Power and Hand Pumps. Signed on 2004-04-02. Completion date: 2008-09-30.
$27,446,774 with Army for Aircraft Hydraulic, Vacuum, and De-icing System Components. Signed on 2003-07-02. Completion date: 2008-09-30.
$26,216,265, same as above.Signed on 2003-11-24. Completion date: 2008-09-30.
$15,975,746, same as above.Signed on 2004-02-09. Completion date: 2008-09-30.
PARKER HANNIFIN CORPORATION (14300 ALTON PKWY) : $128,437,873 in 803 contractsfrom 2003 to 2006
Contracts for Aircraft Hydraulic, Vacuum, and De-icing System Components, Miscellaneous Engine Accessories, Aircraft, Power and Hand Pumps, Valves, Powered, and moreby Army, Air Force, Defense Logistics Agency, U.S. Coast Guard, and others Signed by year:2000: $0; 2001: $0; 2002: $0; 2003: $27,137,945; 2004: $53,412,420; 2005: $28,793,734; 2006: $19,093,774.
Biggest contracts:
$6,559,075 with Army for Aircraft Hydraulic, Vacuum, and De-icing System Components. Signed on 2006-04-07. Completion date: 2011-12-30.
$4,913,158 with Air Force for Aircraft Hydraulic, Vacuum, and De-icing System Components. Signed on 2004-09-28. Completion date: 2006-06-30.
$4,791,000 with Army for Miscellaneous Engine Accessories, Aircraft. Signed on 2005-03-30. Completion date: 2010-02-28.
$3,992,500, same as above.Signed on 2005-03-03. Completion date: 2010-02-28.
CRYSTALVIEW TECHNOLOGY CORP (15375 BARRANCA PKWY STE I1; small business) : $51,159,346 in 339 contractsfrom 1999 to 2006
Contracts for Other Professional Services, Other Administrative Support Services, Maintenance, Repair and Rebuilding of Equipment -- Miscellaneous, Other Management Support Services, and moreby Office of the Assistant Secretary for Administration and Management, Department of Veterans Affairs, Navy, ENERGY, Department of, and others Signed by year:2000: $3,766,076; 2001: $7,790,715; 2002: $8,572,399; 2003: $10,119,265; 2004: $13,288,383; 2005: $6,212,579; 2006: $1,023,375.
Biggest contracts:
$3,452,000 with Office of the Assistant Secretary for Administration and Management for Other Professional Services. Signed on 2002-10-15. Completion date: 2003-09-15.
$3,296,000, same as above.Signed on 2001-11-15. Completion date: 2002-09-15.
$3,200,000 with Department of Veterans Affairs for Other Administrative Support Services. Taking place in TX. Signed on 2005-02-06. Completion date: 2005-09-30.
$2,274,848 with Navy for Maintenance, Repair and Rebuilding of Equipment -- Miscellaneous. Signed on 2006-01-18. Completion date: 2006-11-30.
RACAL INSTRUMENTS INC (4 GOODYEAR) : $50,859,713 in 155 contractsfrom 1999 to 2006
Contracts for Electrical and Electronic Properties Measuring and Testing Instruments, Miscellaneous Communication Equipment, Batteries, Rechargeable, Electrical and Electronic assemblies, Boards, Cards, and Associated Hardware, and moreby Navy, Department of State, Air Force, Army, and others Signed by year:2000: $4,189,885; 2001: $4,547,712; 2002: $6,530,329; 2003: $18,723,627; 2004: $6,434,520; 2005: $8,569,843; 2006: $1,759,822.
Biggest contracts:
$8,794,273 with Navy for Electrical and Electronic Properties Measuring and Testing Instruments. Signed on 2003-07-09. Completion date: 2005-07-11.
$3,900,262 with Navy for Electrical and Electronic Properties Measuring and Testing Instruments. Taking place in TX. Signed on 2000-03-03. Completion date: 2001-09-03.
$3,854,996 with Navy for Miscellaneous Communication Equipment. Signed on 2004-12-01. Completion date: 2005-09-30.
$3,279,437 with Navy for Electrical and Electronic Properties Measuring and Testing Instruments. Taking place in TX. Signed on 2005-08-17. Completion date: 2007-08-10.
ORTIZ ENTERPRISES, INCORPORATE (6 CUSHING, SUITE 200; small business) : $37,121,295 in 88 contractsfrom 1999 to 2004
Contracts for Construction of Structures and Facilities -- Other Non-Building Facilities, Construction of Structures and Facilities -- Other Conservation and Development Facilities, Maintenance, Repair or Alteration of Real Property -- Miscellaneous Buildings, Construction of Structures and Facilities -- Restoration of real property, and moreby U.S. Army Corps of Engineers - civil program financing only, Army Signed by year:2000: $15,464,647; 2001: $15,942,733; 2002: $2,392,076; 2003: $960,529; 2004: $123,417; 2005: $0; 2006: $0.
Biggest contracts:
$6,317,500 with U.S. Army Corps of Engineers - civil program financing only for Construction of Structures and Facilities -- Other Non-Building Facilities. Signed on 2000-09-08. Completion date: 2000-09-13.
$4,000,000, same as above.Signed on 2000-06-07. Completion date: 2000-06-09.
$1,600,000 with U.S. Army Corps of Engineers - civil program financing only for Construction of Structures and Facilities -- Other Conservation and Development Facilities. Signed on 1999-12-03. Completion date: 2000-09-29.
$1,552,327 with U.S. Army Corps of Engineers - civil program financing only for Construction of Structures and Facilities -- Other Non-Building Facilities. Signed on 2001-11-29. Completion date: 2001-09-27.
PARKER HANNIFIN CORPORATION (14300 ALTON PARKWAY) : $31,618,981 in 138 contractsfrom 1999 to 2006
Contracts for Aircraft Hydraulic, Vacuum, and De-icing System Components, Power and Hand Pumps, Engine Fuel System Components, Aircraft and Missile Prime Movers, Automatic Pilot Mechanisms and Airborne Gyro Components, and moreby Army, Air Force, Navy, United States Coast Guard (disused code: now 7008), and others Signed by year:2000: $24,451,782; 2001: $1,313,853; 2002: $841,851; 2003: $1,225,114; 2004: $772,924; 2005: $185,802; 2006: $67,400.
Biggest contracts:
$18,595,500 with Army for Aircraft Hydraulic, Vacuum, and De-icing System Components. Signed on 2000-12-13. Completion date: 2006-10-14.
$2,363,310 with Air Force for Aircraft Hydraulic, Vacuum, and De-icing System Components. Signed on 1999-11-10. Completion date: 2000-03-31.
$2,298,700, same as above.Signed on 2000-05-01. Completion date: 2000-07-31.
$1,808,000, same as above.Signed on 2000-01-25. Completion date: 2002-01-31.
FRONTIER SYSTEMS INC A WHOLLY (LAKEVIEW PARK - IRVINE SPE) : $18,283,937 in 2 contractsin 2005
$18,183,059 with Navy for Defense Aircraft -- Advanced Development (R&D). Signed on 2005-09-23. Completion date: 2008-09-30.
$100,878, same as above.Signed on 2005-08-17. Completion date: 2005-11-17.
BOEING COMPANY, THE (15460 LAGUNA CANYON RD) : $16,263,469 in 7 contractsfrom 2003 to 2006
Contracts for Other ADP and Telecommunications Services (includes data storage on tapes, compact disks, etc.) by Air Force Signed by year:2000: $0; 2001: $0; 2002: $0; 2003: $4,681,972; 2004: $4,801,284; 2005: $6,791,836; 2006: -$11,623.
Biggest contracts:
$5,162,940 with Air Force for Other ADP and Telecommunications Services (includes data storage on tapes, compact disks, etc.). Signed on 2005-07-20. Completion date: 2006-08-31.
$4,801,284, same as above.Signed on 2004-08-19. Completion date: 2005-08-31.
$4,361,972, same as above.Signed on 2003-08-29. Completion date: 2008-08-31.
$1,476,996, same as above.Signed on 2005-08-26. Completion date: 2006-08-31.
QUEST SOFTWAREINC (8001 IRVINE CENTER DR) : $14,613,801 in 185 contractsfrom 2000 to 2006
Contracts for ADP Software, Other ADP and Telecommunications Services (includes data storage on tapes, compact disks, etc.), ADP Supplies, ADP Support Equipment, and moreby Army, Internal Revenue Service, Tennessee Valley Authority, Navy, and others Signed by year:2000: $720,000; 2001: $567,813; 2002: $929,396; 2003: $965,356; 2004: $1,327,070; 2005: $7,653,432; 2006: $2,450,734.
Biggest contracts:
$1,431,037 with Army for ADP Software. Signed on 2006-05-23. Completion date: 2006-12-31.
$1,237,726 with Internal Revenue Service for ADP Software. Taking place in WV. Signed on 2005-12-20. Effective on 2005-12-21. Completion date: 2006-09-30.
$1,086,764 with Army for Other ADP and Telecommunications Services (includes data storage on tapes, compact disks, etc.). Signed on 2005-03-24. Completion date: 2005-04-25.
$720,000 with Tennessee Valley Authority for ADP Supplies. Taking place in TN. Signed on 2000-03-15. Completion date: 2005-03-15.
PARKER HANNIFIN CORPORATION (14300 ALTON PKWY) : $12,105,475 in 52 contractsfrom 2002 to 2006
Contracts for Aircraft Hydraulic, Vacuum, and De-icing System Components, Miscellaneous Engine Accessories, Aircraft, Power and Hand Pumps, Engine Fuel System Components, Aircraft and Missile Prime Movers, and moreby Army Signed by year:2000: $0; 2001: $0; 2002: $10,971,016; 2003: $476,221; 2004: $314,337; 2005: $94,717; 2006: $249,184.
Biggest contracts:
$2,422,200 with Army for Aircraft Hydraulic, Vacuum, and De-icing System Components. Signed on 2002-10-25. Completion date: 2005-01-31.
$2,142,396, same as above.Signed on 2002-10-31. Completion date: 2004-06-30.
$1,700,000 with Army for Miscellaneous Engine Accessories, Aircraft. Signed on 2002-12-09. Completion date: 2007-09-30.
$951,549 with Army for Power and Hand Pumps. Taking place in MI. Signed on 2002-11-26. Completion date: 2005-09-30.
Top industries in this zip code by the number of employees in 2005:
Administrative and Support and Waste Management and Remediation Services: Temporary Help Services (250-499: 2, 100-249: 3, 50-99: 1, 20-49: 7, 10-19: 1, 1-4: 6)
People in group quarters in 2010:
526 people in local jails and other municipal confinement facilities
People in group quarters in 2000:
944 people in local jails and other confinement facilities (including police lockups)
Fatal accident statistics in 2014:
Fatal accident count: 4
Vehicles involved in fatal accidents: 5
Fatal accidents caused by drunken drivers: 0
Fatalities: 8
Persons involved in fatal accidents: 10
Pedestrians involved in fatal accidents: 1
Fatal accident statistics in 2013:
Fatal accident count: 2
Vehicles involved in fatal accidents: 3
Fatal accidents caused by drunken drivers: 1
Fatalities: 2
Persons involved in fatal accidents: 4
Pedestrians involved in fatal accidents: 0
Home Mortgage Disclosure Act Aggregated Statistics For Year 2009 (Based on 4 full and 16 partial tracts)
A) FHA, FSA/RHS & VA Home Purchase Loans
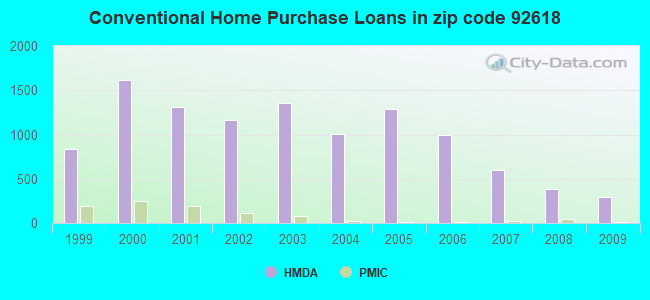
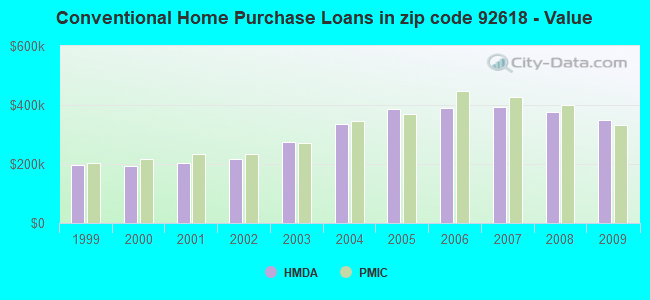
B) Conventional Home Purchase Loans
C) Refinancings
D) Home Improvement Loans
F) Non-occupant Loans on < 5 Family Dwellings (A B C & D)
G) Loans On Manufactured Home Dwelling (A B C & D)
Number
Average Value
Number
Average Value
Number
Average Value
Number
Average Value
Number
Average Value
Number
Average Value
LOANS ORIGINATED
109
$400,293
299
$349,721
1,109
$334,891
29
$228,900
106
$266,689
5
$68,900
APPLICATIONS APPROVED, NOT ACCEPTED
7
$401,544
39
$379,566
150
$353,828
5
$40,214
19
$264,621
4
$69,268
APPLICATIONS DENIED
22
$385,231
81
$325,739
311
$373,087
21
$123,164
55
$269,605
7
$43,936
APPLICATIONS WITHDRAWN
23
$404,474
62
$366,897
191
$331,892
9
$131,863
27
$314,869
0
$0
FILES CLOSED FOR INCOMPLETENESS
10
$372,568
12
$310,992
71
$365,165
1
$49,300
8
$313,776
0
$0
Aggregated Statistics For Year 2008 (Based on 4 full and 16 partial tracts)
A) FHA, FSA/RHS & VA Home Purchase Loans
B) Conventional Home Purchase Loans
C) Refinancings
D) Home Improvement Loans
F) Non-occupant Loans on < 5 Family Dwellings (A B C & D)
G) Loans On Manufactured Home Dwelling (A B C & D)
Number
Average Value
Number
Average Value
Number
Average Value
Number
Average Value
Number
Average Value
Number
Average Value
LOANS ORIGINATED
34
$401,803
379
$375,987
390
$354,590
39
$243,002
75
$259,949
8
$78,731
APPLICATIONS APPROVED, NOT ACCEPTED
5
$379,302
82
$420,714
100
$337,622
9
$138,928
26
$253,318
8
$95,259
APPLICATIONS DENIED
10
$350,262
112
$412,871
240
$390,622
28
$169,877
34
$333,975
10
$83,040
APPLICATIONS WITHDRAWN
13
$444,847
80
$385,015
147
$349,273
4
$94,470
24
$274,772
0
$0
FILES CLOSED FOR INCOMPLETENESS
0
$0
24
$492,938
43
$322,741
5
$257,184
17
$259,077
0
$0
Aggregated Statistics For Year 2007 (Based on 4 full and 16 partial tracts)
A) FHA, FSA/RHS & VA Home Purchase Loans
B) Conventional Home Purchase Loans
C) Refinancings
D) Home Improvement Loans
F) Non-occupant Loans on < 5 Family Dwellings (A B C & D)
G) Loans On Manufactured Home Dwelling (A B C & D)
Number
Average Value
Number
Average Value
Number
Average Value
Number
Average Value
Number
Average Value
Number
Average Value
LOANS ORIGINATED
0
$0
598
$391,669
802
$389,672
87
$252,217
132
$355,380
15
$69,905
APPLICATIONS APPROVED, NOT ACCEPTED
0
$0
159
$406,572
217
$405,527
22
$307,082
25
$348,293
11
$131,976
APPLICATIONS DENIED
1
$150,370
165
$395,269
428
$438,656
50
$257,116
51
$375,107
11
$118,353
APPLICATIONS WITHDRAWN
0
$0
86
$495,427
176
$434,091
23
$230,489
33
$359,217
0
$0
FILES CLOSED FOR INCOMPLETENESS
2
$294,880
23
$432,590
87
$397,949
9
$163,894
10
$448,340
0
$0
Aggregated Statistics For Year 2006 (Based on 4 full and 16 partial tracts)
B) Conventional Home Purchase Loans
C) Refinancings
D) Home Improvement Loans
F) Non-occupant Loans on < 5 Family Dwellings (A B C & D)
G) Loans On Manufactured Home Dwelling (A B C & D)
Number
Average Value
Number
Average Value
Number
Average Value
Number
Average Value
Number
Average Value
LOANS ORIGINATED
989
$391,217
1,026
$358,064
128
$233,728
175
$322,347
15
$65,900
APPLICATIONS APPROVED, NOT ACCEPTED
212
$419,125
217
$371,076
20
$256,757
46
$368,597
16
$79,799
APPLICATIONS DENIED
295
$415,398
489
$384,743
62
$256,000
59
$384,345
10
$98,898
APPLICATIONS WITHDRAWN
182
$396,980
447
$335,209
28
$234,660
48
$332,157
0
$0
FILES CLOSED FOR INCOMPLETENESS
40
$336,613
67
$408,795
5
$161,316
5
$369,930
0
$0
Aggregated Statistics For Year 2005 (Based on 4 full and 16 partial tracts)
A) FHA, FSA/RHS & VA Home Purchase Loans
B) Conventional Home Purchase Loans
C) Refinancings
D) Home Improvement Loans
E) Loans on Dwellings For 5+ Families
F) Non-occupant Loans on < 5 Family Dwellings (A B C & D)
G) Loans On Manufactured Home Dwelling (A B C & D)
Number
Average Value
Number
Average Value
Number
Average Value
Number
Average Value
Number
Average Value
Number
Average Value
Number
Average Value
LOANS ORIGINATED
0
$0
1,292
$387,013
1,352
$344,033
135
$260,475
1
$1,405,360
221
$318,717
14
$134,040
APPLICATIONS APPROVED, NOT ACCEPTED
0
$0
219
$400,430
253
$357,696
18
$264,590
0
$0
40
$360,558
18
$82,539
APPLICATIONS DENIED
0
$0
333
$373,649
452
$381,869
86
$180,513
0
$0
63
$351,020
13
$121,988
APPLICATIONS WITHDRAWN
2
$319,400
256
$400,060
408
$340,800
65
$201,855
2
$999,600
40
$347,596
4
$101,198
FILES CLOSED FOR INCOMPLETENESS
0
$0
53
$403,778
112
$350,785
15
$208,838
0
$0
17
$398,864
1
$125,400
Aggregated Statistics For Year 2004 (Based on 4 full and 16 partial tracts)
A) FHA, FSA/RHS & VA Home Purchase Loans
B) Conventional Home Purchase Loans
C) Refinancings
D) Home Improvement Loans
F) Non-occupant Loans on < 5 Family Dwellings (A B C & D)
G) Loans On Manufactured Home Dwelling (A B C & D)
Number
Average Value
Number
Average Value
Number
Average Value
Number
Average Value
Number
Average Value
Number
Average Value
LOANS ORIGINATED
2
$301,935
1,001
$334,632
2,018
$308,211
181
$240,622
269
$261,862
5
$102,674
APPLICATIONS APPROVED, NOT ACCEPTED
0
$0
243
$345,008
316
$307,909
33
$261,435
35
$297,644
1
$71,320
APPLICATIONS DENIED
0
$0
285
$308,314
478
$312,843
97
$199,055
55
$273,785
3
$98,873
APPLICATIONS WITHDRAWN
4
$181,585
234
$318,470
418
$292,771
52
$176,698
39
$289,735
1
$61,340
FILES CLOSED FOR INCOMPLETENESS
0
$0
58
$322,143
102
$327,117
13
$219,540
4
$353,112
1
$55,280
Aggregated Statistics For Year 2003 (Based on 4 full and 16 partial tracts)
A) FHA, FSA/RHS & VA Home Purchase Loans
B) Conventional Home Purchase Loans
C) Refinancings
D) Home Improvement Loans
F) Non-occupant Loans on < 5 Family Dwellings (A B C & D)
Number
Average Value
Number
Average Value
Number
Average Value
Number
Average Value
Number
Average Value
LOANS ORIGINATED
44
$225,902
1,358
$276,130
4,614
$244,098
65
$99,946
392
$211,494
APPLICATIONS APPROVED, NOT ACCEPTED
0
$0
191
$273,022
638
$250,262
21
$105,500
54
$224,209
APPLICATIONS DENIED
2
$157,770
242
$251,266
694
$250,570
53
$64,828
58
$211,373
APPLICATIONS WITHDRAWN
5
$260,952
284
$263,386
744
$231,854
25
$79,146
52
$217,077
FILES CLOSED FOR INCOMPLETENESS
5
$242,856
66
$270,945
187
$275,491
4
$32,520
15
$244,957
Aggregated Statistics For Year 2002 (Based on 4 full and 10 partial tracts)
A) FHA, FSA/RHS & VA Home Purchase Loans
B) Conventional Home Purchase Loans
C) Refinancings
D) Home Improvement Loans
F) Non-occupant Loans on < 5 Family Dwellings (A B C & D)
Number
Average Value
Number
Average Value
Number
Average Value
Number
Average Value
Number
Average Value
LOANS ORIGINATED
75
$189,586
1,166
$216,949
3,108
$231,454
39
$56,806
278
$178,204
APPLICATIONS APPROVED, NOT ACCEPTED
7
$163,196
143
$248,413
470
$234,449
9
$30,509
40
$198,240
APPLICATIONS DENIED
3
$188,370
112
$202,544
445
$222,131
22
$73,959
23
$199,063
APPLICATIONS WITHDRAWN
4
$184,345
138
$224,072
524
$233,459
16
$48,933
23
$193,255
FILES CLOSED FOR INCOMPLETENESS
2
$196,355
45
$259,211
130
$241,925
1
$46,070
10
$204,426
Aggregated Statistics For Year 2001 (Based on 4 full and 10 partial tracts)
A) FHA, FSA/RHS & VA Home Purchase Loans
B) Conventional Home Purchase Loans
C) Refinancings
D) Home Improvement Loans
E) Loans on Dwellings For 5+ Families
F) Non-occupant Loans on < 5 Family Dwellings (A B C & D)
Number
Average Value
Number
Average Value
Number
Average Value
Number
Average Value
Number
Average Value
Number
Average Value
LOANS ORIGINATED
84
$184,778
1,314
$204,700
2,037
$200,291
54
$45,380
2
$314,305
169
$168,235
APPLICATIONS APPROVED, NOT ACCEPTED
3
$178,443
253
$248,974
299
$197,978
25
$70,215
0
$0
15
$165,109
APPLICATIONS DENIED
7
$193,794
190
$205,625
474
$192,193
40
$58,457
0
$0
36
$169,249
APPLICATIONS WITHDRAWN
8
$180,295
183
$236,494
384
$194,779
21
$44,015
0
$0
30
$192,800
FILES CLOSED FOR INCOMPLETENESS
1
$237,000
60
$225,184
110
$197,836
3
$30,287
0
$0
11
$211,528
Aggregated Statistics For Year 2000 (Based on 4 full and 10 partial tracts)
A) FHA, FSA/RHS & VA Home Purchase Loans
B) Conventional Home Purchase Loans
C) Refinancings
D) Home Improvement Loans
E) Loans on Dwellings For 5+ Families
F) Non-occupant Loans on < 5 Family Dwellings (A B C & D)
Number
Average Value
Number
Average Value
Number
Average Value
Number
Average Value
Number
Average Value
Number
Average Value
LOANS ORIGINATED
119
$157,933
1,616
$194,681
344
$155,251
94
$38,461
0
$0
75
$153,594
APPLICATIONS APPROVED, NOT ACCEPTED
12
$157,199
363
$237,178
83
$161,150
26
$29,862
0
$0
25
$208,907
APPLICATIONS DENIED
11
$139,497
355
$200,820
193
$118,867
47
$32,083
2
$108,345
15
$140,239
APPLICATIONS WITHDRAWN
13
$155,162
258
$199,068
95
$128,272
12
$39,044
0
$0
17
$147,145
FILES CLOSED FOR INCOMPLETENESS
2
$174,800
57
$219,366
42
$210,216
4
$36,858
0
$0
6
$134,000
Aggregated Statistics For Year 1999 (Based on 2 full and 7 partial tracts)
A) FHA, FSA/RHS & VA Home Purchase Loans
B) Conventional Home Purchase Loans
C) Refinancings
D) Home Improvement Loans
E) Loans on Dwellings For 5+ Families
F) Non-occupant Loans on < 5 Family Dwellings (A B C & D)
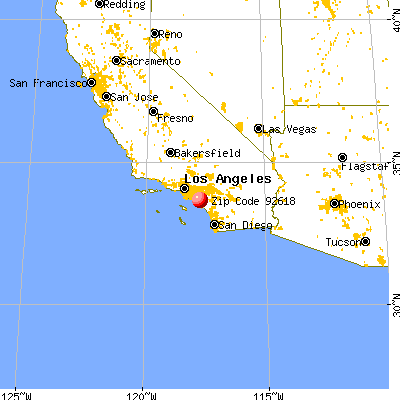


 Nearest zip codes: 92620, 92630, 92637, 92604, 92610, 92603.