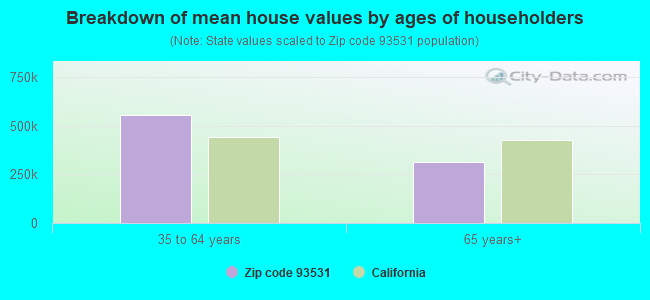
Estimated median house/condo value in 2022: $346,820
93531:
$346,820
California:
$715,900
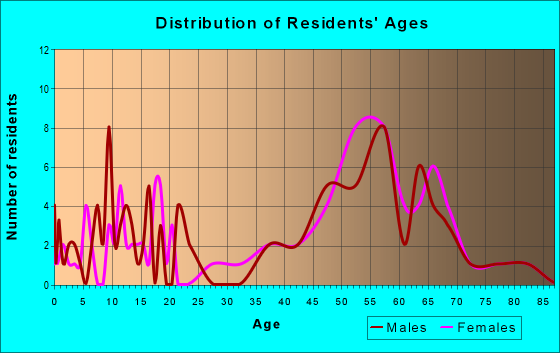
Median resident age:
This zip code:
58.4 years
California median age:
37.9 years
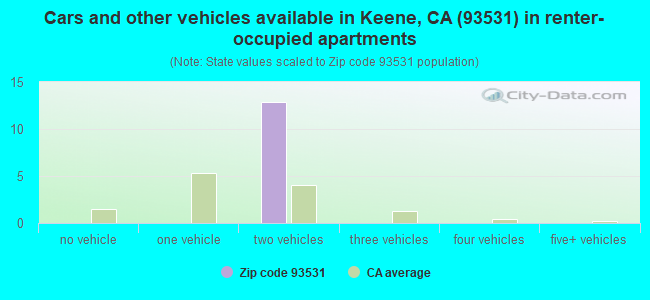
Average household size:
This zip code:
2.3 people
California:
2.8 people
Averages for the 2020 tax year for zip code 93531, filed in 2021:
Average Adjusted Gross Income (AGI) in 2020: $117,616 (Individual Income Tax Returns)
Here:
$117,616
State:
$95,910
Salary/wage: $110,376 (reported on 68.0% of returns)
Here:
$110,376
State:
$77,331
(% of AGI for various income ranges: 552.5% for AGIs below $25k, 5840.0% for AGIs $50k-75k, 7500.0% for AGIs $75k-100k, 11476.0% for AGIs $100k-200k)
Taxable interest for individuals: $914 (reported on 56.0% of returns)
This zip code:
$914
California:
$2,294
(% of AGI for various income ranges: 85.0% for AGIs $75k-100k, 152.0% for AGIs $100k-200k)
Ordinary dividends: $3,917 (reported on 24.0% of returns)
Here:
$3,917
State:
$10,949
(% of AGI for various income ranges: 326.0% for AGIs $100k-200k)
Net capital gain/loss in AGI: +$12,483 (reported on 24.0% of returns)
Here:
+$12,483
State:
+$49,306
(% of AGI for various income ranges: 107.5% for AGIs below $25k, 1412.0% for AGIs $100k-200k)
Profit/loss from business: +$2,600 (reported on 20.0% of returns)
Here:
+$2,600
State:
+$15,671
(% of AGI for various income ranges: 662.5% for AGIs below $25k)
Taxable individual retirement arrangement distribution: $35,833 (reported on 12.0% of returns)
93531:
$35,833
California:
$23,505
(% of AGI for various income ranges: 2150.0% for AGIs $100k-200k)
Total itemized deductions: $30,800 (reported on 28.0% of returns)
Here:
$30,800
State:
$39,517
(% of AGI for various income ranges: 2474.0% for AGIs $100k-200k)
Charity contributions: $9,700 (reported on 20.0% of returns)
Here:
$9,700
State:
$12,598
(% of AGI for various income ranges: 1125.0% for AGIs $75k-100k)
Taxes paid: $8,643 (reported on 28.0% of returns)
93531:
$8,643
State:
$8,807
(% of AGI for various income ranges: 720.0% for AGIs $100k-200k)
Percentage of individuals using paid preparers for their 2020 taxes: 96.0%
Here:
96%
State:
92%
(% for various income ranges: 100.0% for AGIs below $25k, 75.0% for AGIs $25k-50k, 100.0% for AGIs $50k-75k, 100.0% for AGIs $75k-100k, 100.0% for AGIs $100k-200k, 100.0% for AGIs over 200k)
Averages for the 2012 tax year for zip code 93531, filed in 2013:
Average Adjusted Gross Income (AGI) in 2012: $107,256 (Individual Income Tax Returns)
Here:
$107,256
State:
$72,726
Salary/wage: $76,061 (reported on 72.0% of returns)
Here:
$76,061
State:
$59,079
(% of AGI for various income ranges: 59.9% for AGIs below $25k, 57.1% for AGIs $25k-50k, 51.2% for AGIs $50k-75k, 63.4% for AGIs $75k-100k, 57.6% for AGIs $100k-200k, 42.5% for AGIs over 200k)
Taxable interest for individuals: $769 (reported on 52.0% of returns)
This zip code:
$769
California:
$2,146
(% of AGI for various income ranges: 1.6% for AGIs below $25k, 1.6% for AGIs $50k-75k, 0.3% for AGIs $100k-200k, 0.3% for AGIs over 200k)
Ordinary dividends: $3,200 (reported on 28.0% of returns)
Here:
$3,200
State:
$9,308
Net capital gain/loss in AGI: +$7,883 (reported on 24.0% of returns)
Here:
+$7,883
State:
+$30,460
Profit/loss from business: +$21,900 (reported on 20.0% of returns)
Here:
+$21,900
State:
+$17,064
Taxable individual retirement arrangement distribution: $22,500 (reported on 12.0% of returns)
93531:
$22,500
California:
$19,557
Total itemized deductions: $41,231 (23% of AGI, reported on 52.0% of returns)
Here:
$41,231
State:
$34,004
Here:
23.3% of AGI
State:
22.7% of AGI
(% of AGI for various income ranges: 53.0% for AGIs $25k-50k, 21.4% for AGIs $75k-100k, 21.5% for AGIs $100k-200k, 18.8% for AGIs over 200k)
Charity contributions: $6,054 (reported on 52.0% of returns)
Here:
$6,054
State:
$4,659
(% of AGI for various income ranges: 5.1% for AGIs $25k-50k, 3.2% for AGIs $75k-100k, 2.8% for AGIs $100k-200k, 3.3% for AGIs over 200k)
Taxes paid: $16,421 (reported on 56.0% of returns)
93531:
$16,421
State:
$14,448
(% of AGI for various income ranges: 12.8% for AGIs $25k-50k, 6.9% for AGIs $75k-100k, 8.2% for AGIs $100k-200k, 10.6% for AGIs over 200k)
Percentage of individuals using paid preparers for their 2012 taxes: 68.0%
Here:
68%
State:
64%
(% for various income ranges: 66.7% for AGIs below $25k, 75.0% for AGIs $25k-50k, 66.7% for AGIs $50k-75k, 66.7% for AGIs $75k-100k, 66.7% for AGIs $100k-200k, 66.7% for AGIs over 200k)
Averages for the 2004 tax year for zip code 93531, filed in 2005:
Average Adjusted Gross Income (AGI) in 2004: $78,916 (Individual Income Tax Returns)
Here:
$78,916
State:
$58,600
Salary/wage: $61,667 (reported on 83.5% of returns)
Here:
$61,667
State:
$49,455
(% of AGI for various income ranges: 163.4% for AGIs below $10k, 64.3% for AGIs $10k-25k, 67.7% for AGIs $25k-50k, 84.5% for AGIs $50k-75k, 76.4% for AGIs $75k-100k, 58.4% for AGIs over 100k)
Taxable interest for individuals: $2,611 (reported on 62.9% of returns)
This zip code:
$2,611
California:
$2,365
(% of AGI for various income ranges: 7.1% for AGIs below $10k, 0.4% for AGIs $25k-50k, 1.0% for AGIs $50k-75k, 2.2% for AGIs $75k-100k, 2.5% for AGIs over 100k)
Taxable dividends: $1,612 (reported on 28.3% of returns)
Here:
$1,612
State:
$4,746
(% of AGI for various income ranges: 1.2% for AGIs $10k-25k, 0.6% for AGIs $50k-75k, 0.8% for AGIs over 100k)
Net capital gain/loss: +$6,543 (reported on 29.5% of returns)
Here:
+$6,543
State:
+$23,418
Profit/loss from business: +$1,583 (reported on 20.3% of returns)
Here:
+$1,583
State:
+$16,826
(% of AGI for various income ranges: 6.4% for AGIs $10k-25k, 2.1% for AGIs $50k-75k, -0.0% for AGIs over 100k)
Total itemized deductions: $26,819 (23% of AGI, reported on 58.2% of returns)
Here:
$26,819
State:
$28,113
Here:
22.8% of AGI
State:
25.3% of AGI
(% of AGI for various income ranges: 26.2% for AGIs $25k-50k, 24.8% for AGIs $50k-75k, 21.7% for AGIs $75k-100k, 18.7% for AGIs over 100k)
Charity contributions deductions: $4,299 (4% of AGI, reported on 53.6% of returns)
Here:
$4,299
State:
$3,923
Here:
3.5% of AGI
State:
3.3% of AGI
(% of AGI for various income ranges: 3.1% for AGIs $25k-50k, 2.6% for AGIs $50k-75k, 2.9% for AGIs $75k-100k, 3.1% for AGIs over 100k)
Total tax: $13,206 (reported on 84.0% of returns)
93531:
$13,206
State:
$10,761
(% of AGI for various income ranges: 3.6% for AGIs below $10k, 4.2% for AGIs $10k-25k, 7.6% for AGIs $25k-50k, 8.8% for AGIs $50k-75k, 10.6% for AGIs $75k-100k, 17.2% for AGIs over 100k)
Percentage of individuals using paid preparers for their 2004 taxes: 69.2%
Here:
69%
State:
66%
(% for various income ranges: 63.6% for AGIs below $10k, 62.9% for AGIs $10k-25k, 64.4% for AGIs $25k-50k, 72.7% for AGIs $50k-75k, 82.1% for AGIs $75k-100k, 71.4% for AGIs over 100k)
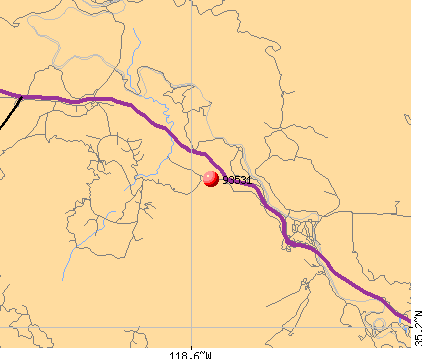
Notable locations in zip code 93531: The Loop (A), Crofton Ranch (B), Stonybrook Retreat (C), Kern County Fire Department Station 11 Keene (D). Display/hide their locations on the map
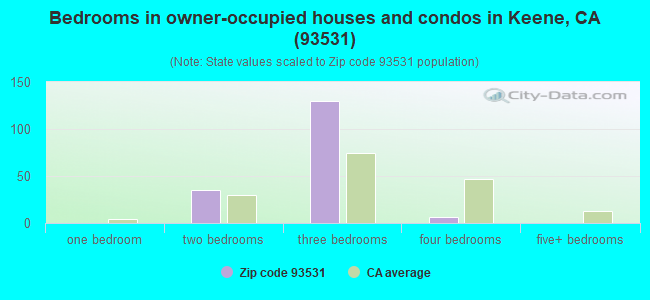
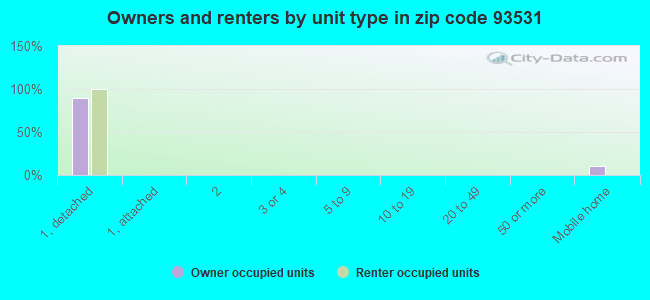
Size of family households: 84 2-persons, 32 3-persons, 21 4-persons
Size of nonfamily households: 29 1-person, 19 2-persons
41 married couples with children.
0 single-parent households ().
87.7% of residents of 93531 zip code speak English at home.
12.3% of residents speak Spanish at home (56% well, 44% not well).
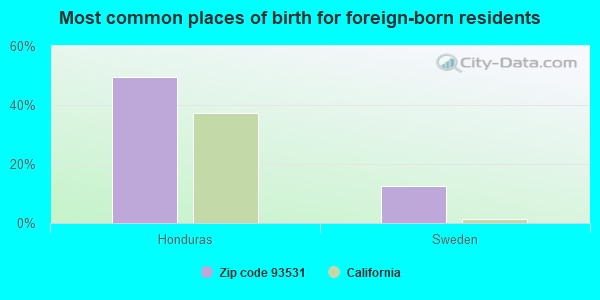
Foreign born population: 80 (19.1%) (100.0% of them are naturalized citizens)
This zip code:
19.1%
Whole state:
26.7%
49%Honduras
13%Sweden
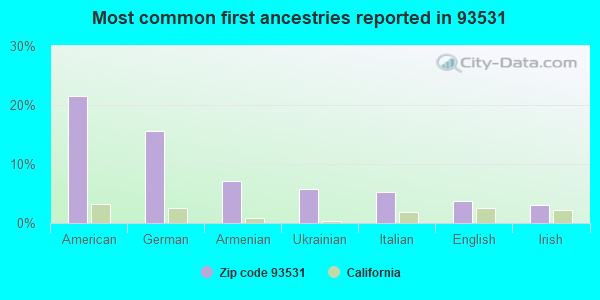
21%American
16%German
7%Armenian
6%Ukrainian
5%Italian
4%English
3%Irish
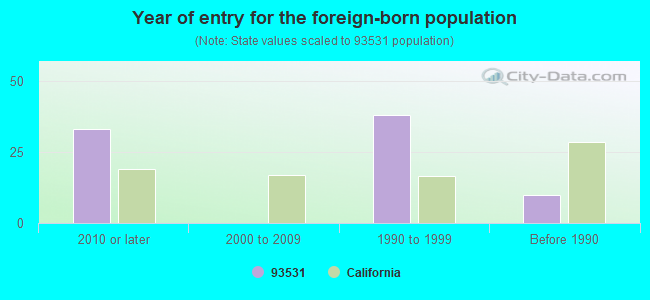
Year of entry for the foreign-born population
332010 or later
02000 to 2009
381990 to 1999
10Before 1990
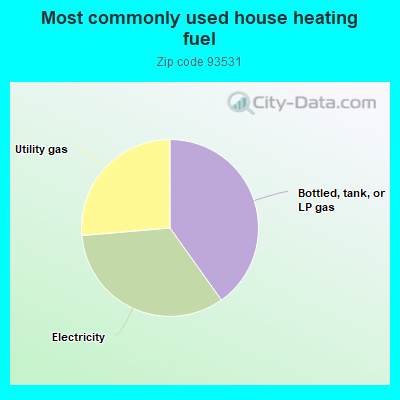
40.4%Bottled, tank, or LP gas
33.7%Electricity
26.5%Utility gas
Population in 1990: 455. Population change in the 1990s: +980 (+215.4%).
Place of birth for U.S.-born residents:
This state: 256
Midwest: 63
South: 8
West: 10
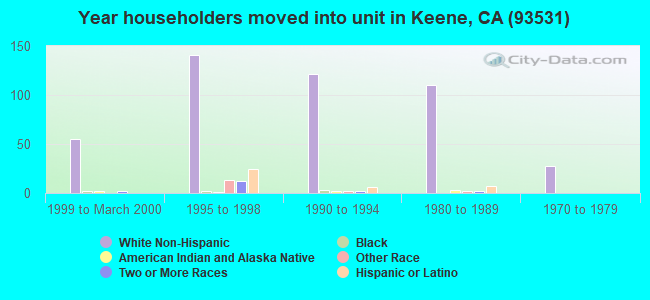
56% of the 93531 zip code residents lived in the same house 5 years ago. Out of people who lived in different houses, 57% lived in this county. Out of people who lived in different counties, 50% lived in California.
101% of the 93531 zip code residents lived in the same house 1 year ago.
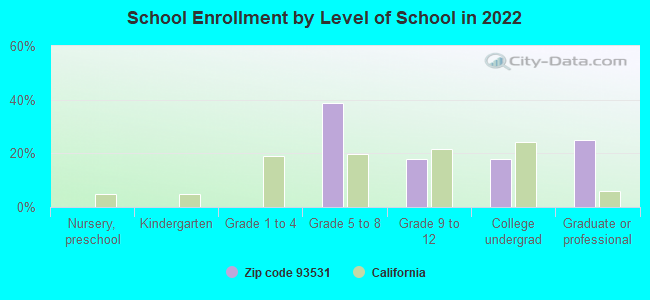
Private vs. public school enrollment:
Students in private schools in grades 1 to 8 (elementary and middle school):
Here:
0.0%
California:
10.5%
Students in private schools in grades 9 to 12 (high school):
Here:
0.0%
California:
8.5%
Students in private undergraduate colleges: 14
Here:
100.0%
California:
15.9%
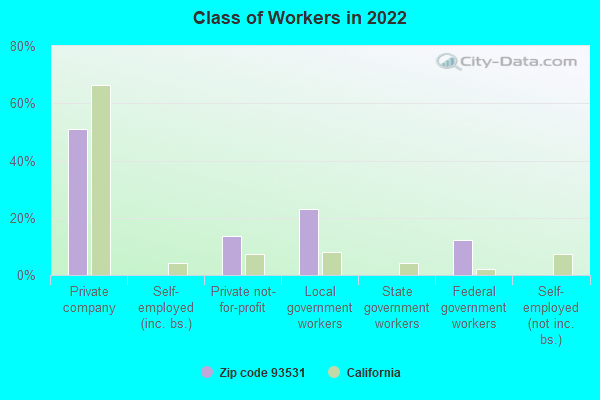
Top industries in this zip code by the number of employees in 2005:
Real Estate and Rental and Leasing: Lessors of Residential Buildings and Dwellings (100-249 employees: 1 establishment)
Other Services (except Public Administration): Labor Unions and Similar Labor Organizations (50-99: 1)
Professional, Scientific, and Technical Services: All Other Legal Services (20-49: 1)
Real Estate and Rental and Leasing: Residential Property Managers (10-19: 1)
Finance and Insurance: Third Party Administration of Insurance and Pension Funds (10-19: 1)
Professional, Scientific, and Technical Services: Offices of Lawyers (5-9: 1)
Construction: Plumbing, Heating, and Air-Conditioning Contractors (1-4: 1)
Construction: Site Preparation Contractors (1-4: 1)
Other Services (except Public Administration): Beauty Salons (1-4: 1)
Fatal accident statistics in 2014:
Fatal accident count: 1
Vehicles involved in fatal accidents: 2
Fatal accidents caused by drunken drivers: 1
Fatalities: 1
Persons involved in fatal accidents: 2
Pedestrians involved in fatal accidents: 0
Home Mortgage Disclosure Act Aggregated Statistics For Year 2009 (Based on 2 partial tracts)
A) FHA, FSA/RHS & VA Home Purchase Loans
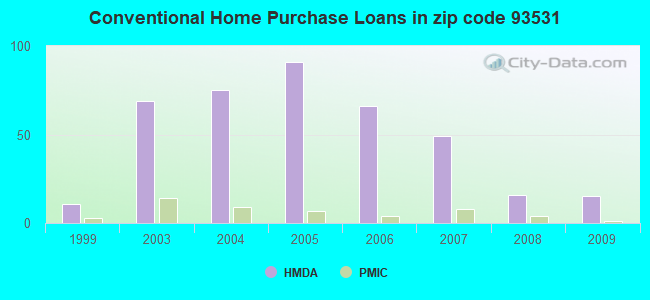
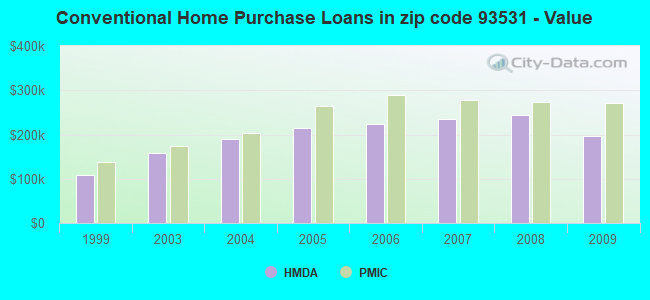
B) Conventional Home Purchase Loans
C) Refinancings
D) Home Improvement Loans
F) Non-occupant Loans on < 5 Family Dwellings (A B C & D)
G) Loans On Manufactured Home Dwelling (A B C & D)
Number
Average Value
Number
Average Value
Number
Average Value
Number
Average Value
Number
Average Value
Number
Average Value
LOANS ORIGINATED
17
$207,624
15
$196,167
59
$212,025
1
$178,190
9
$193,577
3
$140,770
APPLICATIONS APPROVED, NOT ACCEPTED
0
$0
1
$308,310
7
$262,696
0
$0
1
$266,600
0
$0
APPLICATIONS DENIED
2
$264,640
3
$255,050
28
$244,450
2
$106,020
4
$152,868
2
$155,440
APPLICATIONS WITHDRAWN
1
$233,160
3
$192,900
14
$238,246
1
$191,320
2
$171,010
1
$162,750
FILES CLOSED FOR INCOMPLETENESS
0
$0
1
$107,510
4
$263,352
1
$28,980
0
$0
0
$0
Aggregated Statistics For Year 2008 (Based on 2 partial tracts)
A) FHA, FSA/RHS & VA Home Purchase Loans
B) Conventional Home Purchase Loans
C) Refinancings
D) Home Improvement Loans
F) Non-occupant Loans on < 5 Family Dwellings (A B C & D)
G) Loans On Manufactured Home Dwelling (A B C & D)
Number
Average Value
Number
Average Value
Number
Average Value
Number
Average Value
Number
Average Value
Number
Average Value
LOANS ORIGINATED
9
$265,746
16
$242,992
40
$226,589
4
$113,128
7
$227,994
3
$173,583
APPLICATIONS APPROVED, NOT ACCEPTED
1
$172,360
5
$264,896
6
$242,682
1
$70,410
2
$163,700
1
$110,890
APPLICATIONS DENIED
2
$209,395
6
$305,192
31
$264,475
3
$114,910
5
$218,834
1
$282,850
APPLICATIONS WITHDRAWN
1
$290,570
5
$198,848
13
$224,598
1
$210,680
3
$151,060
1
$83,410
FILES CLOSED FOR INCOMPLETENESS
0
$0
1
$280,410
3
$240,063
0
$0
0
$0
0
$0
Aggregated Statistics For Year 2007 (Based on 2 partial tracts)
A) FHA, FSA/RHS & VA Home Purchase Loans
B) Conventional Home Purchase Loans
C) Refinancings
D) Home Improvement Loans
F) Non-occupant Loans on < 5 Family Dwellings (A B C & D)
G) Loans On Manufactured Home Dwelling (A B C & D)
Number
Average Value
Number
Average Value
Number
Average Value
Number
Average Value
Number
Average Value
Number
Average Value
LOANS ORIGINATED
3
$222,373
49
$235,206
73
$238,015
13
$130,672
15
$244,569
5
$144,444
APPLICATIONS APPROVED, NOT ACCEPTED
0
$0
9
$244,833
15
$266,756
4
$133,302
2
$331,935
1
$240,880
APPLICATIONS DENIED
1
$124,570
12
$274,975
40
$290,555
9
$137,852
5
$297,744
6
$180,285
APPLICATIONS WITHDRAWN
1
$336,330
18
$235,069
22
$242,095
2
$221,310
3
$266,333
1
$347,710
FILES CLOSED FOR INCOMPLETENESS
0
$0
2
$219,350
9
$252,822
1
$99,520
1
$127,280
0
$0
Aggregated Statistics For Year 2006 (Based on 2 partial tracts)
A) FHA, FSA/RHS & VA Home Purchase Loans
B) Conventional Home Purchase Loans
C) Refinancings
D) Home Improvement Loans
F) Non-occupant Loans on < 5 Family Dwellings (A B C & D)
G) Loans On Manufactured Home Dwelling (A B C & D)
Number
Average Value
Number
Average Value
Number
Average Value
Number
Average Value
Number
Average Value
Number
Average Value
LOANS ORIGINATED
2
$207,840
66
$224,510
95
$239,929
18
$142,742
20
$212,402
7
$157,257
APPLICATIONS APPROVED, NOT ACCEPTED
0
$0
11
$263,304
15
$275,711
2
$217,115
3
$236,093
1
$164,240
APPLICATIONS DENIED
0
$0
20
$250,646
41
$253,782
6
$145,962
6
$217,475
4
$153,272
APPLICATIONS WITHDRAWN
1
$151,920
17
$236,472
40
$256,180
3
$160,763
3
$269,763
1
$245,340
FILES CLOSED FOR INCOMPLETENESS
0
$0
2
$276,285
7
$235,403
1
$158,150
0
$0
0
$0
Aggregated Statistics For Year 2005 (Based on 2 partial tracts)
A) FHA, FSA/RHS & VA Home Purchase Loans
B) Conventional Home Purchase Loans
C) Refinancings
D) Home Improvement Loans
F) Non-occupant Loans on < 5 Family Dwellings (A B C & D)
G) Loans On Manufactured Home Dwelling (A B C & D)
Number
Average Value
Number
Average Value
Number
Average Value
Number
Average Value
Number
Average Value
Number
Average Value
LOANS ORIGINATED
2
$252,250
91
$214,427
108
$221,270
21
$152,241
26
$202,277
6
$168,732
APPLICATIONS APPROVED, NOT ACCEPTED
0
$0
16
$186,734
12
$233,113
2
$70,340
3
$137,793
2
$118,205
APPLICATIONS DENIED
0
$0
22
$202,405
41
$237,908
8
$113,516
6
$229,842
5
$150,890
APPLICATIONS WITHDRAWN
1
$151,780
21
$187,116
43
$246,922
6
$197,165
6
$180,353
4
$159,028
FILES CLOSED FOR INCOMPLETENESS
0
$0
4
$197,175
9
$203,988
1
$62,420
1
$194,030
1
$140,950
Aggregated Statistics For Year 2004 (Based on 2 partial tracts)
A) FHA, FSA/RHS & VA Home Purchase Loans
B) Conventional Home Purchase Loans
C) Refinancings
D) Home Improvement Loans
F) Non-occupant Loans on < 5 Family Dwellings (A B C & D)
G) Loans On Manufactured Home Dwelling (A B C & D)
Number
Average Value
Number
Average Value
Number
Average Value
Number
Average Value
Number
Average Value
Number
Average Value
LOANS ORIGINATED
3
$137,703
75
$189,699
111
$177,719
19
$92,101
26
$161,069
6
$138,153
APPLICATIONS APPROVED, NOT ACCEPTED
0
$0
10
$175,668
18
$164,406
2
$100,600
3
$120,687
2
$127,275
APPLICATIONS DENIED
0
$0
13
$164,042
39
$172,788
7
$73,000
4
$158,080
4
$110,758
APPLICATIONS WITHDRAWN
0
$0
12
$174,779
43
$176,763
2
$137,160
4
$122,470
2
$117,390
FILES CLOSED FOR INCOMPLETENESS
0
$0
2
$188,610
10
$173,840
1
$86,790
1
$85,570
0
$0
Aggregated Statistics For Year 2003 (Based on 2 partial tracts)
A) FHA, FSA/RHS & VA Home Purchase Loans
B) Conventional Home Purchase Loans
C) Refinancings
D) Home Improvement Loans
F) Non-occupant Loans on < 5 Family Dwellings (A B C & D)
Number
Average Value
Number
Average Value
Number
Average Value
Number
Average Value
Number
Average Value
LOANS ORIGINATED
5
$142,224
69
$158,381
174
$143,477
9
$55,740
23
$134,299
APPLICATIONS APPROVED, NOT ACCEPTED
0
$0
7
$172,983
25
$139,419
1
$59,440
2
$174,870
APPLICATIONS DENIED
0
$0
9
$188,026
43
$146,893
5
$59,684
3
$95,320
APPLICATIONS WITHDRAWN
1
$103,990
9
$157,997
44
$148,217
2
$61,945
3
$114,863
FILES CLOSED FOR INCOMPLETENESS
0
$0
3
$207,073
8
$126,718
0
$0
0
$0
Aggregated Statistics For Year 1999 (Based on 1 partial tract)
A) FHA, FSA/RHS & VA Home Purchase Loans
B) Conventional Home Purchase Loans
C) Refinancings
D) Home Improvement Loans
F) Non-occupant Loans on < 5 Family Dwellings (A B C & D)
Detailed PMIC statistics for the following Tracts:0060.05
2005 - 2018 National Fire Incident Reporting System (NFIRS) incidents
Based on the data from the years 2005 - 2018 the average number of fire incidents per year is 16. The highest number of fire incidents - 37 took place in 2005, and the least - 0 in 2010. The data has a dropping trend.
When looking into fire subcategories, the most incidents belonged to: Mobile Property/Vehicle Fires (51.5%), and Outside Fires (43.7%).
Fire incident types reported to NFIRS in Zip Code 93531
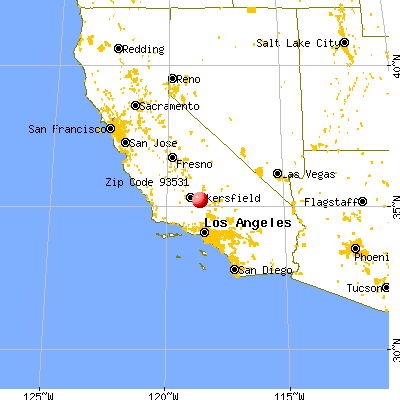


 Nearest zip codes: 93561, 93518, 93220, 93203, 93306, 93241.
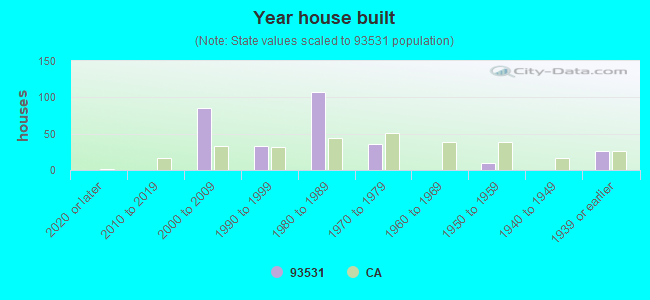


 Based on the data from the years 2005 - 2018 the average number of fire incidents per year is 16. The highest number of fire incidents - 37 took place in 2005, and the least - 0 in 2010. The data has a dropping trend.
 When looking into fire subcategories, the most incidents belonged to: Mobile Property/Vehicle Fires (51.5%), and Outside Fires (43.7%).