Estimated zip code population in 2022: 69,100 Zip code population in 2010: 69,333 Zip code population in 2000: 74,633
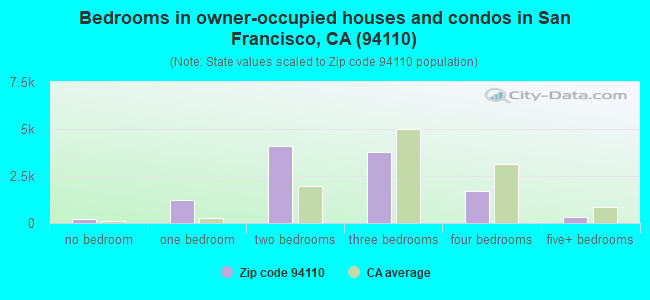
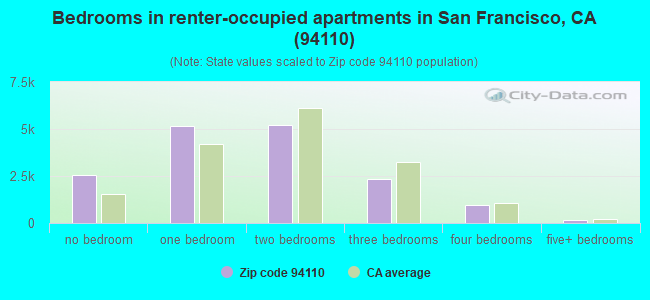
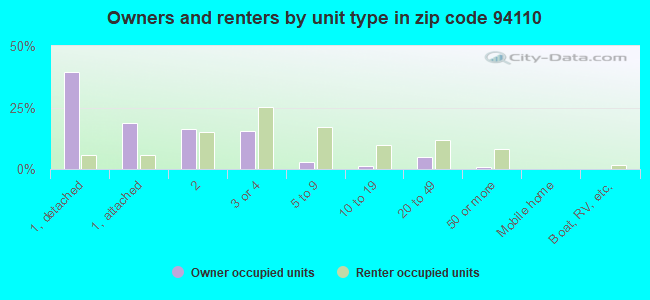
Houses and condos: 31,004 Renter-occupied apartments: 16,345
% of renters here:
59%
State:
44%
March 2022 cost of living index in zip code 94110: 131.1 (high, U.S. average is 100)
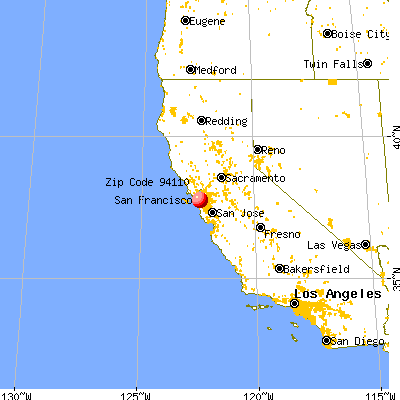
Land area: 2.3 sq. mi. Water area: 0.0 sq. mi.
Population density: 29,716 people per square mile
(very high).
OSM Map
General Map
Google Map
MSN Map
OSM Map
General Map
Google Map
MSN Map
OSM Map
General Map
Google Map
MSN Map
OSM Map
General Map
Google Map
MSN Map
Please wait while loading the map...
Real estate property taxes paid for housing units in 2022:
This zip code:
0.6% ($9,521)
California:
0.7% ($4,831)
Median real estate property taxes paid for housing units with mortgages in 2022: $10,330 (0.6%) Median real estate property taxes paid for housing units with no mortgage in 2022: $4,336 (0.3%)
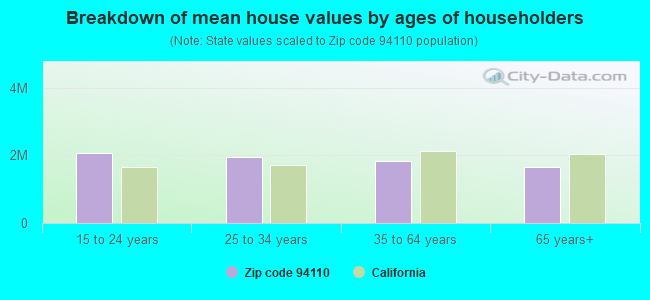
Estimated median house/condo value in 2022: $1,571,006
94110:
$1,571,006
California:
$715,900
According to our research of California and other state lists, there were 68 registered sex offenders living in 94110 zip code as of April 18, 2024. The ratio of all residents to sex offenders in zip code 94110 is 1,097 to 1. The ratio of registered sex offenders to all residents in this zip code is lower than the state average.
Median resident age:
This zip code:
39.6 years
California median age:
37.9 years
Average household size:
This zip code:
2.4 people
California:
2.8 people
Averages for the 2020 tax year for zip code 94110, filed in 2021:
Average Adjusted Gross Income (AGI) in 2020: $171,557 (Individual Income Tax Returns)
Here:
$171,557
State:
$95,910
Salary/wage: $153,823 (reported on 83.6% of returns)
Here:
$153,823
State:
$77,331
(% of AGI for various income ranges: 1255.0% for AGIs below $25k, 4197.7% for AGIs $25k-50k, 7462.3% for AGIs $50k-75k, 11001.4% for AGIs $75k-100k, 22402.6% for AGIs $100k-200k, 220973.9% for AGIs over 200k)
Taxable interest for individuals: $1,519 (reported on 40.4% of returns)
This zip code:
$1,519
California:
$2,294
(% of AGI for various income ranges: 20.9% for AGIs below $25k, 24.3% for AGIs $25k-50k, 45.2% for AGIs $50k-75k, 63.9% for AGIs $75k-100k, 111.2% for AGIs $100k-200k, 949.0% for AGIs over 200k)
Ordinary dividends: $8,314 (reported on 34.4% of returns)
Here:
$8,314
State:
$10,949
(% of AGI for various income ranges: 50.7% for AGIs below $25k, 57.2% for AGIs $25k-50k, 115.2% for AGIs $50k-75k, 198.9% for AGIs $75k-100k, 423.1% for AGIs $100k-200k, 5297.2% for AGIs over 200k)
Net capital gain/loss in AGI: +$68,779 (reported on 32.8% of returns)
Here:
+$68,779
State:
+$49,306
(% of AGI for various income ranges: 28.6% for AGIs below $25k, 68.7% for AGIs $25k-50k, 167.4% for AGIs $50k-75k, 211.8% for AGIs $75k-100k, 750.0% for AGIs $100k-200k, 53464.4% for AGIs over 200k)
Profit/loss from business: +$25,533 (reported on 19.8% of returns)
Here:
+$25,533
State:
+$15,671
(% of AGI for various income ranges: 305.3% for AGIs below $25k, 346.7% for AGIs $25k-50k, 443.2% for AGIs $50k-75k, 580.6% for AGIs $75k-100k, 1115.8% for AGIs $100k-200k, 6288.7% for AGIs over 200k)
Taxable individual retirement arrangement distribution: $16,581 (reported on 5.1% of returns)
94110:
$16,581
California:
$23,505
(% of AGI for various income ranges: 36.7% for AGIs below $25k, 58.9% for AGIs $25k-50k, 97.0% for AGIs $50k-75k, 155.5% for AGIs $75k-100k, 277.2% for AGIs $100k-200k, 763.0% for AGIs over 200k)
Self-employed (Keogh) retirement plans: $28,433 (reported on 2.2% of returns)
94110:
$28,433
California:
$30,163
(% of AGI for various income ranges: 18.3% for AGIs $25k-50k, 31.9% for AGIs $50k-75k, 39.9% for AGIs $75k-100k, 137.1% for AGIs $100k-200k, 1087.5% for AGIs over 200k)
Total itemized deductions: $39,545 (reported on 16.8% of returns)
Here:
$39,545
State:
$39,517
(% of AGI for various income ranges: 94.2% for AGIs below $25k, 156.6% for AGIs $25k-50k, 296.7% for AGIs $50k-75k, 576.1% for AGIs $75k-100k, 1260.6% for AGIs $100k-200k, 11420.8% for AGIs over 200k)
Charity contributions: $14,129 (reported on 13.6% of returns)
Here:
$14,129
State:
$12,598
(% of AGI for various income ranges: 3.8% for AGIs below $25k, 16.1% for AGIs $25k-50k, 34.4% for AGIs $50k-75k, 60.9% for AGIs $75k-100k, 173.2% for AGIs $100k-200k, 4169.1% for AGIs over 200k)
Taxes paid: $9,289 (reported on 16.8% of returns)
94110:
$9,289
State:
$8,807
(% of AGI for various income ranges: 20.7% for AGIs below $25k, 39.9% for AGIs $25k-50k, 83.4% for AGIs $50k-75k, 172.1% for AGIs $75k-100k, 418.6% for AGIs $100k-200k, 2315.7% for AGIs over 200k)
Earned income credit: $1,478 (reported on 7.7% of returns)
Here:
$1,478
State:
$2,074
(% of AGI for various income ranges: 61.4% for AGIs below $25k, 31.4% for AGIs $25k-50k, 0.5% for AGIs $50k-75k)
Percentage of individuals using paid preparers for their 2020 taxes: 92.7%
Here:
93%
State:
92%
(% for various income ranges: 88.7% for AGIs below $25k, 91.7% for AGIs $25k-50k, 92.3% for AGIs $50k-75k, 93.9% for AGIs $75k-100k, 94.4% for AGIs $100k-200k, 96.6% for AGIs over 200k)
Averages for the 2012 tax year for zip code 94110, filed in 2013:
Average Adjusted Gross Income (AGI) in 2012: $88,157 (Individual Income Tax Returns)
Here:
$88,157
State:
$72,726
Salary/wage: $76,793 (reported on 85.6% of returns)
Here:
$76,793
State:
$59,079
(% of AGI for various income ranges: 73.0% for AGIs below $25k, 84.5% for AGIs $25k-50k, 84.4% for AGIs $50k-75k, 84.6% for AGIs $75k-100k, 84.9% for AGIs $100k-200k, 63.3% for AGIs over 200k)
Taxable interest for individuals: $1,146 (reported on 36.3% of returns)
This zip code:
$1,146
California:
$2,146
(% of AGI for various income ranges: 0.8% for AGIs below $25k, 0.4% for AGIs $25k-50k, 0.5% for AGIs $50k-75k, 0.4% for AGIs $75k-100k, 0.4% for AGIs $100k-200k, 0.5% for AGIs over 200k)
Ordinary dividends: $6,438 (reported on 24.2% of returns)
Here:
$6,438
State:
$9,308
(% of AGI for various income ranges: 1.4% for AGIs below $25k, 1.1% for AGIs $25k-50k, 1.3% for AGIs $50k-75k, 1.3% for AGIs $75k-100k, 1.5% for AGIs $100k-200k, 2.3% for AGIs over 200k)
Net capital gain/loss in AGI: +$44,190 (reported on 20.9% of returns)
Here:
+$44,190
State:
+$30,460
(% of AGI for various income ranges: 0.2% for AGIs below $25k, 0.4% for AGIs $25k-50k, 0.4% for AGIs $50k-75k, 0.6% for AGIs $75k-100k, 1.6% for AGIs $100k-200k, 22.3% for AGIs over 200k)
Profit/loss from business: +$21,766 (reported on 21.7% of returns)
Here:
+$21,766
State:
+$17,064
(% of AGI for various income ranges: 16.0% for AGIs below $25k, 6.9% for AGIs $25k-50k, 6.5% for AGIs $50k-75k, 5.7% for AGIs $75k-100k, 5.1% for AGIs $100k-200k, 3.7% for AGIs over 200k)
Taxable individual retirement arrangement distribution: $15,790 (reported on 4.4% of returns)
94110:
$15,790
California:
$19,557
(% of AGI for various income ranges: 1.3% for AGIs below $25k, 0.8% for AGIs $25k-50k, 0.9% for AGIs $50k-75k, 1.2% for AGIs $75k-100k, 0.9% for AGIs $100k-200k, 0.5% for AGIs over 200k)
Self-employment retirement plans: $17,957 (reported on 2.1% of returns)
94110:
$17,957
California:
$24,530
(% of AGI for various income ranges: 0.1% for AGIs below $25k, 0.2% for AGIs $25k-50k, 0.4% for AGIs $50k-75k, 0.5% for AGIs $75k-100k, 0.5% for AGIs $100k-200k, 0.5% for AGIs over 200k)
Total itemized deductions: $33,504 (17% of AGI, reported on 33.5% of returns)
Here:
$33,504
State:
$34,004
Here:
17.3% of AGI
State:
22.7% of AGI
(% of AGI for various income ranges: 6.8% for AGIs below $25k, 5.4% for AGIs $25k-50k, 8.4% for AGIs $50k-75k, 12.7% for AGIs $75k-100k, 15.6% for AGIs $100k-200k, 14.6% for AGIs over 200k)
Charity contributions: $2,951 (reported on 24.6% of returns)
Here:
$2,951
State:
$4,659
(% of AGI for various income ranges: 0.3% for AGIs below $25k, 0.4% for AGIs $25k-50k, 0.6% for AGIs $50k-75k, 0.9% for AGIs $75k-100k, 0.9% for AGIs $100k-200k, 1.0% for AGIs over 200k)
Taxes paid: $19,826 (reported on 33.5% of returns)
94110:
$19,826
State:
$14,448
(% of AGI for various income ranges: 1.7% for AGIs below $25k, 1.4% for AGIs $25k-50k, 2.8% for AGIs $50k-75k, 6.0% for AGIs $75k-100k, 8.4% for AGIs $100k-200k, 10.4% for AGIs over 200k)
Earned income credit: $1,501 (reported on 11.0% of returns)
Here:
$1,501
State:
$2,286
(% of AGI for various income ranges: 3.1% for AGIs below $25k, 0.4% for AGIs $25k-50k)
Percentage of individuals using paid preparers for their 2012 taxes: 51.6%
Here:
52%
State:
64%
(% for various income ranges: 52.3% for AGIs below $25k, 50.8% for AGIs $25k-50k, 47.3% for AGIs $50k-75k, 46.5% for AGIs $75k-100k, 52.0% for AGIs $100k-200k, 65.3% for AGIs over 200k)
Averages for the 2004 tax year for zip code 94110, filed in 2005:
Average Adjusted Gross Income (AGI) in 2004: $49,383 (Individual Income Tax Returns)
Here:
$49,383
State:
$58,600
Salary/wage: $46,635 (reported on 85.8% of returns)
Here:
$46,635
State:
$49,455
(% of AGI for various income ranges: 147.4% for AGIs below $10k, 79.6% for AGIs $10k-25k, 88.0% for AGIs $25k-50k, 86.4% for AGIs $50k-75k, 86.3% for AGIs $75k-100k, 72.7% for AGIs over 100k)
Taxable interest for individuals: $1,197 (reported on 40.9% of returns)
This zip code:
$1,197
California:
$2,365
(% of AGI for various income ranges: 6.7% for AGIs below $10k, 1.3% for AGIs $10k-25k, 0.8% for AGIs $25k-50k, 0.7% for AGIs $50k-75k, 0.6% for AGIs $75k-100k, 1.1% for AGIs over 100k)
Taxable dividends: $2,987 (reported on 22.8% of returns)
Here:
$2,987
State:
$4,746
(% of AGI for various income ranges: 6.7% for AGIs below $10k, 1.1% for AGIs $10k-25k, 0.8% for AGIs $25k-50k, 1.0% for AGIs $50k-75k, 1.2% for AGIs $75k-100k, 1.9% for AGIs over 100k)
Net capital gain/loss: +$11,936 (reported on 19.1% of returns)
Here:
+$11,936
State:
+$23,418
(% of AGI for various income ranges: -0.1% for AGIs below $10k, 0.3% for AGIs $10k-25k, 0.4% for AGIs $25k-50k, 0.7% for AGIs $50k-75k, 1.4% for AGIs $75k-100k, 10.3% for AGIs over 100k)
Profit/loss from business: +$15,826 (reported on 20.4% of returns)
Here:
+$15,826
State:
+$16,826
(% of AGI for various income ranges: 17.5% for AGIs below $10k, 10.5% for AGIs $10k-25k, 5.6% for AGIs $25k-50k, 5.8% for AGIs $50k-75k, 6.4% for AGIs $75k-100k, 6.2% for AGIs over 100k)
IRA payment deduction: $2,799 (reported on 3.1% of returns)
94110:
$2,799
California:
$3,192
(% of AGI for various income ranges: 1.0% for AGIs below $10k, 0.3% for AGIs $10k-25k, 0.3% for AGIs $25k-50k, 0.1% for AGIs $50k-75k, 0.2% for AGIs $75k-100k, 0.1% for AGIs over 100k)
Self-employed pension: $12,483 (reported on 2.3% of returns)
Here:
$12,483
California:
$17,688
(% of AGI for various income ranges: 0.3% for AGIs below $10k, 0.3% for AGIs $10k-25k, 0.3% for AGIs $25k-50k, 0.5% for AGIs $50k-75k, 0.7% for AGIs $75k-100k, 0.8% for AGIs over 100k)
Total itemized deductions: $23,097 (22% of AGI, reported on 27.9% of returns)
Here:
$23,097
State:
$28,113
Here:
22.2% of AGI
State:
25.3% of AGI
(% of AGI for various income ranges: 24.3% for AGIs below $10k, 6.8% for AGIs $10k-25k, 7.4% for AGIs $25k-50k, 12.4% for AGIs $50k-75k, 16.6% for AGIs $75k-100k, 16.3% for AGIs over 100k)
Charity contributions deductions: $2,220 (2% of AGI, reported on 23.1% of returns)
Here:
$2,220
State:
$3,923
Here:
2.0% of AGI
State:
3.3% of AGI
(% of AGI for various income ranges: 0.8% for AGIs below $10k, 0.4% for AGIs $10k-25k, 0.6% for AGIs $25k-50k, 1.0% for AGIs $50k-75k, 1.2% for AGIs $75k-100k, 1.4% for AGIs over 100k)
Total tax: $8,541 (reported on 82.1% of returns)
94110:
$8,541
State:
$10,761
(% of AGI for various income ranges: 8.4% for AGIs below $10k, 5.7% for AGIs $10k-25k, 9.1% for AGIs $25k-50k, 12.7% for AGIs $50k-75k, 14.3% for AGIs $75k-100k, 19.3% for AGIs over 100k)
Earned income credit: $1,153 (reported on 12.1% of returns)
Here:
$1,153
State:
$1,763
Percentage of individuals using paid preparers for their 2004 taxes: 57.3%
Here:
57%
State:
66%
(% for various income ranges: 56.8% for AGIs below $10k, 60.7% for AGIs $10k-25k, 55.3% for AGIs $25k-50k, 53.5% for AGIs $50k-75k, 54.3% for AGIs $75k-100k, 63.0% for AGIs over 100k)
Likely homosexual households (counted as self-reported same-sex unmarried-partner households)
Lesbian couples: 0.4% of all households
Gay men: 1.9% of all households
Household received Food Stamps/SNAP in the past 12 months: 2,630 Household did not receive Food Stamps/SNAP in the past 12 months: 24,877
Women who had a birth in the past 12 months: 742 (585 now married, 155 unmarried) Women who did not have a birth in the past 12 months: 17,086 (6,071 now married, 11,043 unmarried)
Housing units in zip code 94110 with a mortgage: 8,075 (1,136 second mortgage, 11 home equity loan, 1,081 both second mortgage and home equity loan) Houses without a mortgage: 96
Median monthly owner costs for units with a mortgage: $3,876 Median monthly owner costs for units without a mortgage: $900
Residents with income below the poverty level in 2022:
This zip code:
10.2%
Whole state:
12.2%
Residents with income below 50% of the poverty level in 2022:
This zip code:
5.1%
Whole state:
6.2%
Median number of rooms in houses and condos:
Here:
5.4
State:
6.0
Median number of rooms in apartments:
Here:
3.7
State:
3.9
Notable locations in this zip code not listed on our city pages
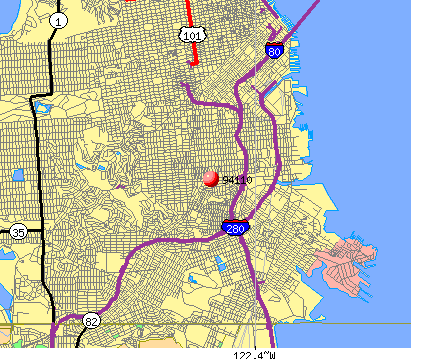
Notable locations in zip code 94110: Sixteenth Street Bay Area Rapid Transit Station (A), Twentyfourth Street Bay Area Rapid Transit Station (B), Bernal Branch Library (C), Mission Neighborhood Center (D), Mission Branch Library (E), Mission Police Station (F), San Francisco Fire Department Station 32 (G), San Francisco Fire Department Station 7 (H). Display/hide their locations on the map
Churches in zip code 94110 include: Ascension Lutheran Church (A), Holy Innocents Episcopal Church (B), Russian Orthodox Convent of Our Lady of Vladimir (C), Saint Johns Lutheran Church (D), Golden Gate Lutheran Church (E), Emanuel Baptist Church (F), Iglesia Sion (G), Mission Presbyterian Church (H), Pleasant Hill Baptist Church (I). Display/hide their locations on the map
Parks in zip code 94110 include: Bernal Park (1), Bernal Heights Park (2), Bernal Recreation Center (3), Coso Square (4), Folsom Playground (5), Garfield Square (6), Juri Commons (7), Mission Community Recreation Center (8), Mission Playground (9). Display/hide their locations on the map
6,923 married couples with children.
1,634 single-parent households (574 men, 1,060 women).
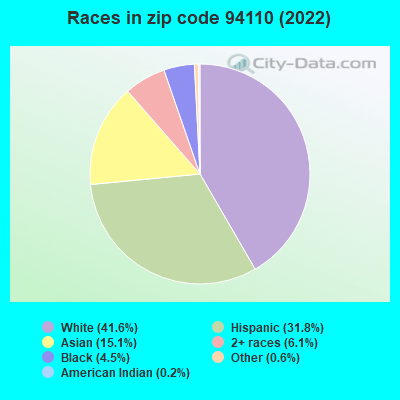
59.8% of residents of 94110 zip code speak English at home.
25.6% of residents speak Spanish at home (57% very well, 16% well, 18% not well, 9% not at all).
4.8% of residents speak other Indo-European language at home (92% very well, 4% well, 2% not well, 2% not at all).
8.8% of residents speak Asian or Pacific Island language at home (52% very well, 21% well, 15% not well, 13% not at all).
0.9% of residents speak other language at home (90% very well, 5% well, 5% not at all).
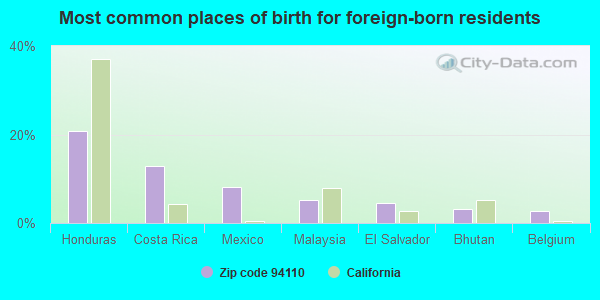
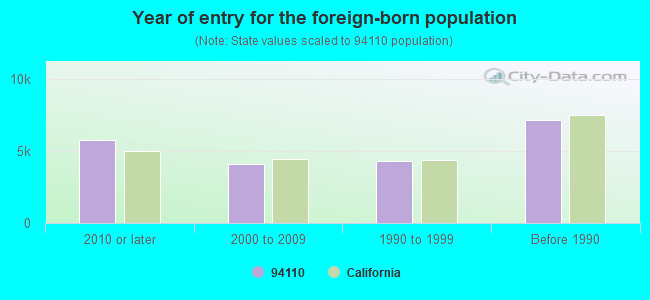
Foreign born population: 19,497 (28.2%) (48.8% of them are naturalized citizens)
Major facilities with environmental interests located in this zip code:
EQUILON ENTERPRISES (899 VALENCIA in SAN FRANCISCO, CA) . Federal Facility
AIR MINOR (AIRS/AFS) STATE MASTER (California - Hazardous Waste Tracking) - HAZARDOU WASTE PROGRAM Small Quantity Generators, between 100 kg and 1000 kg of hazardous waste/month (Resource Conservation and Recovery Act (tracking hazardous waste)) - notification Business SIC classification: GENERAL AUTOMOTIVE REPAIR SHOPS Organizations: EQUILON ENTERPRISES L L C (CONTACT/OWNER)
Alternative names: SHELL OIL CO, VALENCIA SHELL
FABRICARE II CLEANER (2345 MISSION ST in SAN FRANCISCO, CA)
STATE MASTER (California - Hazardous Waste Tracking) - HAZARDOU WASTE PROGRAM CRITERIA AND HAZARDOUS AIR POLLUTANT INVENTORY (Inventory of air pollution sources) Small Quantity Generators, between 100 kg and 1000 kg of hazardous waste/month (Resource Conservation and Recovery Act (tracking hazardous waste)) - notification Business SIC classification: DRYCLEANING PLANTS, EXCEPT RUG CLEANING Organizations: JACK KIM (CONTACT/OWNER)
GOLDEN STATE CLEANERS (3287 ARMY STREET in SAN FRANCISCO, CA)
STATE MASTER (California - Hazardous Waste Tracking) - HAZARDOU WASTE PROGRAM CRITERIA AND HAZARDOUS AIR POLLUTANT INVENTORY (Inventory of air pollution sources) Small Quantity Generators, between 100 kg and 1000 kg of hazardous waste/month (Resource Conservation and Recovery Act (tracking hazardous waste)) Business SIC classification: DRYCLEANING PLANTS, EXCEPT RUG CLEANING
EEMYE TRUCKING (2540 25TH ST in SAN FRANCISCO, CA)
STATE MASTER (California - Hazardous Waste Tracking) - HAZARDOU WASTE PROGRAM TRANSPORTER (Resource Conservation and Recovery Act (tracking hazardous waste)) Organizations: DWIGHT ERSKINE HAWKINS (CONTACT/OWNER)
EQUILON ENTERPRISES (400 GUERRERO in SAN FRANCISCO, CA) . Federal Facility
STATE MASTER (California - Hazardous Waste Tracking) - HAZARDOU WASTE PROGRAM Small Quantity Generators, between 100 kg and 1000 kg of hazardous waste/month (Resource Conservation and Recovery Act (tracking hazardous waste)) - notification Organizations: EQUILON ENTERPRISES L L C (CONTACT/OWNER)
Alternative names: SHELL OIL CO
EQUILON ENTERPRISES (3550 MISSION in SAN FRANCISCO, CA) . Federal Facility
STATE MASTER (California - Hazardous Waste Tracking) - HAZARDOU WASTE PROGRAM Small Quantity Generators, between 100 kg and 1000 kg of hazardous waste/month (Resource Conservation and Recovery Act (tracking hazardous waste)) - notification Organizations: EQUILON ENTERPRISES L L C (CONTACT/OWNER)
Alternative names: SHELL OIL CO
EQUILON ENTERPRISES (793 S VAN NESS in SAN FRANCISCO, CA) . Federal Facility
STATE MASTER (California - Hazardous Waste Tracking) - HAZARDOU WASTE PROGRAM Small Quantity Generators, between 100 kg and 1000 kg of hazardous waste/month (Resource Conservation and Recovery Act (tracking hazardous waste)) - notification Organizations: EQUILON ENTERPRISES, LLC (CONTACT/OWNER)
Alternative names: SHELL OIL CO
CHEVRON STATION 90142 (1198 VALENCIA ST in SAN FRANCISCO, CA)
STATE MASTER (California - Hazardous Waste Tracking) - HAZARDOU WASTE PROGRAM Small Quantity Generators, between 100 kg and 1000 kg of hazardous waste/month (Resource Conservation and Recovery Act (tracking hazardous waste)) - notification Organizations: CHEVRON PRODUCTS CO (CONTACT/OWNER)
CESAR CHAVEZ ELEMENTARY SCHOOL (825 SHOTWELL ST in SAN FRANCISCO, CA)
COMPLIANCE ACTIVITY (Tracking inspections of insecticide, fungicide, and rodenticide, and toxic substances) (National Center for Education Statistics) - STATE ID-6041149 Organizations: SAN FRANCISCO UNIFIED (SCHOOL DISTRICT)
HANS ART AUTOMOTIVE (3121 17TH ST in SAN FRANCISCO, CA)
STATE MASTER (California - Hazardous Waste Tracking) - HAZARDOU WASTE PROGRAM Small Quantity Generators, between 100 kg and 1000 kg of hazardous waste/month (Resource Conservation and Recovery Act (tracking hazardous waste)) - notification
MOSCONE (GEORGE R.) ELEMENTARY (2355 FOLSOM ST. in SAN FRANCISCO, CA)
(National Center for Education Statistics) - STATE ID-6099154 Organizations: SAN FRANCISCO UNIFIED (SCHOOL DISTRICT)
HORACE MANN MIDDLE (3351 23RD ST. in SAN FRANCISCO, CA)
(National Center for Education Statistics) - STATE ID-6062046 Organizations: SAN FRANCISCO UNIFIED (SCHOOL DISTRICT)
FLYNN (LEONARD R.) ELEMENTARY (3125 ARMY ST. in SAN FRANCISCO, CA)
(National Center for Education Statistics) - STATE ID-6041347 Organizations: SAN FRANCISCO UNIFIED (SCHOOL DISTRICT)
Housing units lacking complete plumbing facilities: 2.9% Housing units lacking complete kitchen facilities: 3.4%
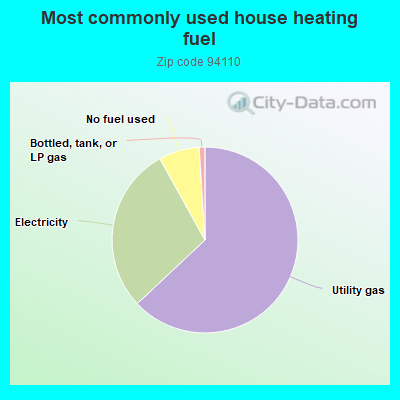
62.5%Utility gas
28.7%Electricity
7.0%No fuel used
1.0%Bottled, tank, or LP gas
Population in 1990: 70,770. Population change in the 1990s: +3,863 (+5.5%).
Place of birth for U.S.-born residents:
This state: 29,606
Northeast: 6,919
Midwest: 4,425
South: 4,693
West: 2,088
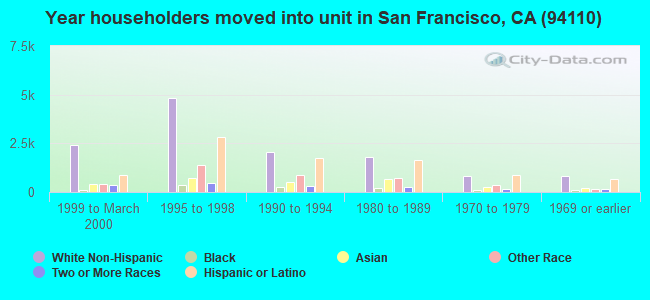
60% of the 94110 zip code residents lived in the same house 5 years ago. Out of people who lived in different houses, 57% lived in this county. Out of people who lived in different counties, 50% lived in California.
87% of the 94110 zip code residents lived in the same house 1 year ago. Out of people who lived in different houses, 56% moved from this county. Out of people who lived in different houses, 17% moved from different county within same state. Out of people who lived in different houses, 18% moved from different state. Out of people who lived in different houses, 9% moved from abroad.
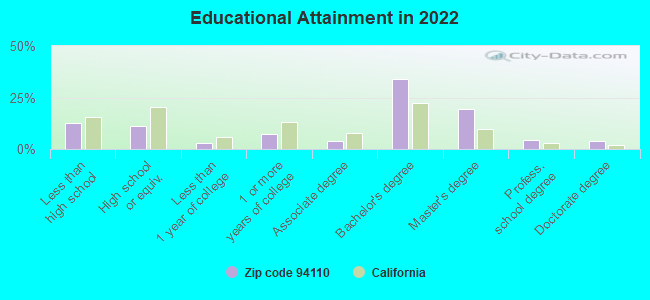
Private vs. public school enrollment:
Students in private schools in grades 1 to 8 (elementary and middle school): 1,197
Here:
26.7%
California:
10.5%
Students in private schools in grades 9 to 12 (high school): 405
Here:
24.2%
California:
8.5%
Students in private undergraduate colleges: 267
Here:
13.8%
California:
15.9%
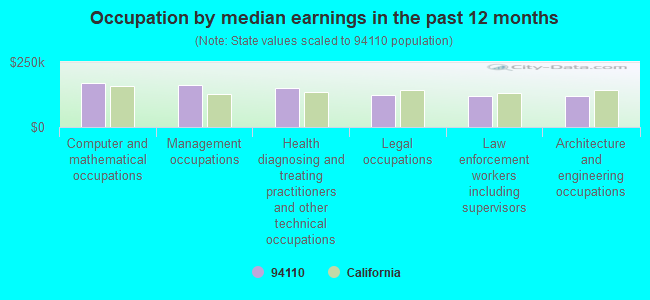
Occupation by median earnings in the past 12 months ($)
170,470Computer and mathematical occupations
161,227Management occupations
149,956Health diagnosing and treating practitioners and other technical occupations
125,047Legal occupations
120,319Law enforcement workers including supervisors
118,630Architecture and engineering occupations
Companies with federal contracts located in this zip code (SAN FRANCISCO, CA):
FANTASTIC DATA LLC (207 PROSPECT AVENUE; small business) : $2,533,347 in 14 contractsfrom 2000 to 2006
Contracts for Defense Electronics and Communication Equipment -- Basic Research (R&D), Other Research and Development -- Applied Research and Exploratory Development (R&D), Land -- Basic Research (R&D), Other Defense -- Advanced Development (R&D), and moreby Army, Navy Signed by year:2000: $464,950; 2001: $50,000; 2002: $319,341; 2003: $410,262; 2004: $854,155; 2005: $69,839; 2006: $364,800.
Biggest contracts:
$369,307 with Army for Defense Electronics and Communication Equipment -- Basic Research (R&D). Signed on 2004-12-08. Completion date: 2005-11-30.
$365,088, same as above.Signed on 2004-11-17. Completion date: 2006-11-15.
$364,800, same as above.Signed on 2006-01-26. Completion date: 2006-11-15.
$360,615, same as above.Signed on 2003-11-24. Completion date: 2005-11-30.
REGENTS OF THE UNIVERSITY OF C (RM 3316 BLDG 30) : $146,000 in 4 contractsfrom 1999 to 2004
$50,000 with Offices, Boards and Divisions (includes Attorney General, Deputy Attorney General, etc.) for Legal Services. Taking place in DC. Signed on 2004-06-01. Completion date: 2005-06-30.
$38,000, same as above.Signed on 2001-09-15. Completion date: 2002-09-15.
$32,000, same as above.Signed on 2002-09-15. Completion date: 2003-12-15.
$26,000 with Food and Drug Administration for Other Professional Services. Signed on 1999-11-15. Completion date: 2000-09-15.
MCMILLAN TECHNOLOGY INC. (1515 SOUTH VAN NESS AVE.; small business)
$72,297 with Army for Other ADP and Telecommunications Services (includes data storage on tapes, compact disks, etc.). Signed on 2000-01-22. Completion date: 1999-06-30.
GORMAN MANUFACTURING COMPANY, (492 KOLLER ST)
$55,000 with Public Buildings Service for Maintenance, Repair or Alteration of Real Property -- Office Buildings. Taking place in TX. Signed on 2000-09-15. Completion date: 2000-10-15.
EDITIONS LIMITED WEST, INC (744 ALABAMA ST STE 300; small business)
$29,228 with Navy for Signs, Advertising Displays, and Identification Plates. Signed on 2000-02-29. Completion date: 2000-04-10.
PM STRAUSS & ASSOCIATES (317 RUTLEDGE; small business)
$18,550 with Navy for Environmental Sciences -- Basic Research (R&D). Signed on 2003-03-31. Completion date: 2003-12-30.
EXPERIENCEPOINT LLC (1355 VALENCIA ST; small business)
$6,450 with Navy for Educational Services. Signed on 2005-09-21. Completion date: 2005-09-22.
WINK BACK, INC (912 B CAPP STREET; small business)
$5,100 with Army for Training Aids. Taking place in LA. Signed on 2004-09-16. Completion date: 2004-09-24.
Top industries in this zip code by the number of employees in 2005:
Health Care and Social Assistance: General Medical and Surgical Hospitals (over 1000 employees: 1 establishment, 500-999 employees: 1 establishment)
2005 - 2018 National Fire Incident Reporting System (NFIRS) incidents
According to the data from the years 2005 - 2018 the average number of fires per year is 244. The highest number of reported fire incidents - 286 took place in 2011, and the least - 142 in 2014. The data has a decreasing trend.
When looking into fire subcategories, the most incidents belonged to: Structure Fires (51.7%), and Outside Fires (37.8%).
Fire incident types reported to NFIRS in Zip Code 94110


 Nearest zip codes: 94107, 94114, 94103, 94131, 94134, 94102.


 . Federal Facility


 According to the data from the years 2005 - 2018 the average number of fires per year is 244. The highest number of reported fire incidents - 286 took place in 2011, and the least - 142 in 2014. The data has a decreasing trend.
 When looking into fire subcategories, the most incidents belonged to: Structure Fires (51.7%), and Outside Fires (37.8%).