Estimated zip code population in 2022: 26,945 Zip code population in 2010: 24,904 Zip code population in 2000: 25,392
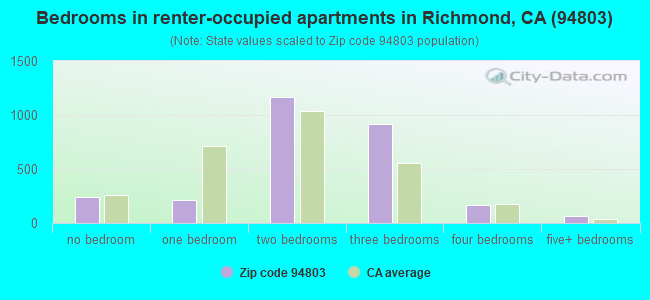
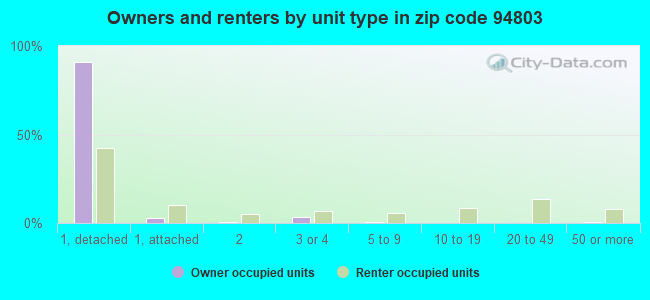
Houses and condos: 9,932 Renter-occupied apartments: 2,772
% of renters here:
29%
State:
44%
March 2022 cost of living index in zip code 94803: 117.0 (more than average, U.S. average is 100)
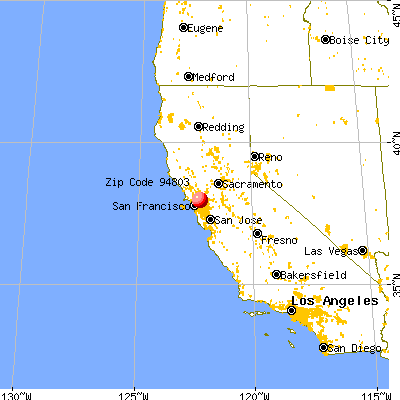
Land area: 11.7 sq. mi. Water area: 0.0 sq. mi.
Population density: 2,307 people per square mile
(low).
OSM Map
General Map
Google Map
MSN Map
OSM Map
General Map
Google Map
MSN Map
OSM Map
General Map
Google Map
MSN Map
OSM Map
General Map
Google Map
MSN Map
Please wait while loading the map...
Real estate property taxes paid for housing units in 2022:
This zip code:
0.8% ($5,915)
California:
0.7% ($4,831)
Median real estate property taxes paid for housing units with mortgages in 2022: $6,508 (0.9%) Median real estate property taxes paid for housing units with no mortgage in 2022: $4,906 (0.6%)
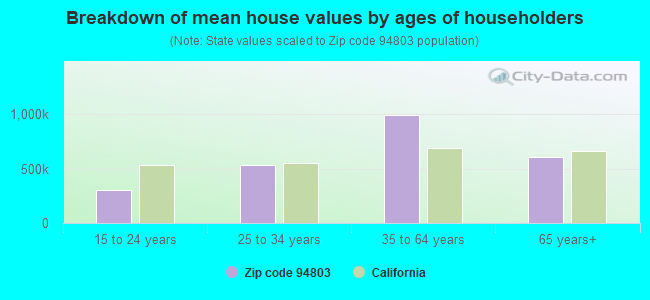
Estimated median house/condo value in 2022: $756,402
94803:
$756,402
California:
$715,900
According to our research of California and other state lists, there were 21 registered sex offenders living in 94803 zip code as of April 23, 2024. The ratio of all residents to sex offenders in zip code 94803 is 1,221 to 1. The ratio of registered sex offenders to all residents in this zip code is lower than the state average.
Median resident age:
This zip code:
44.7 years
California median age:
37.9 years
Average household size:
This zip code:
2.8 people
California:
2.8 people
Averages for the 2020 tax year for zip code 94803, filed in 2021:
Average Adjusted Gross Income (AGI) in 2020: $78,137 (Individual Income Tax Returns)
Here:
$78,137
State:
$95,910
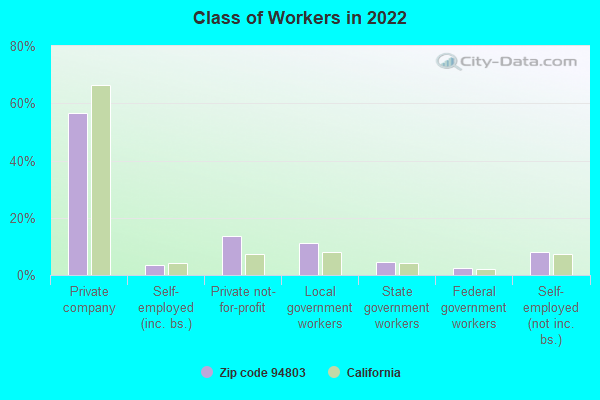
Salary/wage: $70,109 (reported on 76.4% of returns)
Here:
$70,109
State:
$77,331
(% of AGI for various income ranges: 1108.7% for AGIs below $25k, 3829.4% for AGIs $25k-50k, 7358.7% for AGIs $50k-75k, 10776.1% for AGIs $75k-100k, 19596.8% for AGIs $100k-200k, 69095.4% for AGIs over 200k)
Taxable interest for individuals: $1,047 (reported on 39.8% of returns)
This zip code:
$1,047
California:
$2,294
(% of AGI for various income ranges: 26.0% for AGIs below $25k, 30.4% for AGIs $25k-50k, 66.4% for AGIs $50k-75k, 89.2% for AGIs $75k-100k, 121.7% for AGIs $100k-200k, 487.3% for AGIs over 200k)
Ordinary dividends: $4,342 (reported on 20.3% of returns)
Here:
$4,342
State:
$10,949
(% of AGI for various income ranges: 28.2% for AGIs below $25k, 53.2% for AGIs $25k-50k, 90.4% for AGIs $50k-75k, 169.8% for AGIs $75k-100k, 301.3% for AGIs $100k-200k, 1402.3% for AGIs over 200k)
Net capital gain/loss in AGI: +$15,360 (reported on 19.0% of returns)
Here:
+$15,360
State:
+$49,306
(% of AGI for various income ranges: 13.0% for AGIs below $25k, 37.4% for AGIs $25k-50k, 96.4% for AGIs $50k-75k, 168.3% for AGIs $75k-100k, 525.3% for AGIs $100k-200k, 10890.0% for AGIs over 200k)
Profit/loss from business: +$14,636 (reported on 21.2% of returns)
Here:
+$14,636
State:
+$15,671
(% of AGI for various income ranges: 233.0% for AGIs below $25k, 364.2% for AGIs $25k-50k, 400.9% for AGIs $50k-75k, 432.3% for AGIs $75k-100k, 921.0% for AGIs $100k-200k, 3450.4% for AGIs over 200k)
Taxable individual retirement arrangement distribution: $22,208 (reported on 9.0% of returns)
94803:
$22,208
California:
$23,505
(% of AGI for various income ranges: 60.1% for AGIs below $25k, 124.1% for AGIs $25k-50k, 181.9% for AGIs $50k-75k, 350.7% for AGIs $75k-100k, 717.8% for AGIs $100k-200k, 3217.3% for AGIs over 200k)
Self-employed (Keogh) retirement plans: $19,490 (reported on 0.8% of returns)
94803:
$19,490
California:
$30,163
(% of AGI for various income ranges: 30.5% for AGIs $50k-75k, 61.6% for AGIs $100k-200k, 288.8% for AGIs over 200k)
Total itemized deductions: $29,889 (reported on 19.2% of returns)
Here:
$29,889
State:
$39,517
(% of AGI for various income ranges: 135.5% for AGIs below $25k, 325.8% for AGIs $25k-50k, 755.3% for AGIs $50k-75k, 1287.1% for AGIs $75k-100k, 2279.6% for AGIs $100k-200k, 6708.8% for AGIs over 200k)
Charity contributions: $5,902 (reported on 14.8% of returns)
Here:
$5,902
State:
$12,598
(% of AGI for various income ranges: 7.4% for AGIs below $25k, 34.1% for AGIs $25k-50k, 98.8% for AGIs $50k-75k, 170.8% for AGIs $75k-100k, 320.9% for AGIs $100k-200k, 1511.9% for AGIs over 200k)
Taxes paid: $8,837 (reported on 19.1% of returns)
94803:
$8,837
State:
$8,807
(% of AGI for various income ranges: 35.1% for AGIs below $25k, 84.5% for AGIs $25k-50k, 220.8% for AGIs $50k-75k, 431.3% for AGIs $75k-100k, 714.0% for AGIs $100k-200k, 1724.2% for AGIs over 200k)
Earned income credit: $1,759 (reported on 10.3% of returns)
Here:
$1,759
State:
$2,074
(% of AGI for various income ranges: 72.1% for AGIs below $25k, 51.7% for AGIs $25k-50k)
Percentage of individuals using paid preparers for their 2020 taxes: 90.5%
Here:
91%
State:
92%
(% for various income ranges: 88.2% for AGIs below $25k, 90.4% for AGIs $25k-50k, 91.2% for AGIs $50k-75k, 91.7% for AGIs $75k-100k, 91.5% for AGIs $100k-200k, 93.2% for AGIs over 200k)
Averages for the 2012 tax year for zip code 94803, filed in 2013:
Average Adjusted Gross Income (AGI) in 2012: $61,171 (Individual Income Tax Returns)
Here:
$61,171
State:
$72,726
Salary/wage: $55,434 (reported on 79.7% of returns)
Here:
$55,434
State:
$59,079
(% of AGI for various income ranges: 67.8% for AGIs below $25k, 74.7% for AGIs $25k-50k, 73.7% for AGIs $50k-75k, 71.5% for AGIs $75k-100k, 74.8% for AGIs $100k-200k, 64.3% for AGIs over 200k)
Taxable interest for individuals: $1,021 (reported on 42.3% of returns)
This zip code:
$1,021
California:
$2,146
(% of AGI for various income ranges: 1.1% for AGIs below $25k, 1.0% for AGIs $25k-50k, 0.7% for AGIs $50k-75k, 0.5% for AGIs $75k-100k, 0.6% for AGIs $100k-200k, 0.7% for AGIs over 200k)
Ordinary dividends: $4,709 (reported on 20.7% of returns)
Here:
$4,709
State:
$9,308
(% of AGI for various income ranges: 1.6% for AGIs below $25k, 1.1% for AGIs $25k-50k, 1.5% for AGIs $50k-75k, 1.2% for AGIs $75k-100k, 1.1% for AGIs $100k-200k, 3.9% for AGIs over 200k)
Net capital gain/loss in AGI: +$4,341 (reported on 16.7% of returns)
Here:
+$4,341
State:
+$30,460
(% of AGI for various income ranges: 0.5% for AGIs $50k-75k, 0.6% for AGIs $75k-100k, 0.9% for AGIs $100k-200k, 5.4% for AGIs over 200k)
Profit/loss from business: +$14,868 (reported on 19.0% of returns)
Here:
+$14,868
State:
+$17,064
(% of AGI for various income ranges: 14.8% for AGIs below $25k, 6.8% for AGIs $25k-50k, 4.2% for AGIs $50k-75k, 4.1% for AGIs $75k-100k, 2.8% for AGIs $100k-200k, 3.5% for AGIs over 200k)
Taxable individual retirement arrangement distribution: $18,946 (reported on 10.1% of returns)
94803:
$18,946
California:
$19,557
(% of AGI for various income ranges: 3.3% for AGIs below $25k, 2.4% for AGIs $25k-50k, 3.0% for AGIs $50k-75k, 3.2% for AGIs $75k-100k, 3.2% for AGIs $100k-200k, 3.5% for AGIs over 200k)
Self-employment retirement plans: $15,300 (reported on 0.9% of returns)
94803:
$15,300
California:
$24,530
(% of AGI for various income ranges: 0.2% for AGIs below $25k, 0.4% for AGIs $50k-75k, 0.4% for AGIs $100k-200k)
Total itemized deductions: $25,266 (25% of AGI, reported on 43.0% of returns)
Here:
$25,266
State:
$34,004
Here:
25.4% of AGI
State:
22.7% of AGI
(% of AGI for various income ranges: 14.8% for AGIs below $25k, 14.1% for AGIs $25k-50k, 16.9% for AGIs $50k-75k, 19.9% for AGIs $75k-100k, 19.5% for AGIs $100k-200k, 17.0% for AGIs over 200k)
Charity contributions: $2,975 (reported on 35.1% of returns)
Here:
$2,975
State:
$4,659
(% of AGI for various income ranges: 0.8% for AGIs below $25k, 1.2% for AGIs $25k-50k, 1.6% for AGIs $50k-75k, 1.9% for AGIs $75k-100k, 2.0% for AGIs $100k-200k, 1.9% for AGIs over 200k)
Taxes paid: $9,316 (reported on 43.0% of returns)
94803:
$9,316
State:
$14,448
(% of AGI for various income ranges: 3.0% for AGIs below $25k, 3.5% for AGIs $25k-50k, 5.0% for AGIs $50k-75k, 6.6% for AGIs $75k-100k, 8.1% for AGIs $100k-200k, 8.8% for AGIs over 200k)
Earned income credit: $1,867 (reported on 13.9% of returns)
Here:
$1,867
State:
$2,286
(% of AGI for various income ranges: 4.9% for AGIs below $25k, 0.8% for AGIs $25k-50k)
Percentage of individuals using paid preparers for their 2012 taxes: 56.9%
Here:
57%
State:
64%
(% for various income ranges: 50.8% for AGIs below $25k, 56.5% for AGIs $25k-50k, 59.9% for AGIs $50k-75k, 62.1% for AGIs $75k-100k, 61.6% for AGIs $100k-200k, 67.6% for AGIs over 200k)
Averages for the 2004 tax year for zip code 94803, filed in 2005:
Average Adjusted Gross Income (AGI) in 2004: $56,250 (Individual Income Tax Returns)
Here:
$56,250
State:
$58,600
Salary/wage: $51,059 (reported on 81.8% of returns)
Here:
$51,059
State:
$49,455
(% of AGI for various income ranges: 123.1% for AGIs below $10k, 69.4% for AGIs $10k-25k, 77.7% for AGIs $25k-50k, 77.3% for AGIs $50k-75k, 79.8% for AGIs $75k-100k, 69.2% for AGIs over 100k)
Taxable interest for individuals: $1,596 (reported on 55.0% of returns)
This zip code:
$1,596
California:
$2,365
(% of AGI for various income ranges: 6.7% for AGIs below $10k, 2.9% for AGIs $10k-25k, 1.5% for AGIs $25k-50k, 1.7% for AGIs $50k-75k, 1.5% for AGIs $75k-100k, 1.3% for AGIs over 100k)
Taxable dividends: $2,395 (reported on 26.2% of returns)
Here:
$2,395
State:
$4,746
(% of AGI for various income ranges: 4.8% for AGIs below $10k, 1.7% for AGIs $10k-25k, 1.2% for AGIs $25k-50k, 1.1% for AGIs $50k-75k, 0.8% for AGIs $75k-100k, 1.1% for AGIs over 100k)
Net capital gain/loss: +$8,276 (reported on 21.8% of returns)
Here:
+$8,276
State:
+$23,418
(% of AGI for various income ranges: -0.8% for AGIs below $10k, 0.4% for AGIs $10k-25k, 0.4% for AGIs $25k-50k, 0.6% for AGIs $50k-75k, 1.1% for AGIs $75k-100k, 6.7% for AGIs over 100k)
Profit/loss from business: +$16,406 (reported on 18.4% of returns)
Here:
+$16,406
State:
+$16,826
(% of AGI for various income ranges: 1.5% for AGIs below $10k, 9.1% for AGIs $10k-25k, 6.4% for AGIs $25k-50k, 5.6% for AGIs $50k-75k, 3.8% for AGIs $75k-100k, 5.1% for AGIs over 100k)
IRA payment deduction: $3,149 (reported on 3.1% of returns)
94803:
$3,149
California:
$3,192
(% of AGI for various income ranges: 0.4% for AGIs below $10k, 0.3% for AGIs $10k-25k, 0.3% for AGIs $25k-50k, 0.2% for AGIs $50k-75k, 0.2% for AGIs $75k-100k, 0.1% for AGIs over 100k)
Self-employed pension: $11,683 (reported on 1.8% of returns)
Here:
$11,683
California:
$17,688
(% of AGI for various income ranges: 0.2% for AGIs $10k-25k, 0.2% for AGIs $25k-50k, 0.3% for AGIs $50k-75k, 0.2% for AGIs $75k-100k, 0.6% for AGIs over 100k)
Total itemized deductions: $26,074 (30% of AGI, reported on 48.9% of returns)
Here:
$26,074
State:
$28,113
Here:
30.0% of AGI
State:
25.3% of AGI
(% of AGI for various income ranges: 35.3% for AGIs below $10k, 18.0% for AGIs $10k-25k, 19.4% for AGIs $25k-50k, 23.8% for AGIs $50k-75k, 23.5% for AGIs $75k-100k, 23.5% for AGIs over 100k)
Charity contributions deductions: $2,800 (3% of AGI, reported on 42.4% of returns)
Here:
$2,800
State:
$3,923
Here:
3.2% of AGI
State:
3.3% of AGI
(% of AGI for various income ranges: 1.1% for AGIs below $10k, 1.2% for AGIs $10k-25k, 1.7% for AGIs $25k-50k, 2.2% for AGIs $50k-75k, 2.4% for AGIs $75k-100k, 2.2% for AGIs over 100k)
Total tax: $7,588 (reported on 82.1% of returns)
94803:
$7,588
State:
$10,761
(% of AGI for various income ranges: 5.6% for AGIs below $10k, 4.9% for AGIs $10k-25k, 7.5% for AGIs $25k-50k, 9.2% for AGIs $50k-75k, 10.2% for AGIs $75k-100k, 14.5% for AGIs over 100k)
Earned income credit: $1,517 (reported on 9.5% of returns)
Here:
$1,517
State:
$1,763
Percentage of individuals using paid preparers for their 2004 taxes: 61.3%
Here:
61%
State:
66%
(% for various income ranges: 51.4% for AGIs below $10k, 61.1% for AGIs $10k-25k, 61.0% for AGIs $25k-50k, 65.9% for AGIs $50k-75k, 63.4% for AGIs $75k-100k, 64.8% for AGIs over 100k)
Likely homosexual households (counted as self-reported same-sex unmarried-partner households)
Lesbian couples: 0.2% of all households
Gay men: 0.3% of all households
Household received Food Stamps/SNAP in the past 12 months: 822 Household did not receive Food Stamps/SNAP in the past 12 months: 8,611
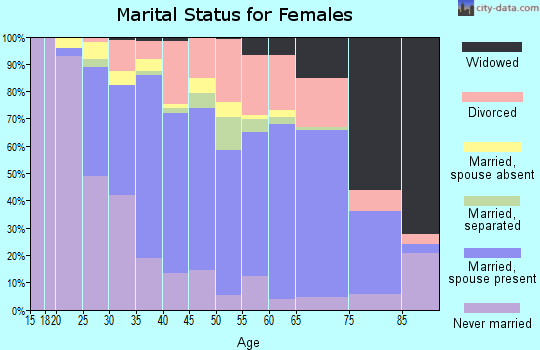
Women who had a birth in the past 12 months: 182 (159 now married, 22 unmarried) Women who did not have a birth in the past 12 months: 5,520 (2,327 now married, 3,187 unmarried)
Housing units in zip code 94803 with a mortgage: 4,547 (494 second mortgage, 440 both second mortgage and home equity loan) Houses without a mortgage: 310
Median monthly owner costs for units with a mortgage: $2,688 Median monthly owner costs for units without a mortgage: $872
Residents with income below the poverty level in 2022:
This zip code:
8.0%
Whole state:
12.2%
Residents with income below 50% of the poverty level in 2022:
This zip code:
3.8%
Whole state:
6.2%
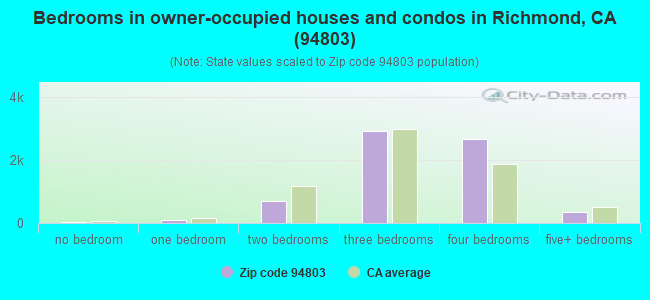
Median number of rooms in houses and condos:
Here:
6.4
State:
6.0
Median number of rooms in apartments:
Here:
4.5
State:
3.9
Notable locations in this zip code not listed on our city pages
Notable locations in zip code 94803: Sobrante Water Treatment Plant (A), El Sobrante Branch Contra Costa County Library (B), Richmond Fire Department Station 63 (C), Contra Costa County Fire Protection District Station 69 (D). Display/hide their locations on the map
Churches in zip code 94803 include: Hope Lutheran Church (A), First Baptist Church of El Sobrante (B), The Church of Jesus Christ of Latter Day Saints (C). Display/hide their locations on the map
Parks in zip code 94803 include: Hilltop Park (1), Kennedy Grove Regional Recreation Area (2), La Moine Valley View Park (3), Rain Cloud Park (4), Wildcat Canyon Regional Park (5), Sobrante Ridge Regional Preserve (6). Display/hide their locations on the map
In group quarters: 162 (-1 institutionalized population)
Size of family households: 2,593 2-persons, 1,769 3-persons, 1,536 4-persons, 731 5-persons, 209 6-persons, 300 7-or-more-persons
Size of nonfamily households: 1,719 1-person, 503 2-persons, 129 3-persons
2,736 married couples with children.
1,030 single-parent households (374 men, 656 women).
59.7% of residents of 94803 zip code speak English at home.
18.8% of residents speak Spanish at home (57% very well, 19% well, 19% not well, 4% not at all).
7.7% of residents speak other Indo-European language at home (56% very well, 27% well, 15% not well, 2% not at all).
11.5% of residents speak Asian or Pacific Island language at home (54% very well, 32% well, 9% not well, 6% not at all).
2.9% of residents speak other language at home (91% very well, 3% well, 6% not well).
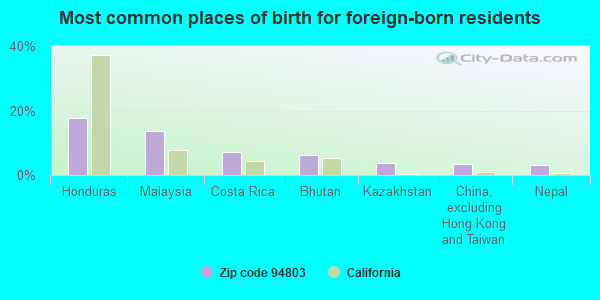
Foreign born population: 7,875 (29.2%) (60.5% of them are naturalized citizens)
This zip code:
29.2%
Whole state:
26.7%
18%Honduras
14%Malaysia
7%Costa Rica
6%Bhutan
4%Kazakhstan
3%China, excluding Hong Kong and Taiwan
3%Nepal
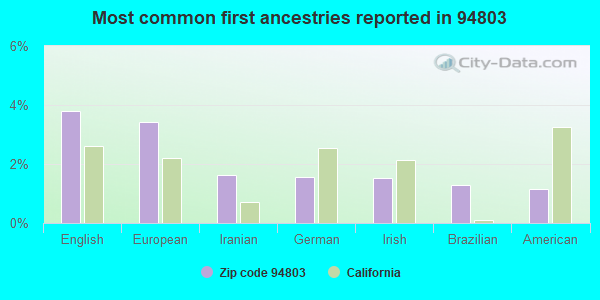
4%English
3%European
2%Iranian
2%German
2%Irish
1%Brazilian
1%American
Year of entry for the foreign-born population
1,8412010 or later
1,8552000 to 2009
1,9331990 to 1999
2,702Before 1990
Facilities with environmental interests located in this zip code:
EQUILON ENTERPRISES (1000 CUTTING BLVD/10TH ST in RICHMOND, CA) . Federal Facility
STATE MASTER (California - Hazardous Waste Tracking) - HAZARDOU WASTE PROGRAM Small Quantity Generators, between 100 kg and 1000 kg of hazardous waste/month (Resource Conservation and Recovery Act (tracking hazardous waste)) - notification Organizations: EQUILON ENTERPRISES, LLC (CONTACT/OWNER)
Alternative names: SHELL OIL CO
EL SOBRANTE ELEMENTARY (1060 MANOR ROAD in EL SOBRANTE, CA)
(National Center for Education Statistics) - STATE ID-6004725 Organizations: WEST CONTRA COSTA UNIFIED (SCHOOL DISTRICT)
MURPHY ELEMENTARY (4350 VALLEY VIEW ROAD in EL SOBRANTE, CA)
(National Center for Education Statistics) - STATE ID-6004873 Organizations: WEST CONTRA COSTA UNIFIED (SCHOOL DISTRICT)
MARTINDALE CLNRS (3819 SAN PABLO DAM RD in EL SOBRANTE, CA)
CRITERIA AND HAZARDOUS AIR POLLUTANT INVENTORY (Inventory of air pollution sources) Small Quantity Generators, between 100 kg and 1000 kg of hazardous waste/month (Resource Conservation and Recovery Act (tracking hazardous waste)) - notification Business SIC classification: DRYCLEANING PLANTS, EXCEPT RUG CLEANING Organizations: JONG PARK (CONTACT/OWNER)
EL SOBRANTE BODY AND FENDER (4012 SAN PABLO DAM ROAD in EL SOBRANTE, CA)
CRITERIA AND HAZARDOUS AIR POLLUTANT INVENTORY (Inventory of air pollution sources) Small Quantity Generators, between 100 kg and 1000 kg of hazardous waste/month (Resource Conservation and Recovery Act (tracking hazardous waste)) - notification Business SIC classification: TOP, BODY, AND UPHOLSTERY REPAIR SHOPS AND PAINT SHOPS Business NAICS classification: AUTOMOTIVE BODY, PAINT, AND INTERIOR REPAIR AND MAINTENANCE. Organizations: JIM HEARN (CONTACT/OWNER)
MANOR CLEANERS (5078 APPIAN WAY in EL SOBRANTE, CA)
Small Quantity Generators, between 100 kg and 1000 kg of hazardous waste/month (Resource Conservation and Recovery Act (tracking hazardous waste))
CHAO SMOG EXPRESS (3753 SAN PABLO DAM RD in EL SOBRANTE, CA)
Small Quantity Generators, between 100 kg and 1000 kg of hazardous waste/month (Resource Conservation and Recovery Act (tracking hazardous waste)) Organizations: KAO CHIO SAECHAO (CONTACT/OPERATOR)
KLEEN N BRITE CLEANERS (3800O SAN PABLO DAM ROAD in EL SOBRANTE, CA)
CRITERIA AND HAZARDOUS AIR POLLUTANT INVENTORY (Inventory of air pollution sources) Business SIC classification: DRYCLEANING PLANTS, EXCEPT RUG CLEANING Alternative names: BRITE - N -KLEAN CLEANERS
ADACHI FLORIST & NURSERY (5166 SOBRANTE AVE in EL SOBRANTE, CA)
COMPLIANCE ACTIVITY (Tracking inspections of insecticide, fungicide, and rodenticide, and toxic substances)
EAST BAY MUNICIPAL UTILITY DIS (5211 LA HONDA ROAD in EL SOBRANTE, CA)
CRITERIA AND HAZARDOUS AIR POLLUTANT INVENTORY (Inventory of air pollution sources) Business SIC classification: WATER SUPPLY
EL SOBRANTE CLEANERS (3650 SAN PABLO DAM ROAD in EL SOBRANTE, CA)
CRITERIA AND HAZARDOUS AIR POLLUTANT INVENTORY (Inventory of air pollution sources) Business SIC classification: DRYCLEANING PLANTS, EXCEPT RUG CLEANING
Housing units lacking complete plumbing facilities: 0.9% Housing units lacking complete kitchen facilities: 0.6%
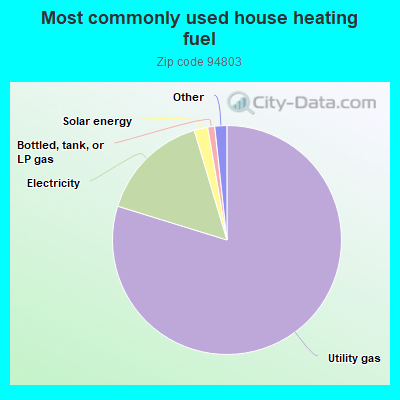
79.7%Utility gas
15.6%Electricity
1.9%Solar energy
1.0%Bottled, tank, or LP gas
0.9%Wood
0.5%No fuel used
Population in 1990: 22,238. Population change in the 1990s: +3,154 (+14.2%).
Place of birth for U.S.-born residents:
This state: 14,094
Northeast: 872
Midwest: 1,014
South: 1,810
West: 793
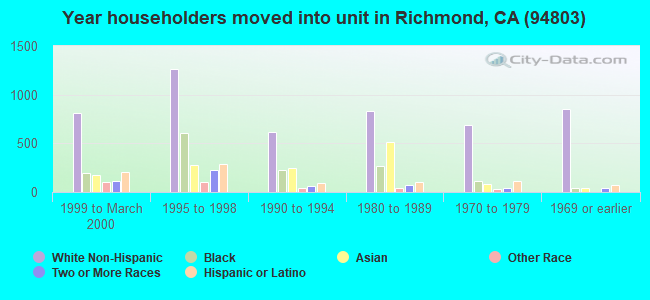
58% of the 94803 zip code residents lived in the same house 5 years ago. Out of people who lived in different houses, 58% lived in this county. Out of people who lived in different counties, 50% lived in California.
93% of the 94803 zip code residents lived in the same house 1 year ago. Out of people who lived in different houses, 48% moved from this county. Out of people who lived in different houses, 41% moved from different county within same state. Out of people who lived in different houses, 10% moved from different state. Out of people who lived in different houses, 4% moved from abroad.
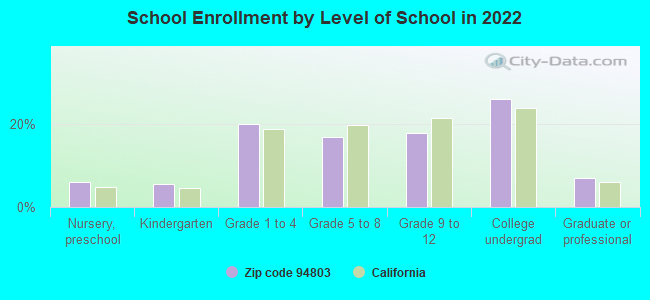
Private vs. public school enrollment:
Students in private schools in grades 1 to 8 (elementary and middle school): 433
Here:
19.3%
California:
10.5%
Students in private schools in grades 9 to 12 (high school): 139
Here:
12.8%
California:
8.5%
Students in private undergraduate colleges: 282
Here:
17.9%
California:
15.9%
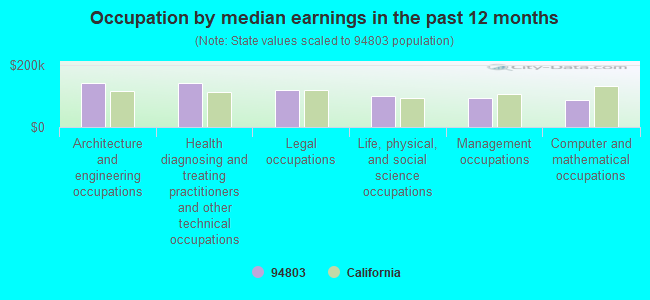
Occupation by median earnings in the past 12 months ($)
142,109Architecture and engineering occupations
141,937Health diagnosing and treating practitioners and other technical occupations
120,120Legal occupations
98,590Life, physical, and social science occupations
94,294Management occupations
85,921Computer and mathematical occupations
Top industries in this zip code by the number of employees in 2005:
2005 - 2018 National Fire Incident Reporting System (NFIRS) incidents
Based on the data from the years 2005 - 2018 the average number of fire incidents per year is 20. The highest number of fire incidents - 75 took place in 2005, and the least - 3 in 2016. The data has a declining trend.
When looking into fire subcategories, the most reports belonged to: Structure Fires (52.2%), and Outside Fires (29.2%).
Fire incident types reported to NFIRS in Zip Code 94803


 Nearest zip codes: 94564, 94530, 94805, 94547, 94806, 94708.


 . Federal Facility


 Based on the data from the years 2005 - 2018 the average number of fire incidents per year is 20. The highest number of fire incidents - 75 took place in 2005, and the least - 3 in 2016. The data has a declining trend.
 When looking into fire subcategories, the most reports belonged to: Structure Fires (52.2%), and Outside Fires (29.2%).