Estimated zip code population in 2022: 28,425 Zip code population in 2010: 30,067 Zip code population in 2000: 29,903
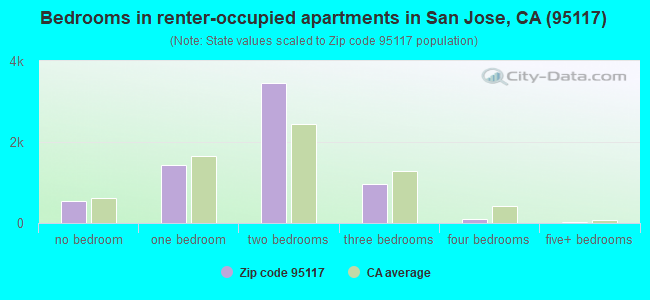
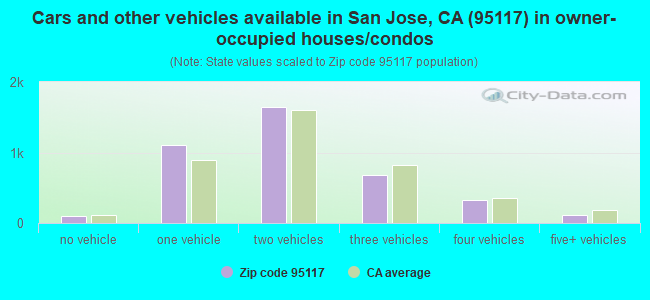
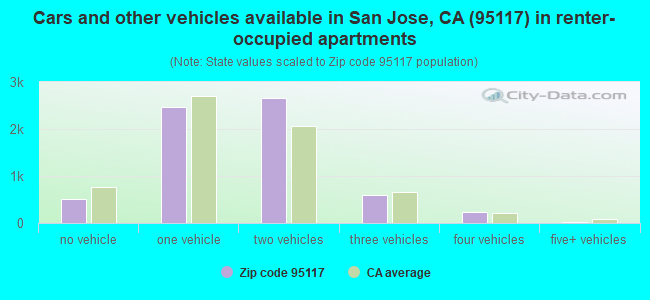
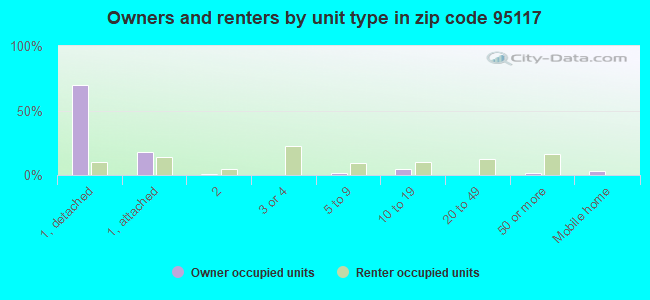
Houses and condos: 11,451 Renter-occupied apartments: 6,515
% of renters here:
62%
State:
44%
March 2022 cost of living index in zip code 95117: 127.5 (high, U.S. average is 100)
Land area: 2.6 sq. mi. Water area: 0.0 sq. mi.
Population density: 11,054 people per square mile
(high).
OSM Map
General Map
Google Map
MSN Map
OSM Map
General Map
Google Map
MSN Map
OSM Map
General Map
Google Map
MSN Map
OSM Map
General Map
Google Map
MSN Map
Please wait while loading the map...
Real estate property taxes paid for housing units in 2022:
This zip code:
0.7% ($9,530)
California:
0.7% ($4,831)
Median real estate property taxes paid for housing units with mortgages in 2022: $10,330 (0.6%) Median real estate property taxes paid for housing units with no mortgage in 2022: $5,548 (0.4%)
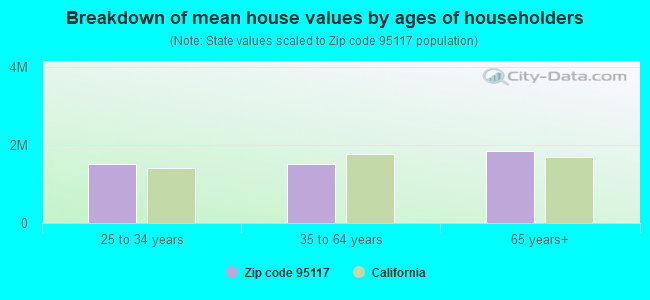
Estimated median house/condo value in 2022: $1,445,047
95117:
$1,445,047
California:
$715,900
Median resident age:
This zip code:
36.5 years
California median age:
37.9 years
Average household size:
This zip code:
2.7 people
California:
2.8 people
Averages for the 2020 tax year for zip code 95117, filed in 2021:
Average Adjusted Gross Income (AGI) in 2020: $112,871 (Individual Income Tax Returns)
Here:
$112,871
State:
$95,910
Salary/wage: $105,733 (reported on 85.9% of returns)
Here:
$105,733
State:
$77,331
(% of AGI for various income ranges: 1337.0% for AGIs below $25k, 4282.7% for AGIs $25k-50k, 7960.9% for AGIs $50k-75k, 11750.8% for AGIs $75k-100k, 22513.5% for AGIs $100k-200k, 154961.3% for AGIs over 200k)
Taxable interest for individuals: $1,679 (reported on 33.6% of returns)
This zip code:
$1,679
California:
$2,294
(% of AGI for various income ranges: 22.7% for AGIs below $25k, 20.2% for AGIs $25k-50k, 42.5% for AGIs $50k-75k, 84.4% for AGIs $75k-100k, 176.3% for AGIs $100k-200k, 844.4% for AGIs over 200k)
Ordinary dividends: $5,416 (reported on 26.9% of returns)
Here:
$5,416
State:
$10,949
(% of AGI for various income ranges: 35.8% for AGIs below $25k, 41.7% for AGIs $25k-50k, 72.5% for AGIs $50k-75k, 155.8% for AGIs $75k-100k, 351.0% for AGIs $100k-200k, 2792.2% for AGIs over 200k)
Net capital gain/loss in AGI: +$31,055 (reported on 27.6% of returns)
Here:
+$31,055
State:
+$49,306
(% of AGI for various income ranges: 12.3% for AGIs below $25k, 34.9% for AGIs $25k-50k, 62.2% for AGIs $50k-75k, 186.2% for AGIs $75k-100k, 703.9% for AGIs $100k-200k, 23676.4% for AGIs over 200k)
Profit/loss from business: +$15,517 (reported on 16.8% of returns)
Here:
+$15,517
State:
+$15,671
(% of AGI for various income ranges: 238.5% for AGIs below $25k, 209.0% for AGIs $25k-50k, 221.5% for AGIs $50k-75k, 415.6% for AGIs $75k-100k, 704.7% for AGIs $100k-200k, 2881.6% for AGIs over 200k)
Taxable individual retirement arrangement distribution: $21,315 (reported on 5.5% of returns)
95117:
$21,315
California:
$23,505
(% of AGI for various income ranges: 36.7% for AGIs below $25k, 50.3% for AGIs $25k-50k, 135.6% for AGIs $50k-75k, 269.3% for AGIs $75k-100k, 559.0% for AGIs $100k-200k, 1019.8% for AGIs over 200k)
Self-employed (Keogh) retirement plans: $26,418 (reported on 0.8% of returns)
95117:
$26,418
California:
$30,163
(% of AGI for various income ranges: 10.5% for AGIs $25k-50k, 52.9% for AGIs $100k-200k, 473.3% for AGIs over 200k)
Total itemized deductions: $32,647 (reported on 13.5% of returns)
Here:
$32,647
State:
$39,517
(% of AGI for various income ranges: 113.6% for AGIs below $25k, 134.9% for AGIs $25k-50k, 263.8% for AGIs $50k-75k, 529.0% for AGIs $75k-100k, 1352.6% for AGIs $100k-200k, 7431.1% for AGIs over 200k)
Charity contributions: $6,218 (reported on 10.3% of returns)
Here:
$6,218
State:
$12,598
(% of AGI for various income ranges: 3.4% for AGIs below $25k, 7.9% for AGIs $25k-50k, 18.6% for AGIs $50k-75k, 75.8% for AGIs $75k-100k, 186.6% for AGIs $100k-200k, 1285.1% for AGIs over 200k)
Taxes paid: $9,108 (reported on 13.5% of returns)
95117:
$9,108
State:
$8,807
(% of AGI for various income ranges: 20.0% for AGIs below $25k, 26.8% for AGIs $25k-50k, 68.2% for AGIs $50k-75k, 168.6% for AGIs $75k-100k, 422.0% for AGIs $100k-200k, 2054.7% for AGIs over 200k)
Earned income credit: $1,810 (reported on 9.5% of returns)
Here:
$1,810
State:
$2,074
(% of AGI for various income ranges: 68.0% for AGIs below $25k, 45.8% for AGIs $25k-50k)
Percentage of individuals using paid preparers for their 2020 taxes: 91.9%
Here:
92%
State:
92%
(% for various income ranges: 88.2% for AGIs below $25k, 92.9% for AGIs $25k-50k, 93.1% for AGIs $50k-75k, 91.7% for AGIs $75k-100k, 92.7% for AGIs $100k-200k, 94.8% for AGIs over 200k)
Averages for the 2012 tax year for zip code 95117, filed in 2013:
Average Adjusted Gross Income (AGI) in 2012: $67,016 (Individual Income Tax Returns)
Here:
$67,016
State:
$72,726
Salary/wage: $64,332 (reported on 87.1% of returns)
Here:
$64,332
State:
$59,079
(% of AGI for various income ranges: 80.0% for AGIs below $25k, 87.5% for AGIs $25k-50k, 84.2% for AGIs $50k-75k, 81.6% for AGIs $75k-100k, 84.6% for AGIs $100k-200k, 82.1% for AGIs over 200k)
Taxable interest for individuals: $988 (reported on 32.1% of returns)
This zip code:
$988
California:
$2,146
(% of AGI for various income ranges: 0.6% for AGIs below $25k, 0.5% for AGIs $25k-50k, 0.4% for AGIs $50k-75k, 0.4% for AGIs $75k-100k, 0.5% for AGIs $100k-200k, 0.5% for AGIs over 200k)
Ordinary dividends: $3,992 (reported on 19.9% of returns)
Here:
$3,992
State:
$9,308
(% of AGI for various income ranges: 1.1% for AGIs below $25k, 0.8% for AGIs $25k-50k, 1.0% for AGIs $50k-75k, 1.1% for AGIs $75k-100k, 1.3% for AGIs $100k-200k, 1.4% for AGIs over 200k)
Net capital gain/loss in AGI: +$9,291 (reported on 18.8% of returns)
Here:
+$9,291
State:
+$30,460
(% of AGI for various income ranges: 0.3% for AGIs $50k-75k, 0.6% for AGIs $75k-100k, 1.1% for AGIs $100k-200k, 7.0% for AGIs over 200k)
Profit/loss from business: +$16,208 (reported on 14.6% of returns)
Here:
+$16,208
State:
+$17,064
(% of AGI for various income ranges: 10.6% for AGIs below $25k, 4.6% for AGIs $25k-50k, 3.1% for AGIs $50k-75k, 3.9% for AGIs $75k-100k, 2.7% for AGIs $100k-200k, 2.3% for AGIs over 200k)
Taxable individual retirement arrangement distribution: $16,508 (reported on 6.2% of returns)
95117:
$16,508
California:
$19,557
(% of AGI for various income ranges: 1.8% for AGIs below $25k, 1.4% for AGIs $25k-50k, 2.1% for AGIs $50k-75k, 2.4% for AGIs $75k-100k, 1.6% for AGIs $100k-200k, 0.9% for AGIs over 200k)
Self-employment retirement plans: $14,136 (reported on 0.8% of returns)
95117:
$14,136
California:
$24,530
(% of AGI for various income ranges: 0.4% for AGIs $50k-75k, 0.2% for AGIs $100k-200k, 0.2% for AGIs over 200k)
Total itemized deductions: $30,371 (20% of AGI, reported on 28.7% of returns)
Here:
$30,371
State:
$34,004
Here:
20.3% of AGI
State:
22.7% of AGI
(% of AGI for various income ranges: 6.2% for AGIs below $25k, 5.7% for AGIs $25k-50k, 9.7% for AGIs $50k-75k, 13.5% for AGIs $75k-100k, 16.8% for AGIs $100k-200k, 15.6% for AGIs over 200k)
Charity contributions: $2,986 (reported on 22.3% of returns)
Here:
$2,986
State:
$4,659
(% of AGI for various income ranges: 0.3% for AGIs below $25k, 0.5% for AGIs $25k-50k, 0.9% for AGIs $50k-75k, 1.2% for AGIs $75k-100k, 1.3% for AGIs $100k-200k, 1.1% for AGIs over 200k)
Taxes paid: $15,049 (reported on 28.7% of returns)
95117:
$15,049
State:
$14,448
(% of AGI for various income ranges: 1.2% for AGIs below $25k, 1.4% for AGIs $25k-50k, 2.9% for AGIs $50k-75k, 5.2% for AGIs $75k-100k, 8.0% for AGIs $100k-200k, 10.2% for AGIs over 200k)
Earned income credit: $1,866 (reported on 13.3% of returns)
Here:
$1,866
State:
$2,286
(% of AGI for various income ranges: 4.2% for AGIs below $25k, 0.6% for AGIs $25k-50k)
Percentage of individuals using paid preparers for their 2012 taxes: 58.6%
Here:
59%
State:
64%
(% for various income ranges: 61.2% for AGIs below $25k, 63.7% for AGIs $25k-50k, 56.5% for AGIs $50k-75k, 54.2% for AGIs $75k-100k, 49.4% for AGIs $100k-200k, 50.0% for AGIs over 200k)
Averages for the 2004 tax year for zip code 95117, filed in 2005:
Average Adjusted Gross Income (AGI) in 2004: $54,278 (Individual Income Tax Returns)
Here:
$54,278
State:
$58,600
Salary/wage: $52,521 (reported on 86.5% of returns)
Here:
$52,521
State:
$49,455
(% of AGI for various income ranges: 113.3% for AGIs below $10k, 79.9% for AGIs $10k-25k, 86.6% for AGIs $25k-50k, 83.2% for AGIs $50k-75k, 85.6% for AGIs $75k-100k, 82.1% for AGIs over 100k)
Taxable interest for individuals: $1,254 (reported on 44.4% of returns)
This zip code:
$1,254
California:
$2,365
(% of AGI for various income ranges: 7.7% for AGIs below $10k, 1.6% for AGIs $10k-25k, 0.9% for AGIs $25k-50k, 1.0% for AGIs $50k-75k, 0.9% for AGIs $75k-100k, 0.9% for AGIs over 100k)
Taxable dividends: $2,013 (reported on 25.2% of returns)
Here:
$2,013
State:
$4,746
(% of AGI for various income ranges: 5.2% for AGIs below $10k, 1.2% for AGIs $10k-25k, 0.8% for AGIs $25k-50k, 0.8% for AGIs $50k-75k, 0.8% for AGIs $75k-100k, 0.9% for AGIs over 100k)
Net capital gain/loss: +$5,870 (reported on 23.8% of returns)
Here:
+$5,870
State:
+$23,418
(% of AGI for various income ranges: -0.9% for AGIs below $10k, -0.1% for AGIs $10k-25k, 0.2% for AGIs $25k-50k, 0.7% for AGIs $50k-75k, 0.9% for AGIs $75k-100k, 5.2% for AGIs over 100k)
Profit/loss from business: +$14,388 (reported on 13.7% of returns)
Here:
+$14,388
State:
+$16,826
(% of AGI for various income ranges: 3.4% for AGIs below $10k, 6.6% for AGIs $10k-25k, 3.0% for AGIs $25k-50k, 4.4% for AGIs $50k-75k, 3.7% for AGIs $75k-100k, 3.2% for AGIs over 100k)
IRA payment deduction: $2,984 (reported on 2.6% of returns)
95117:
$2,984
California:
$3,192
(% of AGI for various income ranges: 0.2% for AGIs $10k-25k, 0.2% for AGIs $25k-50k, 0.2% for AGIs $50k-75k, 0.2% for AGIs $75k-100k, 0.1% for AGIs over 100k)
Self-employed pension: $10,730 (reported on 1.1% of returns)
Here:
$10,730
California:
$17,688
(% of AGI for various income ranges: 0.1% for AGIs $25k-50k, 0.2% for AGIs $50k-75k, 0.3% for AGIs $75k-100k, 0.3% for AGIs over 100k)
Total itemized deductions: $24,399 (24% of AGI, reported on 33.4% of returns)
Here:
$24,399
State:
$28,113
Here:
24.1% of AGI
State:
25.3% of AGI
(% of AGI for various income ranges: 22.9% for AGIs below $10k, 9.5% for AGIs $10k-25k, 9.1% for AGIs $25k-50k, 13.5% for AGIs $50k-75k, 17.5% for AGIs $75k-100k, 17.7% for AGIs over 100k)
Charity contributions deductions: $2,557 (2% of AGI, reported on 28.6% of returns)
Here:
$2,557
State:
$3,923
Here:
2.4% of AGI
State:
3.3% of AGI
(% of AGI for various income ranges: 1.1% for AGIs below $10k, 0.7% for AGIs $10k-25k, 0.9% for AGIs $25k-50k, 1.4% for AGIs $50k-75k, 1.5% for AGIs $75k-100k, 1.5% for AGIs over 100k)
Total tax: $8,676 (reported on 78.4% of returns)
95117:
$8,676
State:
$10,761
(% of AGI for various income ranges: 4.2% for AGIs below $10k, 4.3% for AGIs $10k-25k, 7.4% for AGIs $25k-50k, 10.9% for AGIs $50k-75k, 11.9% for AGIs $75k-100k, 16.7% for AGIs over 100k)
Earned income credit: $1,511 (reported on 10.1% of returns)
Here:
$1,511
State:
$1,763
Percentage of individuals using paid preparers for their 2004 taxes: 57.5%
Here:
58%
State:
66%
(% for various income ranges: 51.7% for AGIs below $10k, 64.0% for AGIs $10k-25k, 61.3% for AGIs $25k-50k, 55.4% for AGIs $50k-75k, 52.3% for AGIs $75k-100k, 52.0% for AGIs over 100k)
Likely homosexual households (counted as self-reported same-sex unmarried-partner households)
Lesbian couples: 0.1% of all households
Gay men: 0.1% of all households
Household received Food Stamps/SNAP in the past 12 months: 962 Household did not receive Food Stamps/SNAP in the past 12 months: 9,466
Women who had a birth in the past 12 months: 260 (229 now married, 30 unmarried) Women who did not have a birth in the past 12 months: 6,613 (3,090 now married, 3,504 unmarried)
Housing units in zip code 95117 with a mortgage: 2,491 (388 second mortgage, 16 home equity loan, 341 both second mortgage and home equity loan) Median monthly owner costs for units with a mortgage: $3,858 Median monthly owner costs for units without a mortgage: $868
Residents with income below the poverty level in 2022:
This zip code:
9.5%
Whole state:
12.2%
Residents with income below 50% of the poverty level in 2022:
This zip code:
6.5%
Whole state:
6.2%
Median number of rooms in houses and condos:
Here:
5.7
State:
6.0
Median number of rooms in apartments:
Here:
3.7
State:
3.9
Notable locations in this zip code not listed on our city pages
Notable locations in zip code 95117: Winchester Mystery House (A), West Valley Branch San Jose Public Library (B), San Jose Fire Department Station 14 (C). Display/hide their locations on the map
Churches in zip code 95117 include: Zion Lutheran Church (A), Bay Area Pentecostal Church (B), Bethel Church of San Jose (C), Central Church of the Nazarene (D), Immanuel Presbyterian Church (E), Kingdom Hall of Jehovahs Witnesses (F), Korean West Valley Presbyterian Church (G), Potters House Christian Church (H). Display/hide their locations on the map
In group quarters: 241 (-1 institutionalized population)
Size of family households: 2,351 2-persons, 1,827 3-persons, 1,710 4-persons, 768 5-persons, 186 6-persons, 75 7-or-more-persons
Size of nonfamily households: 2,596 1-person, 816 2-persons, 170 3-persons
3,749 married couples with children.
2,077 single-parent households (761 men, 1,316 women).
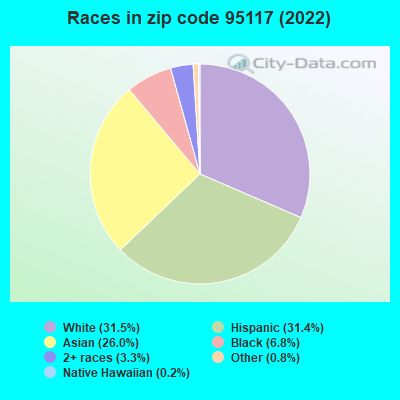
44.8% of residents of 95117 zip code speak English at home.
22.9% of residents speak Spanish at home (62% very well, 19% well, 16% not well, 4% not at all).
8.6% of residents speak other Indo-European language at home (74% very well, 15% well, 10% not well, 1% not at all).
18.9% of residents speak Asian or Pacific Island language at home (57% very well, 21% well, 14% not well, 9% not at all).
4.8% of residents speak other language at home (62% very well, 22% well, 10% not well, 5% not at all).
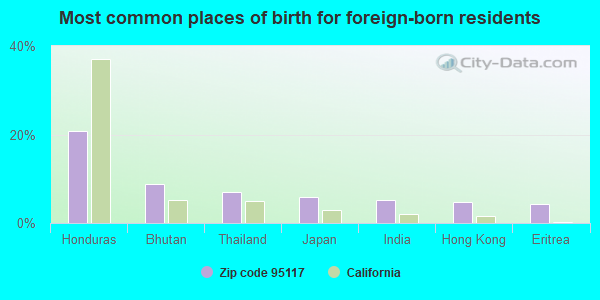
Foreign born population: 10,274 (36.1%) (50.0% of them are naturalized citizens)
Facilities with environmental interests located in this zip code:
ANDERSON BEHEL IMPORTS (3350 STEVENS CREEK BLVD in SAN JOSE, CA)
STATE MASTER (California - Hazardous Waste Tracking) - HAZARDOU WASTE PROGRAM CRITERIA AND HAZARDOUS AIR POLLUTANT INVENTORY (Inventory of air pollution sources) Small Quantity Generators, between 100 kg and 1000 kg of hazardous waste/month (Resource Conservation and Recovery Act (tracking hazardous waste)) - notification Business SIC classification: MOTOR VEHICLE DEALERS (NEW AND USED) Alternative names: W E BEHEL INC
JOE KERLEY LINCOLN MERCURY (3566 STEVENS CREEK BLVD in SAN JOSE, CA)
STATE MASTER (California - Hazardous Waste Tracking) - HAZARDOU WASTE PROGRAM CRITERIA AND HAZARDOUS AIR POLLUTANT INVENTORY (Inventory of air pollution sources) Small Quantity Generators, between 100 kg and 1000 kg of hazardous waste/month (Resource Conservation and Recovery Act (tracking hazardous waste)) - notification Business SIC classification: MOTOR VEHICLE DEALERS (NEW AND USED) Alternative names: JOE KERLEY FORD LINCOLN MERCUR
ANDERSON (LEROY) ELEMENTARY (4000 RHODA DR. in SAN JOSE, CA)
(National Center for Education Statistics) - STATE ID-6047831 Organizations: MORELAND ELEMENTARY (SCHOOL DISTRICT)
LYNHAVEN ELEMENTARY (881 S. CYPRESS AVE. in SAN JOSE, CA)
(National Center for Education Statistics) - STATE ID-6046601 Organizations: CAMPBELL UNION ELEMENTARY (SCHOOL DISTRICT)
MORELAND DISCOVERY (ELEM) (801 HIBISCUS LANE in SAN JOSE, CA)
(National Center for Education Statistics) - STATE ID-6047815 Organizations: MORELAND ELEMENTARY (SCHOOL DISTRICT)
KIELY PARK DRY CLEANER (445 SOUTH KIELY BOULEVARD in SAN JOSE, CA)
CRITERIA AND HAZARDOUS AIR POLLUTANT INVENTORY (Inventory of air pollution sources) Small Quantity Generators, between 100 kg and 1000 kg of hazardous waste/month (Resource Conservation and Recovery Act (tracking hazardous waste)) Business SIC classification: DRYCLEANING PLANTS, EXCEPT RUG CLEANING Alternative names: KIELY PARK CLEANERS
CELEBRITY DODGE (3209 STEVENS CREEK BLVD in SAN JOSE, CA)
Small Quantity Generators, between 100 kg and 1000 kg of hazardous waste/month (Resource Conservation and Recovery Act (tracking hazardous waste))
EQUIVA SERVICES LLC C/O TOXICH (1025 WINCHESTER BLVD in SAN JOSE, CA)
CRITERIA AND HAZARDOUS AIR POLLUTANT INVENTORY (Inventory of air pollution sources) Business SIC classification: ENGINEERING SERVICES
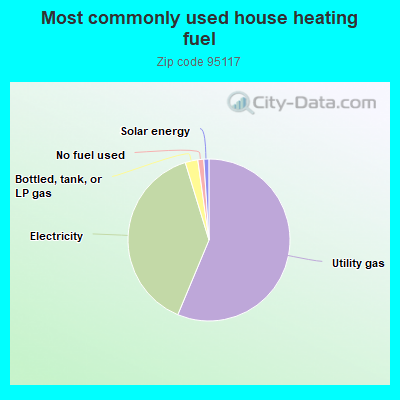
56.2%Utility gas
38.9%Electricity
2.5%Bottled, tank, or LP gas
1.2%No fuel used
1.0%Solar energy
Population in 1990: 27,414. Population change in the 1990s: +2,489 (+9.1%).
Place of birth for U.S.-born residents:
This state: 14,471
Northeast: 538
Midwest: 1,190
South: 488
West: 882
50% of the 95117 zip code residents lived in the same house 5 years ago. Out of people who lived in different houses, 68% lived in this county. Out of people who lived in different counties, 50% lived in California.
86% of the 95117 zip code residents lived in the same house 1 year ago. Out of people who lived in different houses, 66% moved from this county. Out of people who lived in different houses, 9% moved from different county within same state. Out of people who lived in different houses, 6% moved from different state. Out of people who lived in different houses, 18% moved from abroad.
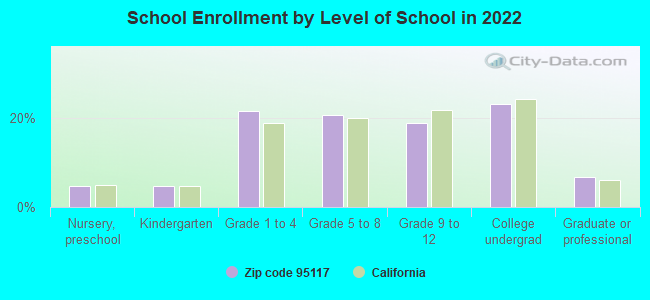
Private vs. public school enrollment:
Students in private schools in grades 1 to 8 (elementary and middle school): 254
Here:
9.4%
California:
10.5%
Students in private schools in grades 9 to 12 (high school): 195
Here:
16.1%
California:
8.5%
Students in private undergraduate colleges: 178
Here:
12.0%
California:
15.9%
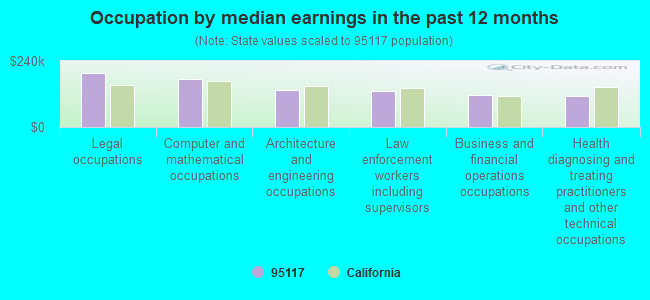
Occupation by median earnings in the past 12 months ($)
197,693Legal occupations
173,647Computer and mathematical occupations
135,348Architecture and engineering occupations
132,213Law enforcement workers including supervisors
114,607Business and financial operations occupations
113,918Health diagnosing and treating practitioners and other technical occupations
Companies with federal contracts located in this zip code:
DRS HADLAND, INC (4000 MOORPARK AVENUE in SAN JOSE, CA; small business) : $6,154,167 in 45 contractsfrom 1999 to 2005
Contracts for Cameras, Still Picture, Photographic Equipment and Accessories, Maintenance, Repair and Rebuilding of Equipment -- Photographic Equipment, Flight Instruments, and moreby Army, Navy, Air Force, NASA, and others Signed by year:2000: $1,620,288; 2001: $677,792; 2002: $1,101,213; 2003: $1,946,487; 2004: $685,407; 2005: -$10,030; 2006: $0.
Biggest contracts:
$499,990 with Army for Cameras, Still Picture. Signed on 2000-09-15. Completion date: 2000-11-30.
$362,464 with Navy for Cameras, Still Picture. Signed on 2000-03-24. Completion date: 2000-05-01.
$351,645 with Army for Photographic Equipment and Accessories. Signed on 2003-09-08. Completion date: 2004-07-15.
$349,407 with Army for Maintenance, Repair and Rebuilding of Equipment -- Photographic Equipment. Signed on 2000-02-15. Completion date: 2000-04-04.
ORLANDI TRAILER INC (3120 MOORPARK AVE in SAN JOSE, CA; small business) : $52,460 in 6 contractsfrom 2004 to 2006
Contracts for Airfield Specialized Trucks and Trailers, Miscellaneous Aircraft Accessories and Components, Trailers by Army Signed by year:2000: $0; 2001: $0; 2002: $0; 2003: $0; 2004: $42,964; 2005: $4,748; 2006: $4,748.
Biggest contracts:
$16,166 with Army for Airfield Specialized Trucks and Trailers. Signed on 2004-07-20. Completion date: 2004-09-24.
$11,426, same as above.Signed on 2004-08-03. Completion date: 2004-09-01.
$7,775 with Army for Miscellaneous Aircraft Accessories and Components. Signed on 2004-04-02. Completion date: 2004-06-11.
$7,597 with Army for Airfield Specialized Trucks and Trailers. Signed on 2004-07-27. Completion date: 2004-07-30.
SERVICE RENT-A-CAR (3806 STEVENS CREEK in SAN JOSE, CA) : $15,548 in 3 contractsin 2005
$12,957 with Army for Lease or Rental of Equipment -- Ground Effect Vehicles, Motor Vehicles, Trailers, and Cycles. Signed on 2005-03-11. Completion date: 2005-04-25.
$1,578, same as above.Signed on 2005-03-18. Completion date: 2005-04-25.
$1,013, same as above.Signed on 2005-06-13. Completion date: 2005-04-25.
Top industries in this zip code by the number of employees in 2005:
Administrative and Support and Waste Management and Remediation Services: Temporary Help Services (100-249 employees: 1 establishment, 50-99 employees: 1 establishment, 1-4 employees: 1 establishment)
2010 - 2017 National Fire Incident Reporting System (NFIRS) incidents
Based on the data from the years 2010 - 2017 the average number of fire incidents per year is 73. The highest number of fire incidents - 183 took place in 2017, and the least - 0 in 2014. The data has a growing trend.
When looking into fire subcategories, the most incidents belonged to: Outside Fires (54.9%), and Structure Fires (25.3%).
Fire incident types reported to NFIRS in Zip Code 95117


 Nearest zip codes: 95128, 95008, 95129, 95050, 95130, 95051.


 Based on the data from the years 2010 - 2017 the average number of fire incidents per year is 73. The highest number of fire incidents - 183 took place in 2017, and the least - 0 in 2014. The data has a growing trend.
 When looking into fire subcategories, the most incidents belonged to: Outside Fires (54.9%), and Structure Fires (25.3%).