Estimated zip code population in 2022: 45,308
Zip code population in 2010: 45,528
Zip code population in 2000: 44,095
Houses and condos: 12,379
Renter-occupied apartments: 2,450
% of renters here:
20%State:
44%
March 2022 cost of living index in zip code 95148: 123.1
(high, U.S. average is 100)
Land area: 9.4
sq. mi.
Water area: 0.1
sq. mi.
Population density: 4,807 people per square mile (average).
OSM Map
General Map
Google Map
MSN Map
OSM Map
General Map
Google Map
MSN Map
OSM Map
General Map
Google Map
MSN Map
OSM Map
General Map
Google Map
MSN Map
Please wait while loading the map...
Real estate property taxes paid for housing units in 2022:
This zip code:
0.8% ($9,662)California:
0.7% ($4,831)
Median real estate property taxes paid for housing units with mortgages in 2022: $10,330 (0.8%)
Median real estate property taxes paid for housing units with no mortgage in 2022: $8,283 (0.7%)
Profiles of local businesses
Business Search - 14 Million verified businesses
Males: 22,714 Females: 22,594
For population 25 years and over in 95148:
High school or higher: 83.1%Bachelor's degree or higher: 40.7%Graduate or professional degree: 13.5%Unemployed: 4.3%Mean travel time to work (commute): 30.8 minutes
For population 15 years and over in 95148:
Never married: 35.1%Now married: 53.0%Separated: 1.2%Widowed: 4.9%Divorced: 5.8%
Zip code 95148 compared to state average:
Median household income above state average. Median house value above state average. Black race population percentage below state average. Hispanic race population percentage below state average. Foreign-born population percentage above state average. Renting percentage below state average. Length of stay since moving in significantly above state average. Number of rooms per house above state average. 27,623 61.0% Asian 10,547 23.3% Hispanic or Latino 4,747 10.5% White 1,149 2.5% Black 871 1.9% Two or more races 316 0.7% Native Hawaiian and Other 26 0.06% American Indian 25 0.06% Some other race
Data:
Median household income ($)
Median household income (% change since 2000)
Household income diversity
Ratio of average income to average house value (%)
Ratio of average income to average rent
Median household income ($) - White
Median household income ($) - Black or African American
Median household income ($) - Asian
Median household income ($) - Hispanic or Latino
Median household income ($) - American Indian and Alaska Native
Median household income ($) - Multirace
Median household income ($) - Other Race
Median household income for houses/condos with a mortgage ($)
Median household income for apartments without a mortgage ($)
Races - White alone (%)
Races - White alone (% change since 2000)
Races - Black alone (%)
Races - Black alone (% change since 2000)
Races - American Indian alone (%)
Races - American Indian alone (% change since 2000)
Races - Asian alone (%)
Races - Asian alone (% change since 2000)
Races - Hispanic (%)
Races - Hispanic (% change since 2000)
Races - Native Hawaiian and Other Pacific Islander alone (%)
Races - Native Hawaiian and Other Pacific Islander alone (% change since 2000)
Races - Two or more races (%)
Races - Two or more races (% change since 2000)
Races - Other race alone (%)
Races - Other race alone (% change since 2000)
Racial diversity
Unemployment (%)
Unemployment (% change since 2000)
Unemployment (%) - White
Unemployment (%) - Black or African American
Unemployment (%) - Asian
Unemployment (%) - Hispanic or Latino
Unemployment (%) - American Indian and Alaska Native
Unemployment (%) - Multirace
Unemployment (%) - Other Race
Population density (people per square mile)
Population - Males (%)
Population - Females (%)
Population - Males (%) - White
Population - Males (%) - Black or African American
Population - Males (%) - Asian
Population - Males (%) - Hispanic or Latino
Population - Males (%) - American Indian and Alaska Native
Population - Males (%) - Multirace
Population - Males (%) - Other Race
Population - Females (%) - White
Population - Females (%) - Black or African American
Population - Females (%) - Asian
Population - Females (%) - Hispanic or Latino
Population - Females (%) - American Indian and Alaska Native
Population - Females (%) - Multirace
Population - Females (%) - Other Race
Coronavirus confirmed cases (Apr 24, 2024)
Deaths caused by coronavirus (Apr 24, 2024)
Coronavirus confirmed cases (per 100k population) (Apr 24, 2024)
Deaths caused by coronavirus (per 100k population) (Apr 24, 2024)
Daily increase in number of cases (Apr 24, 2024)
Weekly increase in number of cases (Apr 24, 2024)
Cases doubled (in days) (Apr 24, 2024)
Hospitalized patients (Apr 18, 2022)
Negative test results (Apr 18, 2022)
Total test results (Apr 18, 2022)
COVID Vaccine doses distributed (per 100k population) (Sep 19, 2023)
COVID Vaccine doses administered (per 100k population) (Sep 19, 2023)
COVID Vaccine doses distributed (Sep 19, 2023)
COVID Vaccine doses administered (Sep 19, 2023)
Likely homosexual households (%)
Likely homosexual households (% change since 2000)
Likely homosexual households - Lesbian couples (%)
Likely homosexual households - Lesbian couples (% change since 2000)
Likely homosexual households - Gay men (%)
Likely homosexual households - Gay men (% change since 2000)
Cost of living index
Median gross rent ($)
Median contract rent ($)
Median monthly housing costs ($)
Median house or condo value ($)
Median house or condo value ($ change since 2000)
Mean house or condo value by units in structure - 1, detached ($)
Mean house or condo value by units in structure - 1, attached ($)
Mean house or condo value by units in structure - 2 ($)
Mean house or condo value by units in structure by units in structure - 3 or 4 ($)
Mean house or condo value by units in structure - 5 or more ($)
Mean house or condo value by units in structure - Boat, RV, van, etc. ($)
Mean house or condo value by units in structure - Mobile home ($)
Median house or condo value ($) - White
Median house or condo value ($) - Black or African American
Median house or condo value ($) - Asian
Median house or condo value ($) - Hispanic or Latino
Median house or condo value ($) - American Indian and Alaska Native
Median house or condo value ($) - Multirace
Median house or condo value ($) - Other Race
Median resident age
Resident age diversity
Median resident age - Males
Median resident age - Females
Median resident age - White
Median resident age - Black or African American
Median resident age - Asian
Median resident age - Hispanic or Latino
Median resident age - American Indian and Alaska Native
Median resident age - Multirace
Median resident age - Other Race
Median resident age - Males - White
Median resident age - Males - Black or African American
Median resident age - Males - Asian
Median resident age - Males - Hispanic or Latino
Median resident age - Males - American Indian and Alaska Native
Median resident age - Males - Multirace
Median resident age - Males - Other Race
Median resident age - Females - White
Median resident age - Females - Black or African American
Median resident age - Females - Asian
Median resident age - Females - Hispanic or Latino
Median resident age - Females - American Indian and Alaska Native
Median resident age - Females - Multirace
Median resident age - Females - Other Race
Commute - mean travel time to work (minutes)
Travel time to work - Less than 5 minutes (%)
Travel time to work - Less than 5 minutes (% change since 2000)
Travel time to work - 5 to 9 minutes (%)
Travel time to work - 5 to 9 minutes (% change since 2000)
Travel time to work - 10 to 19 minutes (%)
Travel time to work - 10 to 19 minutes (% change since 2000)
Travel time to work - 20 to 29 minutes (%)
Travel time to work - 20 to 29 minutes (% change since 2000)
Travel time to work - 30 to 39 minutes (%)
Travel time to work - 30 to 39 minutes (% change since 2000)
Travel time to work - 40 to 59 minutes (%)
Travel time to work - 40 to 59 minutes (% change since 2000)
Travel time to work - 60 to 89 minutes (%)
Travel time to work - 60 to 89 minutes (% change since 2000)
Travel time to work - 90 or more minutes (%)
Travel time to work - 90 or more minutes (% change since 2000)
Marital status - Never married (%)
Marital status - Now married (%)
Marital status - Separated (%)
Marital status - Widowed (%)
Marital status - Divorced (%)
Median family income ($)
Median family income (% change since 2000)
Median non-family income ($)
Median non-family income (% change since 2000)
Median per capita income ($)
Median per capita income (% change since 2000)
Median family income ($) - White
Median family income ($) - Black or African American
Median family income ($) - Asian
Median family income ($) - Hispanic or Latino
Median family income ($) - American Indian and Alaska Native
Median family income ($) - Multirace
Median family income ($) - Other Race
Median year house/condo built
Median year apartment built
Year house built - Built 2005 or later (%)
Year house built - Built 2000 to 2004 (%)
Year house built - Built 1990 to 1999 (%)
Year house built - Built 1980 to 1989 (%)
Year house built - Built 1970 to 1979 (%)
Year house built - Built 1960 to 1969 (%)
Year house built - Built 1950 to 1959 (%)
Year house built - Built 1940 to 1949 (%)
Year house built - Built 1939 or earlier (%)
Average household size
Household density (households per square mile)
Average household size - White
Average household size - Black or African American
Average household size - Asian
Average household size - Hispanic or Latino
Average household size - American Indian and Alaska Native
Average household size - Multirace
Average household size - Other Race
Occupied housing units (%)
Vacant housing units (%)
Owner occupied housing units (%)
Renter occupied housing units (%)
Vacancy status - For rent (%)
Vacancy status - For sale only (%)
Vacancy status - Rented or sold, not occupied (%)
Vacancy status - For seasonal, recreational, or occasional use (%)
Vacancy status - For migrant workers (%)
Vacancy status - Other vacant (%)
Residents with income below the poverty level (%)
Residents with income below 50% of the poverty level (%)
Children below poverty level (%)
Poor families by family type - Married-couple family (%)
Poor families by family type - Male, no wife present (%)
Poor families by family type - Female, no husband present (%)
Poverty status for native-born residents (%)
Poverty status for foreign-born residents (%)
Poverty among high school graduates not in families (%)
Poverty among people who did not graduate high school not in families (%)
Residents with income below the poverty level (%) - White
Residents with income below the poverty level (%) - Black or African American
Residents with income below the poverty level (%) - Asian
Residents with income below the poverty level (%) - Hispanic or Latino
Residents with income below the poverty level (%) - American Indian and Alaska Native
Residents with income below the poverty level (%) - Multirace
Residents with income below the poverty level (%) - Other Race
Air pollution - Air Quality Index (AQI)
Air pollution - CO
Air pollution - NO2
Air pollution - SO2
Air pollution - Ozone
Air pollution - PM10
Air pollution - PM25
Air pollution - Pb
Crime - Murders per 100,000 population
Crime - Rapes per 100,000 population
Crime - Robberies per 100,000 population
Crime - Assaults per 100,000 population
Crime - Burglaries per 100,000 population
Crime - Thefts per 100,000 population
Crime - Auto thefts per 100,000 population
Crime - Arson per 100,000 population
Crime - City-data.com crime index
Crime - Violent crime index
Crime - Property crime index
Crime - Murders per 100,000 population (5 year average)
Crime - Rapes per 100,000 population (5 year average)
Crime - Robberies per 100,000 population (5 year average)
Crime - Assaults per 100,000 population (5 year average)
Crime - Burglaries per 100,000 population (5 year average)
Crime - Thefts per 100,000 population (5 year average)
Crime - Auto thefts per 100,000 population (5 year average)
Crime - Arson per 100,000 population (5 year average)
Crime - City-data.com crime index (5 year average)
Crime - Violent crime index (5 year average)
Crime - Property crime index (5 year average)
1996 Presidential Elections Results (%) - Democratic Party (Clinton)
1996 Presidential Elections Results (%) - Republican Party (Dole)
1996 Presidential Elections Results (%) - Other
2000 Presidential Elections Results (%) - Democratic Party (Gore)
2000 Presidential Elections Results (%) - Republican Party (Bush)
2000 Presidential Elections Results (%) - Other
2004 Presidential Elections Results (%) - Democratic Party (Kerry)
2004 Presidential Elections Results (%) - Republican Party (Bush)
2004 Presidential Elections Results (%) - Other
2008 Presidential Elections Results (%) - Democratic Party (Obama)
2008 Presidential Elections Results (%) - Republican Party (McCain)
2008 Presidential Elections Results (%) - Other
2012 Presidential Elections Results (%) - Democratic Party (Obama)
2012 Presidential Elections Results (%) - Republican Party (Romney)
2012 Presidential Elections Results (%) - Other
2016 Presidential Elections Results (%) - Democratic Party (Clinton)
2016 Presidential Elections Results (%) - Republican Party (Trump)
2016 Presidential Elections Results (%) - Other
2020 Presidential Elections Results (%) - Democratic Party (Biden)
2020 Presidential Elections Results (%) - Republican Party (Trump)
2020 Presidential Elections Results (%) - Other
Ancestries Reported - Arab (%)
Ancestries Reported - Czech (%)
Ancestries Reported - Danish (%)
Ancestries Reported - Dutch (%)
Ancestries Reported - English (%)
Ancestries Reported - French (%)
Ancestries Reported - French Canadian (%)
Ancestries Reported - German (%)
Ancestries Reported - Greek (%)
Ancestries Reported - Hungarian (%)
Ancestries Reported - Irish (%)
Ancestries Reported - Italian (%)
Ancestries Reported - Lithuanian (%)
Ancestries Reported - Norwegian (%)
Ancestries Reported - Polish (%)
Ancestries Reported - Portuguese (%)
Ancestries Reported - Russian (%)
Ancestries Reported - Scotch-Irish (%)
Ancestries Reported - Scottish (%)
Ancestries Reported - Slovak (%)
Ancestries Reported - Subsaharan African (%)
Ancestries Reported - Swedish (%)
Ancestries Reported - Swiss (%)
Ancestries Reported - Ukrainian (%)
Ancestries Reported - United States (%)
Ancestries Reported - Welsh (%)
Ancestries Reported - West Indian (%)
Ancestries Reported - Other (%)
Educational Attainment - No schooling completed (%)
Educational Attainment - Less than high school (%)
Educational Attainment - High school or equivalent (%)
Educational Attainment - Less than 1 year of college (%)
Educational Attainment - 1 or more years of college (%)
Educational Attainment - Associate degree (%)
Educational Attainment - Bachelor's degree (%)
Educational Attainment - Master's degree (%)
Educational Attainment - Professional school degree (%)
Educational Attainment - Doctorate degree (%)
School Enrollment - Nursery, preschool (%)
School Enrollment - Kindergarten (%)
School Enrollment - Grade 1 to 4 (%)
School Enrollment - Grade 5 to 8 (%)
School Enrollment - Grade 9 to 12 (%)
School Enrollment - College undergrad (%)
School Enrollment - Graduate or professional (%)
School Enrollment - Not enrolled in school (%)
School enrollment - Public schools (%)
School enrollment - Private schools (%)
School enrollment - Not enrolled (%)
Median number of rooms in houses and condos
Median number of rooms in apartments
Housing units lacking complete plumbing facilities (%)
Housing units lacking complete kitchen facilities (%)
Density of houses
Urban houses (%)
Rural houses (%)
Households with people 60 years and over (%)
Households with people 65 years and over (%)
Households with people 75 years and over (%)
Households with one or more nonrelatives (%)
Households with no nonrelatives (%)
Population in households (%)
Family households (%)
Nonfamily households (%)
Population in families (%)
Family households with own children (%)
Median number of bedrooms in owner occupied houses
Mean number of bedrooms in owner occupied houses
Median number of bedrooms in renter occupied houses
Mean number of bedrooms in renter occupied houses
Median number of vehichles in owner occupied houses
Mean number of vehichles in owner occupied houses
Median number of vehichles in renter occupied houses
Mean number of vehichles in renter occupied houses
Mortgage status - with mortgage (%)
Mortgage status - with second mortgage (%)
Mortgage status - with home equity loan (%)
Mortgage status - with both second mortgage and home equity loan (%)
Mortgage status - without a mortgage (%)
Average family size
Average family size - White
Average family size - Black or African American
Average family size - Asian
Average family size - Hispanic or Latino
Average family size - American Indian and Alaska Native
Average family size - Multirace
Average family size - Other Race
Geographical mobility - Same house 1 year ago (%)
Geographical mobility - Moved within same county (%)
Geographical mobility - Moved from different county within same state (%)
Geographical mobility - Moved from different state (%)
Geographical mobility - Moved from abroad (%)
Place of birth - Born in state of residence (%)
Place of birth - Born in other state (%)
Place of birth - Native, outside of US (%)
Place of birth - Foreign born (%)
Housing units in structures - 1, detached (%)
Housing units in structures - 1, attached (%)
Housing units in structures - 2 (%)
Housing units in structures - 3 or 4 (%)
Housing units in structures - 5 to 9 (%)
Housing units in structures - 10 to 19 (%)
Housing units in structures - 20 to 49 (%)
Housing units in structures - 50 or more (%)
Housing units in structures - Mobile home (%)
Housing units in structures - Boat, RV, van, etc. (%)
House/condo owner moved in on average (years ago)
Renter moved in on average (years ago)
Year householder moved into unit - Moved in 1999 to March 2000 (%)
Year householder moved into unit - Moved in 1995 to 1998 (%)
Year householder moved into unit - Moved in 1990 to 1994 (%)
Year householder moved into unit - Moved in 1980 to 1989 (%)
Year householder moved into unit - Moved in 1970 to 1979 (%)
Year householder moved into unit - Moved in 1969 or earlier (%)
Means of transportation to work - Drove car alone (%)
Means of transportation to work - Carpooled (%)
Means of transportation to work - Public transportation (%)
Means of transportation to work - Bus or trolley bus (%)
Means of transportation to work - Streetcar or trolley car (%)
Means of transportation to work - Subway or elevated (%)
Means of transportation to work - Railroad (%)
Means of transportation to work - Ferryboat (%)
Means of transportation to work - Taxicab (%)
Means of transportation to work - Motorcycle (%)
Means of transportation to work - Bicycle (%)
Means of transportation to work - Walked (%)
Means of transportation to work - Other means (%)
Working at home (%)
Industry diversity
Most Common Industries - Agriculture, forestry, fishing and hunting, and mining (%)
Most Common Industries - Agriculture, forestry, fishing and hunting (%)
Most Common Industries - Mining, quarrying, and oil and gas extraction (%)
Most Common Industries - Construction (%)
Most Common Industries - Manufacturing (%)
Most Common Industries - Wholesale trade (%)
Most Common Industries - Retail trade (%)
Most Common Industries - Transportation and warehousing, and utilities (%)
Most Common Industries - Transportation and warehousing (%)
Most Common Industries - Utilities (%)
Most Common Industries - Information (%)
Most Common Industries - Finance and insurance, and real estate and rental and leasing (%)
Most Common Industries - Finance and insurance (%)
Most Common Industries - Real estate and rental and leasing (%)
Most Common Industries - Professional, scientific, and management, and administrative and waste management services (%)
Most Common Industries - Professional, scientific, and technical services (%)
Most Common Industries - Management of companies and enterprises (%)
Most Common Industries - Administrative and support and waste management services (%)
Most Common Industries - Educational services, and health care and social assistance (%)
Most Common Industries - Educational services (%)
Most Common Industries - Health care and social assistance (%)
Most Common Industries - Arts, entertainment, and recreation, and accommodation and food services (%)
Most Common Industries - Arts, entertainment, and recreation (%)
Most Common Industries - Accommodation and food services (%)
Most Common Industries - Other services, except public administration (%)
Most Common Industries - Public administration (%)
Occupation diversity
Most Common Occupations - Management, business, science, and arts occupations (%)
Most Common Occupations - Management, business, and financial occupations (%)
Most Common Occupations - Management occupations (%)
Most Common Occupations - Business and financial operations occupations (%)
Most Common Occupations - Computer, engineering, and science occupations (%)
Most Common Occupations - Computer and mathematical occupations (%)
Most Common Occupations - Architecture and engineering occupations (%)
Most Common Occupations - Life, physical, and social science occupations (%)
Most Common Occupations - Education, legal, community service, arts, and media occupations (%)
Most Common Occupations - Community and social service occupations (%)
Most Common Occupations - Legal occupations (%)
Most Common Occupations - Education, training, and library occupations (%)
Most Common Occupations - Arts, design, entertainment, sports, and media occupations (%)
Most Common Occupations - Healthcare practitioners and technical occupations (%)
Most Common Occupations - Health diagnosing and treating practitioners and other technical occupations (%)
Most Common Occupations - Health technologists and technicians (%)
Most Common Occupations - Service occupations (%)
Most Common Occupations - Healthcare support occupations (%)
Most Common Occupations - Protective service occupations (%)
Most Common Occupations - Fire fighting and prevention, and other protective service workers including supervisors (%)
Most Common Occupations - Law enforcement workers including supervisors (%)
Most Common Occupations - Food preparation and serving related occupations (%)
Most Common Occupations - Building and grounds cleaning and maintenance occupations (%)
Most Common Occupations - Personal care and service occupations (%)
Most Common Occupations - Sales and office occupations (%)
Most Common Occupations - Sales and related occupations (%)
Most Common Occupations - Office and administrative support occupations (%)
Most Common Occupations - Natural resources, construction, and maintenance occupations (%)
Most Common Occupations - Farming, fishing, and forestry occupations (%)
Most Common Occupations - Construction and extraction occupations (%)
Most Common Occupations - Installation, maintenance, and repair occupations (%)
Most Common Occupations - Production, transportation, and material moving occupations (%)
Most Common Occupations - Production occupations (%)
Most Common Occupations - Transportation occupations (%)
Most Common Occupations - Material moving occupations (%)
People in Group quarters - Institutionalized population (%)
People in Group quarters - Correctional institutions (%)
People in Group quarters - Federal prisons and detention centers (%)
People in Group quarters - Halfway houses (%)
People in Group quarters - Local jails and other confinement facilities (including police lockups) (%)
People in Group quarters - Military disciplinary barracks (%)
People in Group quarters - State prisons (%)
People in Group quarters - Other types of correctional institutions (%)
People in Group quarters - Nursing homes (%)
People in Group quarters - Hospitals/wards, hospices, and schools for the handicapped (%)
People in Group quarters - Hospitals/wards and hospices for chronically ill (%)
People in Group quarters - Hospices or homes for chronically ill (%)
People in Group quarters - Military hospitals or wards for chronically ill (%)
People in Group quarters - Other hospitals or wards for chronically ill (%)
People in Group quarters - Hospitals or wards for drug/alcohol abuse (%)
People in Group quarters - Mental (Psychiatric) hospitals or wards (%)
People in Group quarters - Schools, hospitals, or wards for the mentally retarded (%)
People in Group quarters - Schools, hospitals, or wards for the physically handicapped (%)
People in Group quarters - Institutions for the deaf (%)
People in Group quarters - Institutions for the blind (%)
People in Group quarters - Orthopedic wards and institutions for the physically handicapped (%)
People in Group quarters - Wards in general hospitals for patients who have no usual home elsewhere (%)
People in Group quarters - Wards in military hospitals for patients who have no usual home elsewhere (%)
People in Group quarters - Juvenile institutions (%)
People in Group quarters - Long-term care (%)
People in Group quarters - Homes for abused, dependent, and neglected children (%)
People in Group quarters - Residential treatment centers for emotionally disturbed children (%)
People in Group quarters - Training schools for juvenile delinquents (%)
People in Group quarters - Short-term care, detention or diagnostic centers for delinquent children (%)
People in Group quarters - Type of juvenile institution unknown (%)
People in Group quarters - Noninstitutionalized population (%)
People in Group quarters - College dormitories (includes college quarters off campus) (%)
People in Group quarters - Military quarters (%)
People in Group quarters - On base (%)
People in Group quarters - Barracks, unaccompanied personnel housing (UPH), (Enlisted/Officer), ;and similar group living quarters for military personnel (%)
People in Group quarters - Transient quarters for temporary residents (%)
People in Group quarters - Military ships (%)
People in Group quarters - Group homes (%)
People in Group quarters - Homes or halfway houses for drug/alcohol abuse (%)
People in Group quarters - Homes for the mentally ill (%)
People in Group quarters - Homes for the mentally retarded (%)
People in Group quarters - Homes for the physically handicapped (%)
People in Group quarters - Other group homes (%)
People in Group quarters - Religious group quarters (%)
People in Group quarters - Dormitories (%)
People in Group quarters - Agriculture workers' dormitories on farms (%)
People in Group quarters - Job Corps and vocational training facilities (%)
People in Group quarters - Other workers' dormitories (%)
People in Group quarters - Crews of maritime vessels (%)
People in Group quarters - Other nonhousehold living situations (%)
People in Group quarters - Other noninstitutional group quarters (%)
Residents speaking English at home (%)
Residents speaking English at home - Born in the United States (%)
Residents speaking English at home - Native, born elsewhere (%)
Residents speaking English at home - Foreign born (%)
Residents speaking Spanish at home (%)
Residents speaking Spanish at home - Born in the United States (%)
Residents speaking Spanish at home - Native, born elsewhere (%)
Residents speaking Spanish at home - Foreign born (%)
Residents speaking other language at home (%)
Residents speaking other language at home - Born in the United States (%)
Residents speaking other language at home - Native, born elsewhere (%)
Residents speaking other language at home - Foreign born (%)
Class of Workers - Employee of private company (%)
Class of Workers - Self-employed in own incorporated business (%)
Class of Workers - Private not-for-profit wage and salary workers (%)
Class of Workers - Local government workers (%)
Class of Workers - State government workers (%)
Class of Workers - Federal government workers (%)
Class of Workers - Self-employed workers in own not incorporated business and Unpaid family workers (%)
House heating fuel used in houses and condos - Utility gas (%)
House heating fuel used in houses and condos - Bottled, tank, or LP gas (%)
House heating fuel used in houses and condos - Electricity (%)
House heating fuel used in houses and condos - Fuel oil, kerosene, etc. (%)
House heating fuel used in houses and condos - Coal or coke (%)
House heating fuel used in houses and condos - Wood (%)
House heating fuel used in houses and condos - Solar energy (%)
House heating fuel used in houses and condos - Other fuel (%)
House heating fuel used in houses and condos - No fuel used (%)
House heating fuel used in apartments - Utility gas (%)
House heating fuel used in apartments - Bottled, tank, or LP gas (%)
House heating fuel used in apartments - Electricity (%)
House heating fuel used in apartments - Fuel oil, kerosene, etc. (%)
House heating fuel used in apartments - Coal or coke (%)
House heating fuel used in apartments - Wood (%)
House heating fuel used in apartments - Solar energy (%)
House heating fuel used in apartments - Other fuel (%)
House heating fuel used in apartments - No fuel used (%)
Armed forces status - In Armed Forces (%)
Armed forces status - Civilian (%)
Armed forces status - Civilian - Veteran (%)
Armed forces status - Civilian - Nonveteran (%)
Fatal accidents locations in years 2005-2021
Fatal accidents locations in 2005
Fatal accidents locations in 2006
Fatal accidents locations in 2007
Fatal accidents locations in 2008
Fatal accidents locations in 2009
Fatal accidents locations in 2010
Fatal accidents locations in 2011
Fatal accidents locations in 2012
Fatal accidents locations in 2013
Fatal accidents locations in 2014
Fatal accidents locations in 2015
Fatal accidents locations in 2016
Fatal accidents locations in 2017
Fatal accidents locations in 2018
Fatal accidents locations in 2019
Fatal accidents locations in 2020
Fatal accidents locations in 2021
Alcohol use - People drinking some alcohol every month (%)
Alcohol use - People not drinking at all (%)
Alcohol use - Average days/month drinking alcohol
Alcohol use - Average drinks/week
Alcohol use - Average days/year people drink much
Audiometry - Average condition of hearing (%)
Audiometry - People that can hear a whisper from across a quiet room (%)
Audiometry - People that can hear normal voice from across a quiet room (%)
Audiometry - Ears ringing, roaring, buzzing (%)
Audiometry - Had a job exposure to loud noise (%)
Audiometry - Had off-work exposure to loud noise (%)
Blood Pressure & Cholesterol - Has high blood pressure (%)
Blood Pressure & Cholesterol - Checking blood pressure at home (%)
Blood Pressure & Cholesterol - Frequently checking blood cholesterol (%)
Blood Pressure & Cholesterol - Has high cholesterol level (%)
Consumer Behavior - Money monthly spent on food at supermarket/grocery store
Consumer Behavior - Money monthly spent on food at other stores
Consumer Behavior - Money monthly spent on eating out
Consumer Behavior - Money monthly spent on carryout/delivered foods
Consumer Behavior - Income spent on food at supermarket/grocery store (%)
Consumer Behavior - Income spent on food at other stores (%)
Consumer Behavior - Income spent on eating out (%)
Consumer Behavior - Income spent on carryout/delivered foods (%)
Current Health Status - General health condition (%)
Current Health Status - Blood donors (%)
Current Health Status - Has blood ever tested for HIV virus (%)
Current Health Status - Left-handed people (%)
Dermatology - People using sunscreen (%)
Diabetes - Diabetics (%)
Diabetes - Had a blood test for high blood sugar (%)
Diabetes - People taking insulin (%)
Diet Behavior & Nutrition - Diet health (%)
Diet Behavior & Nutrition - Milk product consumption (# of products/month)
Diet Behavior & Nutrition - Meals not home prepared (#/week)
Diet Behavior & Nutrition - Meals from fast food or pizza place (#/week)
Diet Behavior & Nutrition - Ready-to-eat foods (#/month)
Diet Behavior & Nutrition - Frozen meals/pizza (#/month)
Drug Use - People that ever used marijuana or hashish (%)
Drug Use - Ever used hard drugs (%)
Drug Use - Ever used any form of cocaine (%)
Drug Use - Ever used heroin (%)
Drug Use - Ever used methamphetamine (%)
Health Insurance - People covered by health insurance (%)
Kidney Conditions-Urology - Avg. # of times urinating at night
Medical Conditions - People with asthma (%)
Medical Conditions - People with anemia (%)
Medical Conditions - People with psoriasis (%)
Medical Conditions - People with overweight (%)
Medical Conditions - Elderly people having difficulties in thinking or remembering (%)
Medical Conditions - People who ever received blood transfusion (%)
Medical Conditions - People having trouble seeing even with glass/contacts (%)
Medical Conditions - People with arthritis (%)
Medical Conditions - People with gout (%)
Medical Conditions - People with congestive heart failure (%)
Medical Conditions - People with coronary heart disease (%)
Medical Conditions - People with angina pectoris (%)
Medical Conditions - People who ever had heart attack (%)
Medical Conditions - People who ever had stroke (%)
Medical Conditions - People with emphysema (%)
Medical Conditions - People with thyroid problem (%)
Medical Conditions - People with chronic bronchitis (%)
Medical Conditions - People with any liver condition (%)
Medical Conditions - People who ever had cancer or malignancy (%)
Mental Health - People who have little interest in doing things (%)
Mental Health - People feeling down, depressed, or hopeless (%)
Mental Health - People who have trouble sleeping or sleeping too much (%)
Mental Health - People feeling tired or having little energy (%)
Mental Health - People with poor appetite or overeating (%)
Mental Health - People feeling bad about themself (%)
Mental Health - People who have trouble concentrating on things (%)
Mental Health - People moving or speaking slowly or too fast (%)
Mental Health - People having thoughts they would be better off dead (%)
Oral Health - Average years since last visit a dentist
Oral Health - People embarrassed because of mouth (%)
Oral Health - People with gum disease (%)
Oral Health - General health of teeth and gums (%)
Oral Health - Average days a week using dental floss/device
Oral Health - Average days a week using mouthwash for dental problem
Oral Health - Average number of teeth
Pesticide Use - Households using pesticides to control insects (%)
Pesticide Use - Households using pesticides to kill weeds (%)
Physical Activity - People doing vigorous-intensity work activities (%)
Physical Activity - People doing moderate-intensity work activities (%)
Physical Activity - People walking or bicycling (%)
Physical Activity - People doing vigorous-intensity recreational activities (%)
Physical Activity - People doing moderate-intensity recreational activities (%)
Physical Activity - Average hours a day doing sedentary activities
Physical Activity - Average hours a day watching TV or videos
Physical Activity - Average hours a day using computer
Physical Functioning - People having limitations keeping them from working (%)
Physical Functioning - People limited in amount of work they can do (%)
Physical Functioning - People that need special equipment to walk (%)
Physical Functioning - People experiencing confusion/memory problems (%)
Physical Functioning - People requiring special healthcare equipment (%)
Prescription Medications - Average number of prescription medicines taking
Preventive Aspirin Use - Adults 40+ taking low-dose aspirin (%)
Reproductive Health - Vaginal deliveries (%)
Reproductive Health - Cesarean deliveries (%)
Reproductive Health - Deliveries resulted in a live birth (%)
Reproductive Health - Pregnancies resulted in a delivery (%)
Reproductive Health - Women breastfeeding newborns (%)
Reproductive Health - Women that had a hysterectomy (%)
Reproductive Health - Women that had both ovaries removed (%)
Reproductive Health - Women that have ever taken birth control pills (%)
Reproductive Health - Women taking birth control pills (%)
Reproductive Health - Women that have ever used Depo-Provera or injectables (%)
Reproductive Health - Women that have ever used female hormones (%)
Sexual Behavior - People 18+ that ever had sex (vaginal, anal, or oral) (%)
Sexual Behavior - Males 18+ that ever had vaginal sex with a woman (%)
Sexual Behavior - Males 18+ that ever performed oral sex on a woman (%)
Sexual Behavior - Males 18+ that ever had anal sex with a woman (%)
Sexual Behavior - Males 18+ that ever had any sex with a man (%)
Sexual Behavior - Females 18+ that ever had vaginal sex with a man (%)
Sexual Behavior - Females 18+ that ever performed oral sex on a man (%)
Sexual Behavior - Females 18+ that ever had anal sex with a man (%)
Sexual Behavior - Females 18+ that ever had any kind of sex with a woman (%)
Sexual Behavior - Average age people first had sex
Sexual Behavior - Average number of female sex partners in lifetime (males 18+)
Sexual Behavior - Average number of female vaginal sex partners in lifetime (males 18+)
Sexual Behavior - Average age people first performed oral sex on a woman (18+)
Sexual Behavior - Average number of woman performed oral sex on in lifetime (18+)
Sexual Behavior - Average number of male sex partners in lifetime (males 18+)
Sexual Behavior - Average number of male anal sex partners in lifetime (males 18+)
Sexual Behavior - Average age people first performed oral sex on a man (18+)
Sexual Behavior - Average number of male oral sex partners in lifetime (18+)
Sexual Behavior - People using protection when performing oral sex (%)
Sexual Behavior - Average number of times people have vaginal or anal sex a year
Sexual Behavior - People having sex without condom (%)
Sexual Behavior - Average number of male sex partners in lifetime (females 18+)
Sexual Behavior - Average number of male vaginal sex partners in lifetime (females 18+)
Sexual Behavior - Average number of female sex partners in lifetime (females 18+)
Sexual Behavior - Circumcised males 18+ (%)
Sleep Disorders - Average hours sleeping at night
Sleep Disorders - People that has trouble sleeping (%)
Smoking-Cigarette Use - People smoking cigarettes (%)
Taste & Smell - People 40+ having problems with smell (%)
Taste & Smell - People 40+ having problems with taste (%)
Taste & Smell - People 40+ that ever had wisdom teeth removed (%)
Taste & Smell - People 40+ that ever had tonsils teeth removed (%)
Taste & Smell - People 40+ that ever had a loss of consciousness because of a head injury (%)
Taste & Smell - People 40+ that ever had a broken nose or other serious injury to face or skull (%)
Taste & Smell - People 40+ that ever had two or more sinus infections (%)
Weight - Average height (inches)
Weight - Average weight (pounds)
Weight - Average BMI
Weight - People that are obese (%)
Weight - People that ever were obese (%)
Weight - People trying to lose weight (%)
Urban population: 44,733
Rural population: 574
Estimated median house/condo value in 2022: $1,264,688
95148:
$1,264,688California:
$715,900
Median resident age: This zip code:
41.7 yearsCalifornia median age:
37.9 years
Average household size: This zip code:
3.7 peopleCalifornia:
2.8 people
Averages for the 2020 tax year for zip code 95148, filed in 2021:
Average Adjusted Gross Income (AGI) in 2020: $107,783 (Individual Income Tax Returns) Here:
$107,783State:
$95,910
Salary/wage: $97,629 (reported on 84.8% of returns )Here:
$97,629State:
$77,331
(% of AGI for various income ranges: 1114.0% for AGIs below $25k , 3935.0% for AGIs $25k-50k , 7606.9% for AGIs $50k-75k , 11269.5% for AGIs $75k-100k , 22440.4% for AGIs $100k-200k , 127110.5% for AGIs over 200k ) Taxable interest for individuals: $1,404 (reported on 39.5% of returns )This zip code:
$1,404California:
$2,294
(% of AGI for various income ranges: 17.0% for AGIs below $25k , 26.2% for AGIs $25k-50k , 39.7% for AGIs $50k-75k , 68.1% for AGIs $75k-100k , 152.0% for AGIs $100k-200k , 845.2% for AGIs over 200k ) Ordinary dividends: $4,461 (reported on 26.2% of returns )(% of AGI for various income ranges: 15.6% for AGIs below $25k , 28.6% for AGIs $25k-50k , 53.0% for AGIs $50k-75k , 89.9% for AGIs $75k-100k , 269.4% for AGIs $100k-200k , 2309.9% for AGIs over 200k ) Net capital gain/loss in AGI: +$28,585 (reported on 28.1% of returns )Here:
+$28,585State:
+$49,306
(% of AGI for various income ranges: 10.6% for AGIs below $25k , 47.4% for AGIs $25k-50k , 104.4% for AGIs $50k-75k , 218.1% for AGIs $75k-100k , 729.2% for AGIs $100k-200k , 21344.7% for AGIs over 200k ) Profit/loss from business: +$13,766 (reported on 15.1% of returns )Here:
+$13,766State:
+$15,671
(% of AGI for various income ranges: 109.3% for AGIs below $25k , 197.2% for AGIs $25k-50k , 152.2% for AGIs $50k-75k , 316.3% for AGIs $75k-100k , 546.9% for AGIs $100k-200k , 2470.1% for AGIs over 200k ) Taxable individual retirement arrangement distribution: $24,160 (reported on 5.4% of returns )95148:
$24,160California:
$23,505
(% of AGI for various income ranges: 39.6% for AGIs below $25k , 64.9% for AGIs $25k-50k , 91.2% for AGIs $50k-75k , 249.9% for AGIs $75k-100k , 530.3% for AGIs $100k-200k , 1354.4% for AGIs over 200k ) Self-employed (Keogh) retirement plans: $21,907 (reported on 0.6% of returns )95148:
$21,907California:
$30,163
(% of AGI for various income ranges: 14.7% for AGIs $50k-75k , 37.8% for AGIs $100k-200k , 256.4% for AGIs over 200k ) Total itemized deductions: $33,797 (reported on 18.6% of returns )Here:
$33,797State:
$39,517
(% of AGI for various income ranges: 82.4% for AGIs below $25k , 272.6% for AGIs $25k-50k , 470.6% for AGIs $50k-75k , 1153.4% for AGIs $75k-100k , 2218.7% for AGIs $100k-200k , 8246.4% for AGIs over 200k ) Charity contributions: $5,848 (reported on 15.2% of returns )(% of AGI for various income ranges: 4.0% for AGIs below $25k , 20.8% for AGIs $25k-50k , 53.3% for AGIs $50k-75k , 125.5% for AGIs $75k-100k , 276.9% for AGIs $100k-200k , 1464.7% for AGIs over 200k ) Taxes paid: $9,439 (reported on 18.6% of returns )(% of AGI for various income ranges: 23.9% for AGIs below $25k , 71.5% for AGIs $25k-50k , 139.2% for AGIs $50k-75k , 358.2% for AGIs $75k-100k , 664.8% for AGIs $100k-200k , 2090.6% for AGIs over 200k ) Earned income credit: $1,735 (reported on 9.6% of returns )(% of AGI for various income ranges: 60.5% for AGIs below $25k , 47.1% for AGIs $25k-50k , 0.4% for AGIs $50k-75k ) Percentage of individuals using paid preparers for their 2020 taxes: 90.2%(% for various income ranges: 88.3% for AGIs below $25k , 90.7% for AGIs $25k-50k , 91.1% for AGIs $50k-75k , 90.3% for AGIs $75k-100k , 89.9% for AGIs $100k-200k , 92.6% for AGIs over 200k )
Averages for the 2012 tax year for zip code 95148, filed in 2013:
Average Adjusted Gross Income (AGI) in 2012: $74,604 (Individual Income Tax Returns) Here:
$74,604State:
$72,726
Salary/wage: $69,539 (reported on 87.4% of returns )Here:
$69,539State:
$59,079
(% of AGI for various income ranges: 77.0% for AGIs below $25k , 84.0% for AGIs $25k-50k , 83.2% for AGIs $50k-75k , 82.1% for AGIs $75k-100k , 85.2% for AGIs $100k-200k , 77.0% for AGIs over 200k ) Taxable interest for individuals: $762 (reported on 39.7% of returns )This zip code:
$762California:
$2,146
(% of AGI for various income ranges: 0.7% for AGIs below $25k , 0.4% for AGIs $25k-50k , 0.4% for AGIs $50k-75k , 0.4% for AGIs $75k-100k , 0.4% for AGIs $100k-200k , 0.4% for AGIs over 200k ) Ordinary dividends: $3,250 (reported on 20.6% of returns )(% of AGI for various income ranges: 0.6% for AGIs below $25k , 0.5% for AGIs $25k-50k , 0.5% for AGIs $50k-75k , 0.6% for AGIs $75k-100k , 0.7% for AGIs $100k-200k , 1.5% for AGIs over 200k ) Net capital gain/loss in AGI: +$8,239 (reported on 21.4% of returns )Here:
+$8,239State:
+$30,460
(% of AGI for various income ranges: 0.7% for AGIs $100k-200k , 6.9% for AGIs over 200k ) Profit/loss from business: +$16,921 (reported on 16.2% of returns )Here:
+$16,921State:
+$17,064
(% of AGI for various income ranges: 11.6% for AGIs below $25k , 6.0% for AGIs $25k-50k , 4.4% for AGIs $50k-75k , 3.1% for AGIs $75k-100k , 2.6% for AGIs $100k-200k , 2.6% for AGIs over 200k ) Taxable individual retirement arrangement distribution: $16,803 (reported on 5.5% of returns )95148:
$16,803California:
$19,557
(% of AGI for various income ranges: 1.6% for AGIs below $25k , 1.6% for AGIs $25k-50k , 1.8% for AGIs $50k-75k , 1.9% for AGIs $75k-100k , 1.2% for AGIs $100k-200k , 0.7% for AGIs over 200k ) Self-employment retirement plans: $20,154 (reported on 0.6% of returns )95148:
$20,154California:
$24,530
(% of AGI for various income ranges: 0.1% for AGIs $50k-75k , 0.2% for AGIs $100k-200k , 0.3% for AGIs over 200k ) Total itemized deductions: $31,984 (24% of AGI, reported on 41.8% of returns )Here:
$31,984State:
$34,004
Here:
23.7% of AGIState:
22.7% of AGI
(% of AGI for various income ranges: 11.0% for AGIs below $25k , 13.4% for AGIs $25k-50k , 17.9% for AGIs $50k-75k , 20.9% for AGIs $75k-100k , 21.0% for AGIs $100k-200k , 16.6% for AGIs over 200k ) Charity contributions: $2,614 (reported on 33.9% of returns )(% of AGI for various income ranges: 0.4% for AGIs below $25k , 0.8% for AGIs $25k-50k , 1.2% for AGIs $50k-75k , 1.5% for AGIs $75k-100k , 1.5% for AGIs $100k-200k , 1.0% for AGIs over 200k ) Taxes paid: $14,388 (reported on 41.7% of returns )95148:
$14,388State:
$14,448
(% of AGI for various income ranges: 2.9% for AGIs below $25k , 4.0% for AGIs $25k-50k , 5.9% for AGIs $50k-75k , 7.7% for AGIs $75k-100k , 9.2% for AGIs $100k-200k , 9.9% for AGIs over 200k ) Earned income credit: $2,011 (reported on 15.0% of returns )(% of AGI for various income ranges: 5.6% for AGIs below $25k , 1.0% for AGIs $25k-50k ) Percentage of individuals using paid preparers for their 2012 taxes: 63.6%(% for various income ranges: 62.1% for AGIs below $25k , 66.7% for AGIs $25k-50k , 67.2% for AGIs $50k-75k , 68.8% for AGIs $75k-100k , 60.5% for AGIs $100k-200k , 55.7% for AGIs over 200k )
Averages for the 2004 tax year for zip code 95148, filed in 2005:
Average Adjusted Gross Income (AGI) in 2004: $59,760 (Individual Income Tax Returns) Here:
$59,760State:
$58,600
Salary/wage: $57,730 (reported on 88.6% of returns )Here:
$57,730State:
$49,455
(% of AGI for various income ranges: 113.9% for AGIs below $10k , 80.0% for AGIs $10k-25k , 87.7% for AGIs $25k-50k , 87.9% for AGIs $50k-75k , 87.5% for AGIs $75k-100k , 84.0% for AGIs over 100k ) Taxable interest for individuals: $869 (reported on 48.6% of returns )This zip code:
$869California:
$2,365
(% of AGI for various income ranges: 3.3% for AGIs below $10k , 1.0% for AGIs $10k-25k , 0.6% for AGIs $25k-50k , 0.8% for AGIs $50k-75k , 0.5% for AGIs $75k-100k , 0.7% for AGIs over 100k ) Taxable dividends: $1,465 (reported on 21.6% of returns )(% of AGI for various income ranges: 1.7% for AGIs below $10k , 0.5% for AGIs $10k-25k , 0.3% for AGIs $25k-50k , 0.3% for AGIs $50k-75k , 0.5% for AGIs $75k-100k , 0.6% for AGIs over 100k ) Net capital gain/loss: +$7,502 (reported on 24.9% of returns )Here:
+$7,502State:
+$23,418
(% of AGI for various income ranges: -2.8% for AGIs below $10k , -0.2% for AGIs $10k-25k , -0.2% for AGIs $25k-50k , 0.2% for AGIs $50k-75k , 0.6% for AGIs $75k-100k , 6.0% for AGIs over 100k ) Profit/loss from business: +$15,901 (reported on 16.7% of returns )Here:
+$15,901State:
+$16,826
(% of AGI for various income ranges: 12.9% for AGIs below $10k , 9.2% for AGIs $10k-25k , 5.3% for AGIs $25k-50k , 4.7% for AGIs $50k-75k , 3.2% for AGIs $75k-100k , 3.8% for AGIs over 100k ) IRA payment deduction: $3,373 (reported on 2.4% of returns )95148:
$3,373California:
$3,192
(% of AGI for various income ranges: 0.2% for AGIs below $10k , 0.2% for AGIs $10k-25k , 0.2% for AGIs $25k-50k , 0.2% for AGIs $50k-75k , 0.2% for AGIs $75k-100k , 0.1% for AGIs over 100k ) Self-employed pension: $15,253 (reported on 0.8% of returns )Here:
$15,253California:
$17,688
(% of AGI for various income ranges: 0.1% for AGIs $25k-50k , 0.1% for AGIs $50k-75k , 0.1% for AGIs $75k-100k , 0.3% for AGIs over 100k ) Total itemized deductions: $29,060 (29% of AGI, reported on 47.2% of returns )Here:
$29,060State:
$28,113
Here:
29.3% of AGIState:
25.3% of AGI
(% of AGI for various income ranges: 23.8% for AGIs below $10k , 15.1% for AGIs $10k-25k , 21.3% for AGIs $25k-50k , 27.1% for AGIs $50k-75k , 28.0% for AGIs $75k-100k , 21.7% for AGIs over 100k ) Charity contributions deductions: $2,480 (2% of AGI, reported on 41.3% of returns )Here:
2.4% of AGIState:
3.3% of AGI
(% of AGI for various income ranges: 0.8% for AGIs below $10k , 0.8% for AGIs $10k-25k , 1.4% for AGIs $25k-50k , 2.0% for AGIs $50k-75k , 2.2% for AGIs $75k-100k , 1.7% for AGIs over 100k ) Total tax: $8,801 (reported on 78.3% of returns )95148:
$8,801State:
$10,761
(% of AGI for various income ranges: 5.1% for AGIs below $10k , 4.6% for AGIs $10k-25k , 6.6% for AGIs $25k-50k , 7.9% for AGIs $50k-75k , 8.7% for AGIs $75k-100k , 15.5% for AGIs over 100k ) Earned income credit: $1,567 (reported on 12.1% of returns )Percentage of individuals using paid preparers for their 2004 taxes: 63.4%(% for various income ranges: 55.8% for AGIs below $10k , 65.8% for AGIs $10k-25k , 68.0% for AGIs $25k-50k , 69.0% for AGIs $50k-75k , 66.7% for AGIs $75k-100k , 56.6% for AGIs over 100k )
Estimated median household income in 2022: This zip code:
$157,954California:
$91,551
Nearest zip codes: 95127 ,
95121 ,
95122 ,
95111 ,
95116 ,
95133 .
San Jose Zip Code Map
Percentage of family households: This zip code:
49.9%California:
46.8%
Percentage of households with unmarried partners: This zip code:
3.8%California:
48.1%
Likely homosexual households (counted as self-reported same-sex unmarried-partner households)
Lesbian couples: 0.0% of all households Gay men: 0.1% of all households
Household received Food Stamps/SNAP in the past 12 months: 1,007Household did not receive Food Stamps/SNAP in the past 12 months: 11,000
Women who had a birth in the past 12 months: 358 (331 now married , 25 unmarried) Women who did not have a birth in the past 12 months: 10,608 (4,472 now married , 6,124 unmarried)
Housing units in zip code 95148 with a mortgage: 6,396 (814
second mortgage , 84
home equity loan , 661
both second mortgage and home equity loan )
Houses without a mortgage: 109
Median monthly owner costs for units with a mortgage: $3,797
Median monthly owner costs for units without a mortgage: $1,173
Residents with income below the poverty level in 2022:
This zip code:
6.6%Whole state:
12.2%
Residents with income below 50% of the poverty level in 2022:
This zip code:
3.5%Whole state:
6.2%
Median number of rooms in houses and condos: Median number of rooms in apartments:
Year house built (houses)
13 2020 or later153 2010 to 20191,095 2000 to 2009968 1990 to 19994,140 1980 to 19893,125 1970 to 19791,837 1960 to 1969367 1950 to 1959263 1940 to 1949179 1939 or earlier
Zip code 95148 household income distribution in 2022 200 Less than $10,000120 $10,000 to $14,999172 $15,000 to $19,999131 $20,000 to $24,999142 $25,000 to $29,999115 $30,000 to $34,999288 $35,000 to $39,999212 $40,000 to $44,99938 $45,000 to $49,999339 $50,000 to $59,999545 $60,000 to $74,9991,059 $75,000 to $99,9991,106 $100,000 to $124,9991,187 $125,000 to $149,9991,772 $150,000 to $199,9994,700 $200,000 or moreEstimate of home value of owner-occupied houses/condos in 2022 in zip code 95148 17 Less than $10,00014 $10,000 to $14,9993 $15,000 to $19,99926 $35,000 to $39,99915 $40,000 to $49,99917 $70,000 to $79,99928 $80,000 to $89,99932 $90,000 to $99,99945 $100,000 to $124,99913 $125,000 to $149,99920 $175,000 to $199,99932 $200,000 to $249,99916 $250,000 to $299,99938 $300,000 to $399,99928 $400,000 to $499,999410 $500,000 to $749,9992,377 $750,000 to $999,9994,746 $1,000,000 to $1,499,9991,641 $1,500,000 to $1,999,9991,175 $2,000,000 or moreRent paid by renters in 2022 in zip code 95148 16 $200 to $24935 $400 to $44919 $500 to $5497 $650 to $69941 $750 to $799125 $1,000 to $1,249104 $1,250 to $1,499123 $1,500 to $1,999372 $2,000 to $2,499302 $2,500 to $2,999489 $3,000 to $3,499550 $3,500 or more302 No cash rent
Median gross rent in 2022: $3,071.
Median price asked for vacant for-sale houses and condos in 2022: $1,684,918.
Estimated median house (or condo) value in 2022 for: White Non-Hispanic householders: $1,284,865Black or African American householders: $1,297,232American Indian or Alaska Native householders: $1,396,819Asian householders: $1,309,599Native Hawaiian and other Pacific Islander householders: $1,072,023Some other race householders: $1,187,556Two or more races householders: $1,403,979Hispanic or Latino householders: $1,188,533Estimated median house or condo value in 2022: $1,264,688
95148:
$1,264,688California:
$715,900
Lower value quartile - upper value quartile: $1,039,686 - $1,607,370
Mean price in 2022: Detached houses: $1,466,280Here:
$1,466,280State:
$988,808
Townhouses or other attached units: $1,034,807Here:
$1,034,807State:
$838,546
In 2-unit structures: $3,206,995Here:
$3,206,995State:
$1,138,100
Mobile homes: $531,787Here:
$531,787State:
$184,506
Housing units in structures:
One, detached: 11,075One, attached: 730Two: 253 or 4: 525 to 9: 7610 to 19: 13020 to 49: 4850 or more: 35Mobile homes: 188Unemployment : 4.3%
Means of transportation to work in zip code 95148 68.8% 15,462 Drove a car alone13.2% 2,962 Carpooled0.5% 108 Bus or trolley bus0.1% 14 Streetcar or trolley car0.4% 90 Subway or elevated0.1% 18 Railroad0.1% 23 Motorcycle0.1% 24 Bicycle0.3% 59 Walked0.6% 129 Other means16.2% 3,651 Worked at homeTravel time to work (commute) in zip code 95148 104 Less than 5 minutes465 5 to 9 minutes843 10 to 14 minutes2,311 15 to 19 minutes3,122 20 to 24 minutes1,813 25 to 29 minutes4,284 30 to 34 minutes655 35 to 39 minutes1,078 40 to 44 minutes2,256 45 to 59 minutes1,279 60 to 89 minutes568 90 or more minutes
Neighborhoods in zip code 95148: Percentage of zip code residents living and working in this county: 90.2%
Household type by relationship:
Households: 45,308
Male householders: 7,507 (779 living alone ), Female householders: 4,590 (355 living alone )8,292 spouses (8,253 opposite-sex spouses ), 420 unmarried partners , (400 opposite-sex unmarried partners ), 14,641 children (14,006 natural , 277 adopted , 361 stepchildren ), 1,395 grandchildren , 1,021 brothers or sisters , 2,622 parents , 0 foster children , 2,033 other relatives , 2,127 non-relatives In group quarters: 391 (-1 institutionalized population )
Size of family households: 2,364 2-persons , 2,646 3-persons , 2,482 4-persons , 1,542 5-persons , 855 6-persons , 627 7-or-more-persons
Size of nonfamily households: 1,129 1-person , 162 2-persons , 55 3-persons , 38 4-persons , 9 5-persons , 9 6-persons , 69 7-or-more-persons
6,248 married couples with children. single-parent households (334 men , 591 women ).
30.7% of residents of 95148 zip code speak English at home. of residents speak Spanish at home (65% very well, 18% well, 13% not well, 4% not at all ).of residents speak other Indo-European language at home (74% very well, 18% well, 6% not well, 2% not at all ).of residents speak Asian or Pacific Island language at home (48% very well, 29% well, 19% not well, 3% not at all ).of residents speak other language at home (90% very well, 7% well, 4% not at all ).
Foreign born population: 22,236 (49.1%)
(74.9%
of them are naturalized citizens )
This zip code:
49.1%Whole state:
26.7%
40% Thailand 14% Bhutan 13% Malaysia 11% Honduras 2% Italy 2% Hong Kong 1% Costa Rica 3% Portuguese 1% German 1% Dutch 1% English 1% American 0% Irish 0% Italian
Year of entry for the foreign-born population
4,381 2010 or later 4,169 2000 to 2009 5,457 1990 to 1999 9,122 Before 1990
There are
89 Medical Specialists in Zip Code 95148 .
Facilities with environmental interests located in this zip code:
CHEVRON STATION NO 92620 (2801 S WHITE RD in SAN JOSE, CA)
STATE MASTER (California - Hazardous Waste Tracking) - HAZARDOU WASTE PROGRAM Small Quantity Generators, between 100 kg and 1000 kg of hazardous waste/month (Resource Conservation and Recovery Act (tracking hazardous waste)) - notification Organizations: CHEVRON PRODUCTS CO (CONTACT/OWNER)
EVERGREEN VALLEY HIGH SCHOOL (3300 QUIMBY ROAD in SAN JOSE, CA)
(National Center for Education Statistics) - STATE ID-4330692 Organizations: EAST SIDE UNION HIGH (SCHOOL DISTRICT)
FOOTHILL INTERMEDIATE (1966 FLINT AVE. in SAN JOSE, CA)
(National Center for Education Statistics) - STATE ID-6048045 Organizations: MT. PLEASANT ELEMENTARY (SCHOOL DISTRICT)
HOLLY OAK ELEMENTARY (2995 ROSSMORE WAY in SAN JOSE, CA)
(National Center for Education Statistics) - STATE ID-6047146 Organizations: EVERGREEN ELEMENTARY (SCHOOL DISTRICT)
MILLBROOK ELEMENTARY (3200 MILLBROOK DR. in SAN JOSE, CA)
(National Center for Education Statistics) - STATE ID-6105787 Organizations: EVERGREEN ELEMENTARY (SCHOOL DISTRICT)
NORWOOD CREEK ELEMENTARY (3241 REMINGTON WAY in SAN JOSE, CA)
(National Center for Education Statistics) - STATE ID-6102081 Organizations: EVERGREEN ELEMENTARY (SCHOOL DISTRICT)
CEDAR GROVE ELEMENTARY (2702 SUGAR PLUM DR. in SAN JOSE, CA)
(National Center for Education Statistics) - STATE ID-6067193 Organizations: EVERGREEN ELEMENTARY (SCHOOL DISTRICT)
GEE BEE AERO, INC (2502 JOHN MONTGOMERY DR in SAN JOSE, CA)
Small Quantity Generators, between 100 kg and 1000 kg of hazardous waste/month (Resource Conservation and Recovery Act (tracking hazardous waste))
M&N PROPERTIES (3701 NORWOOD AVE. in SAN JOSE, CA)
COMPLIANCE ACTIVITY (Tracking inspections of insecticide, fungicide, and rodenticide, and toxic substances)
EVERGREEEN CLEANERS (3281 SOUTH WHITE ROAD in SAN JOSE, CA)
CRITERIA AND HAZARDOUS AIR POLLUTANT INVENTORY (Inventory of air pollution sources) Business SIC classification: DRYCLEANING PLANTS, EXCEPT RUG CLEANING
Housing units lacking complete kitchen facilities: 0.8%
69.1% Utility gas 24.2% Electricity 3.0% Bottled, tank, or LP gas 1.8% No fuel used 1.6% Solar energy
Population in 1990: 37,413. Population change in the 1990s: +6,682 (+17.9%).
Place of birth for U.S.-born residents:
This state: 19,640Northeast: 506Midwest: 504South: 969West: 536
64% of the 95148 zip code residents lived in the same house 5 years ago.
Out of people who lived in different houses, 84% lived in this county.
Out of people who lived in different counties, 50% lived in California.
96% of the 95148 zip code residents lived in the same house 1 year ago.
Out of people who lived in different houses, 77% moved from this county.
Out of people who lived in different houses, 18% moved from different county within same state.
Out of people who lived in different houses, 3% moved from different state.
Out of people who lived in different houses, 8% moved from abroad.
Private vs. public school enrollment:
Students in private schools in grades 1 to 8 (elementary and middle school): 339
Here:
8.5%California:
10.5%
Students in private schools in grades 9 to 12 (high school): 302
Here:
10.8%California:
8.5%
Students in private undergraduate colleges: 217
Here:
6.2%California:
15.9%
Occupation by median earnings in the past 12 months ($)
197,502 Legal occupations 138,629 Computer and mathematical occupations 122,242 Health diagnosing and treating practitioners and other technical occupations 117,166 Architecture and engineering occupations 94,091 Life, physical, and social science occupations 89,096 Management occupations
Companies with federal contracts located in this zip code:
EXETER CONSTRUCTION AND ENGINE (3402 BELGROVE CIR in SAN JOSE, CA; small business) in 2 contracts in 2001
$400,000 with Navy for Maintenance, Repair or Alteration of Real Property -- Other Utilities. Signed on 2001-07-09. Completion date: 1995-07-24.
, same as above. Signed on 2001-07-09. Completion date: 1995-07-24.
PAC SYSTEMS (2507 BUCKHILL CT in SAN JOSE, CA; small business)
$8,565 with Navy for Maintenance, Repair and Rebuilding of Equipment -- Special Industry Machinery. Taking place in HI. Signed on 2005-01-31. Completion date: 2005-02-17.
Top industries in this zip code by the number of employees in 2005:
Construction: Masonry Contractors (500-999 employees: 1 establishment)Accommodation and Food Services: Limited-Service Restaurants (50-99: 1, 20-49: 4, 10-19: 2, 5-9: 3, 1-4: 5)Health Care and Social Assistance: Offices of Dentists (20-49: 1, 10-19: 4, 5-9: 9, 1-4: 7)Health Care and Social Assistance: Other Individual and Family Services (100-249: 1, 1-4: 1)Accommodation and Food Services: Snack and Nonalcoholic Beverage Bars (50-99: 1, 20-49: 1, 5-9: 2, 1-4: 5)Accommodation and Food Services: Full-Service Restaurants (20-49: 1, 10-19: 2, 5-9: 4, 1-4: 2)Educational Services: Flight Training (20-49: 2, 5-9: 2, 1-4: 1)
People in group quarters in 2010:
90 people in workers' group living quarters and job corps centers
63 people in group homes intended for adults
25 people in residential treatment centers for adults
13 people in group homes for juveniles (non-correctional)
People in group quarters in 2000:
25 people in homes for the mentally retarded
11 people in other group homes
3 people in other noninstitutional group quarters
Fatal accident statistics in 2012:
Fatal accident count: 2Vehicles involved in fatal accidents: 2Fatal accidents caused by drunken drivers: 1Fatalities: 2Persons involved in fatal accidents: 4Pedestrians involved in fatal accidents: 1
Fatal accident statistics in 2011:
Fatal accident count: 1Vehicles involved in fatal accidents: 1Fatal accidents caused by drunken drivers: 0Fatalities: 1Persons involved in fatal accidents: 1Pedestrians involved in fatal accidents: 1
Home Mortgage Disclosure Act Aggregated Statistics For Year 2009(Based on 12 full and 6 partial tracts) A) FHA, FSA/RHS & VA B) Conventional C) Refinancings D) Home Improvement Loans F) Non-occupant Loans on G) Loans On Manufactured Number Average Value Number Average Value Number Average Value Number Average Value Number Average Value Number Average Value
LOANS ORIGINATED 107 $413,707 567 $374,968 2,149 $361,210 93 $270,750 125 $273,244 2 $82,270 APPLICATIONS APPROVED, NOT ACCEPTED 10 $422,811 87 $385,795 412 $395,011 8 $120,652 23 $264,724 0 $0 APPLICATIONS DENIED 20 $381,166 150 $359,886 645 $418,787 49 $157,975 54 $350,823 10 $84,450 APPLICATIONS WITHDRAWN 25 $422,931 82 $431,292 386 $384,387 6 $172,777 34 $288,340 0 $0 FILES CLOSED FOR INCOMPLETENESS 3 $373,603 18 $393,929 121 $404,881 1 $100,000 8 $297,738 0 $0
Aggregated Statistics For Year 2008(Based on 12 full and 6 partial tracts) A) FHA, FSA/RHS & VA B) Conventional C) Refinancings D) Home Improvement Loans F) Non-occupant Loans on G) Loans On Manufactured Number Average Value Number Average Value Number Average Value Number Average Value Number Average Value Number Average Value
LOANS ORIGINATED 23 $458,493 577 $407,152 1,121 $397,977 85 $247,955 98 $320,705 24 $64,106 APPLICATIONS APPROVED, NOT ACCEPTED 4 $475,380 198 $390,120 319 $413,411 27 $165,100 33 $277,897 20 $96,262 APPLICATIONS DENIED 17 $449,706 226 $378,057 722 $509,511 94 $272,951 71 $398,958 17 $125,813 APPLICATIONS WITHDRAWN 13 $430,618 129 $423,552 269 $443,288 37 $244,951 26 $371,097 0 $0 FILES CLOSED FOR INCOMPLETENESS 0 $0 38 $585,175 121 $477,794 14 $284,882 9 $299,869 0 $0
Aggregated Statistics For Year 2007(Based on 12 full and 6 partial tracts) B) Conventional C) Refinancings D) Home Improvement Loans F) Non-occupant Loans on G) Loans On Manufactured Number Average Value Number Average Value Number Average Value Number Average Value Number Average Value
LOANS ORIGINATED 645 $493,066 1,922 $472,729 207 $363,539 160 $413,676 16 $70,882 APPLICATIONS APPROVED, NOT ACCEPTED 211 $495,910 560 $476,532 54 $449,810 37 $408,682 11 $60,375 APPLICATIONS DENIED 410 $476,557 1,137 $512,712 180 $318,013 81 $414,854 42 $74,887 APPLICATIONS WITHDRAWN 96 $436,452 460 $469,658 44 $303,453 39 $414,253 2 $116,960 FILES CLOSED FOR INCOMPLETENESS 57 $436,219 173 $480,377 15 $308,923 21 $372,836 0 $0
Aggregated Statistics For Year 2006(Based on 12 full and 6 partial tracts) B) Conventional C) Refinancings D) Home Improvement Loans F) Non-occupant Loans on G) Loans On Manufactured Number Average Value Number Average Value Number Average Value Number Average Value Number Average Value
LOANS ORIGINATED 1,194 $484,671 2,577 $459,605 375 $357,002 221 $414,949 5 $73,402 APPLICATIONS APPROVED, NOT ACCEPTED 263 $474,803 609 $466,135 76 $347,114 54 $410,167 8 $62,144 APPLICATIONS DENIED 636 $464,037 1,118 $482,922 192 $276,578 99 $410,304 35 $71,989 APPLICATIONS WITHDRAWN 218 $478,611 594 $442,062 45 $304,572 47 $429,860 1 $650,000 FILES CLOSED FOR INCOMPLETENESS 84 $408,330 186 $430,426 24 $371,959 10 $267,242 0 $0
Aggregated Statistics For Year 2005(Based on 12 full and 6 partial tracts) B) Conventional C) Refinancings D) Home Improvement Loans F) Non-occupant Loans on G) Loans On Manufactured Number Average Value Number Average Value Number Average Value Number Average Value Number Average Value
LOANS ORIGINATED 1,662 $505,717 3,020 $434,231 371 $360,193 249 $401,064 13 $68,655 APPLICATIONS APPROVED, NOT ACCEPTED 389 $461,241 633 $444,385 73 $313,959 44 $462,640 21 $76,919 APPLICATIONS DENIED 632 $467,357 1,300 $475,498 171 $252,106 88 $429,186 42 $88,525 APPLICATIONS WITHDRAWN 288 $469,488 837 $422,324 99 $271,300 58 $399,034 2 $347,280 FILES CLOSED FOR INCOMPLETENESS 83 $517,973 286 $433,497 9 $271,303 16 $540,227 0 $0
Aggregated Statistics For Year 2004(Based on 12 full and 6 partial tracts) B) Conventional C) Refinancings D) Home Improvement Loans F) Non-occupant Loans on G) Loans On Manufactured Number Average Value Number Average Value Number Average Value Number Average Value Number Average Value
LOANS ORIGINATED 1,791 $418,538 3,848 $362,770 188 $274,050 272 $308,972 14 $65,491 APPLICATIONS APPROVED, NOT ACCEPTED 429 $429,968 901 $354,261 35 $194,319 60 $288,498 16 $96,266 APPLICATIONS DENIED 570 $443,205 1,353 $378,476 140 $223,998 87 $349,000 28 $76,137 APPLICATIONS WITHDRAWN 296 $392,580 882 $347,513 69 $220,556 57 $319,725 4 $83,758 FILES CLOSED FOR INCOMPLETENESS 76 $419,878 337 $369,062 14 $308,623 14 $404,106 0 $0
Aggregated Statistics For Year 2003(Based on 12 full and 6 partial tracts) A) FHA, FSA/RHS & VA B) Conventional C) Refinancings D) Home Improvement Loans F) Non-occupant Loans on Number Average Value Number Average Value Number Average Value Number Average Value Number Average Value
LOANS ORIGINATED 2 $38,655 1,517 $377,893 7,555 $295,971 92 $89,114 404 $246,424 APPLICATIONS APPROVED, NOT ACCEPTED 3 $89,667 305 $365,456 1,578 $315,738 25 $79,804 99 $270,845 APPLICATIONS DENIED 0 $0 386 $309,749 1,513 $327,304 77 $47,272 116 $297,223 APPLICATIONS WITHDRAWN 1 $173,000 217 $318,092 1,436 $278,713 11 $116,223 75 $252,062 FILES CLOSED FOR INCOMPLETENESS 0 $0 75 $362,531 402 $333,035 4 $85,582 14 $227,206
Aggregated Statistics For Year 2002(Based on 3 full and 2 partial tracts) A) FHA, FSA/RHS & VA B) Conventional C) Refinancings D) Home Improvement Loans E) Loans on Dwellings For 5+ Families F) Non-occupant Loans on Number Average Value Number Average Value Number Average Value Number Average Value Number Average Value Number Average Value
LOANS ORIGINATED 3 $61,423 406 $317,109 1,799 $286,402 20 $56,825 1 $295,000 109 $226,587 APPLICATIONS APPROVED, NOT ACCEPTED 0 $0 47 $356,032 326 $285,813 12 $30,358 0 $0 15 $279,150 APPLICATIONS DENIED 0 $0 97 $318,186 316 $299,103 45 $57,400 0 $0 23 $298,839 APPLICATIONS WITHDRAWN 0 $0 58 $275,419 363 $302,429 13 $48,843 0 $0 8 $217,960 FILES CLOSED FOR INCOMPLETENESS 0 $0 21 $392,960 143 $287,180 1 $45,000 0 $0 6 $308,863
Aggregated Statistics For Year 2001(Based on 3 full and 2 partial tracts) B) Conventional C) Refinancings D) Home Improvement Loans E) Loans on Dwellings For 5+ Families F) Non-occupant Loans on Number Average Value Number Average Value Number Average Value Number Average Value Number Average Value
LOANS ORIGINATED 310 $307,936 1,511 $281,967 77 $56,650 2 $346,920 78 $222,562 APPLICATIONS APPROVED, NOT ACCEPTED 91 $368,022 273 $290,807 11 $55,535 0 $0 12 $212,701 APPLICATIONS DENIED 103 $277,009 431 $274,371 36 $54,235 0 $0 22 $340,725 APPLICATIONS WITHDRAWN 45 $290,183 309 $269,898 29 $56,798 2 $506,415 9 $313,349 FILES CLOSED FOR INCOMPLETENESS 21 $260,971 99 $316,575 2 $7,930 0 $0 0 $0
Aggregated Statistics For Year 2000(Based on 3 full and 2 partial tracts) B) Conventional C) Refinancings D) Home Improvement Loans F) Non-occupant Loans on Number Average Value Number Average Value Number Average Value Number Average Value
LOANS ORIGINATED 448 $283,890 482 $222,707 92 $46,582 51 $227,906 APPLICATIONS APPROVED, NOT ACCEPTED 85 $286,106 84 $206,380 18 $108,233 7 $134,111 APPLICATIONS DENIED 98 $273,939 190 $227,133 52 $62,254 12 $208,197 APPLICATIONS WITHDRAWN 52 $332,736 112 $200,217 22 $70,927 6 $189,097 FILES CLOSED FOR INCOMPLETENESS 23 $313,854 112 $221,158 3 $99,413 3 $159,960
Aggregated Statistics For Year 1999(Based on 5 full and 3 partial tracts) A) FHA, FSA/RHS & VA B) Conventional C) Refinancings D) Home Improvement Loans E) Loans on Dwellings For 5+ Families F) Non-occupant Loans on Number Average Value Number Average Value Number Average Value Number Average Value Number Average Value Number Average Value
LOANS ORIGINATED 6 $175,537 881 $223,211 1,388 $202,384 131 $40,198 1 $455,920 61 $184,867 APPLICATIONS APPROVED, NOT ACCEPTED 0 $0 125 $218,356 342 $192,613 40 $24,883 0 $0 16 $182,105 APPLICATIONS DENIED 1 $166,710 201 $204,547 475 $194,526 81 $35,871 0 $0 27 $167,639 APPLICATIONS WITHDRAWN 1 $19,260 145 $195,225 407 $192,661 23 $54,848 0 $0 13 $194,872 FILES CLOSED FOR INCOMPLETENESS 0 $0 44 $205,112 233 $179,907 1 $53,580 0 $0 10 $135,513
Private Mortgage Insurance Companies Aggregated Statistics For Year 2009(Based on 12 full and 6 partial tracts) A) Conventional B) Refinancings Number Average Value Number Average Value
LOANS ORIGINATED 47 $377,231 8 $450,046 APPLICATIONS APPROVED, NOT ACCEPTED 22 $386,965 7 $477,689 APPLICATIONS DENIED 10 $470,138 8 $421,565 APPLICATIONS WITHDRAWN 2 $318,360 4 $387,242 FILES CLOSED FOR INCOMPLETENESS 3 $304,063 0 $0
Aggregated Statistics For Year 2008(Based on 12 full and 6 partial tracts) A) Conventional B) Refinancings C) Non-occupant Loans on Number Average Value Number Average Value Number Average Value
LOANS ORIGINATED 55 $434,243 13 $471,997 0 $0 APPLICATIONS APPROVED, NOT ACCEPTED 25 $444,742 16 $609,552 0 $0 APPLICATIONS DENIED 15 $493,937 13 $511,282 5 $432,088 APPLICATIONS WITHDRAWN 4 $467,958 3 $371,687 1 $396,510 FILES CLOSED FOR INCOMPLETENESS 2 $781,435 0 $0 0 $0
Aggregated Statistics For Year 2007(Based on 9 full and 4 partial tracts) A) Conventional B) Refinancings C) Non-occupant Loans on Number Average Value Number Average Value Number Average Value
LOANS ORIGINATED 10 $619,899 8 $612,649 0 $0 APPLICATIONS APPROVED, NOT ACCEPTED 3 $547,067 10 $669,379 2 $495,600 APPLICATIONS DENIED 6 $617,187 13 $667,553 6 $617,048 APPLICATIONS WITHDRAWN 2 $620,000 5 $657,512 0 $0 FILES CLOSED FOR INCOMPLETENESS 2 $792,570 0 $0 0 $0
Aggregated Statistics For Year 2006(Based on 11 full and 6 partial tracts) A) Conventional B) Refinancings C) Non-occupant Loans on Number Average Value Number Average Value Number Average Value
LOANS ORIGINATED 7 $625,120 12 $653,325 0 $0 APPLICATIONS APPROVED, NOT ACCEPTED 0 $0 0 $0 0 $0 APPLICATIONS DENIED 7 $905,794 1 $477,880 2 $792,570 APPLICATIONS WITHDRAWN 0 $0 2 $702,930 0 $0 FILES CLOSED FOR INCOMPLETENESS 0 $0 0 $0 0 $0
Aggregated Statistics For Year 2005(Based on 9 full and 6 partial tracts) A) Conventional B) Refinancings Number Average Value Number Average Value
LOANS ORIGINATED 7 $507,171 16 $501,968 APPLICATIONS APPROVED, NOT ACCEPTED 1 $535,110 2 $450,995 APPLICATIONS DENIED 1 $390,920 2 $602,570 APPLICATIONS WITHDRAWN 0 $0 4 $533,652 FILES CLOSED FOR INCOMPLETENESS 2 $491,000 0 $0
Aggregated Statistics For Year 2004(Based on 10 full and 6 partial tracts) A) Conventional B) Refinancings C) Non-occupant Loans on Number Average Value Number Average Value Number Average Value
LOANS ORIGINATED 14 $440,374 25 $452,726 2 $385,575 APPLICATIONS APPROVED, NOT ACCEPTED 0 $0 4 $383,730 0 $0 APPLICATIONS DENIED 0 $0 0 $0 0 $0 APPLICATIONS WITHDRAWN 0 $0 3 $439,740 0 $0 FILES CLOSED FOR INCOMPLETENESS 0 $0 0 $0 0 $0
Aggregated Statistics For Year 2003(Based on 12 full and 6 partial tracts) A) Conventional B) Refinancings C) Non-occupant Loans on Number Average Value Number Average Value Number Average Value
LOANS ORIGINATED 25 $379,235 36 $396,378 5 $338,946 APPLICATIONS APPROVED, NOT ACCEPTED 8 $388,149 26 $330,815 0 $0 APPLICATIONS DENIED 0 $0 2 $407,185 0 $0 APPLICATIONS WITHDRAWN 3 $376,823 6 $394,857 0 $0 FILES CLOSED FOR INCOMPLETENESS 0 $0 0 $0 0 $0
Aggregated Statistics For Year 2002(Based on 3 full and 2 partial tracts) A) Conventional B) Refinancings C) Non-occupant Loans on Number Average Value Number Average Value Number Average Value
LOANS ORIGINATED 22 $361,598 7 $314,601 2 $254,740 APPLICATIONS APPROVED, NOT ACCEPTED 4 $336,512 8 $315,746 0 $0 APPLICATIONS DENIED 0 $0 2 $271,715 0 $0 APPLICATIONS WITHDRAWN 2 $272,615 2 $419,280 0 $0 FILES CLOSED FOR INCOMPLETENESS 0 $0 0 $0 0 $0
Aggregated Statistics For Year 2001(Based on 3 full and 2 partial tracts) A) Conventional B) Refinancings C) Non-occupant Loans on Number Average Value Number Average Value Number Average Value
LOANS ORIGINATED 16 $376,944 4 $292,908 0 $0 APPLICATIONS APPROVED, NOT ACCEPTED 7 $281,906 0 $0 2 $293,395 APPLICATIONS DENIED 0 $0 0 $0 0 $0 APPLICATIONS WITHDRAWN 0 $0 0 $0 0 $0 FILES CLOSED FOR INCOMPLETENESS 0 $0 0 $0 0 $0
Aggregated Statistics For Year 2000(Based on 3 full and 2 partial tracts) A) Conventional B) Refinancings Number Average Value Number Average Value
LOANS ORIGINATED 43 $313,859 23 $264,172 APPLICATIONS APPROVED, NOT ACCEPTED 13 $291,505 2 $249,780 APPLICATIONS DENIED 6 $276,793 0 $0 APPLICATIONS WITHDRAWN 2 $284,350 2 $228,385 FILES CLOSED FOR INCOMPLETENESS 0 $0 0 $0
Aggregated Statistics For Year 1999(Based on 5 full and 3 partial tracts) A) Conventional B) Refinancings Number Average Value Number Average Value
LOANS ORIGINATED 100 $269,197 35 $248,323 APPLICATIONS APPROVED, NOT ACCEPTED 19 $250,701 15 $236,001 APPLICATIONS DENIED 6 $312,937 3 $355,707 APPLICATIONS WITHDRAWN 2 $412,885 4 $245,585 FILES CLOSED FOR INCOMPLETENESS 2 $280,605 1 $246,050
2010 - 2018 National Fire Incident Reporting System (NFIRS) incidents See full 2006 National Fire Incident Reporting System statistics for zip code 95148, California
Most common first names in zip code 95148 among deceased individuals Name Count Lived (average)
Mary 33 75.3 years James 30 69.2 years John 26 69.5 years William 22 70.1 years Robert 21 63.7 years Joseph 21 78.4 years Maria 20 79.3 years Jose 18 69.0 years Manuel 16 72.6 years Charles 14 75.1 years
Most common last names in zip code 95148 among deceased individuals Last name Count Lived (average)
Nguyen 71 73.8 years Tran 35 77.5 years Huynh 18 73.1 years Le 17 84.2 years Ngo 13 71.1 years Smith 13 68.8 years Pham 13 67.9 years Rodriguez 12 70.5 years Lee 11 77.1 years Lopez 10 63.4 years
Businesses in zip code 95148
Name Count Name Count
7-Eleven 2 McDonald's 1 AT&T 1 Panda Express 1 Blockbuster 1 Pizza Hut 1 CVS 1 Starbucks 1 Carl\s Jr. 1 Subway 1 Cold Stone Creamery 1 U-Haul 1 FedEx 2 UPS 1 GameStop 1 Vans 1 Jamba Juice 1 Walgreens 1 KFC 1 YMCA 1

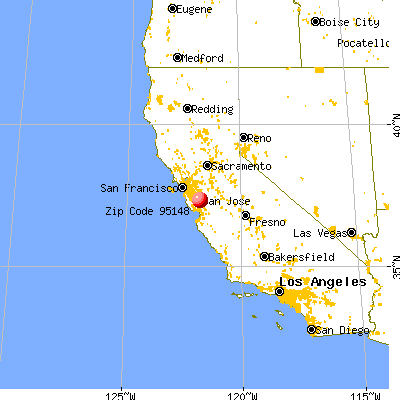


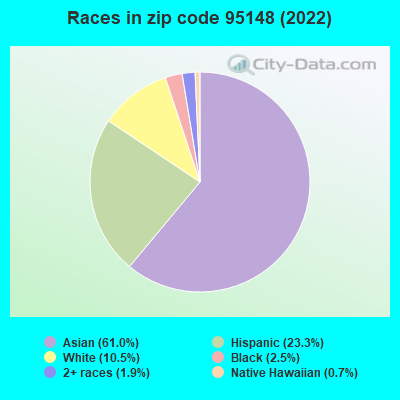


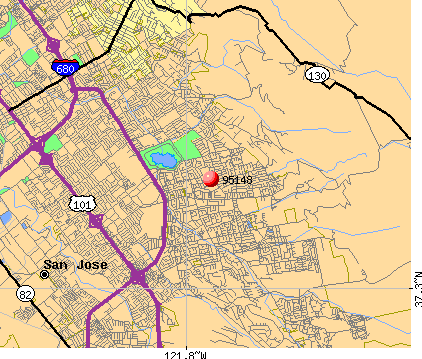 Nearest zip codes: 95127, 95121, 95122, 95111, 95116, 95133.
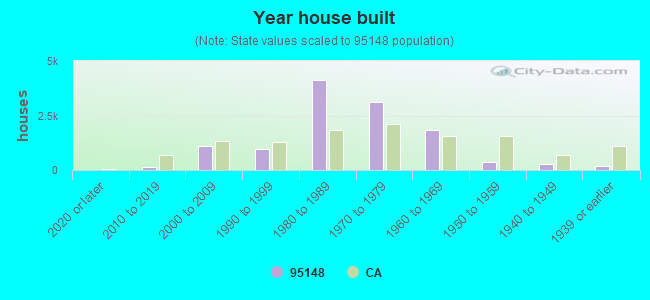

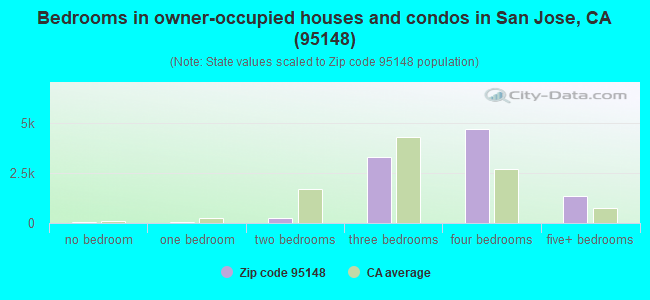
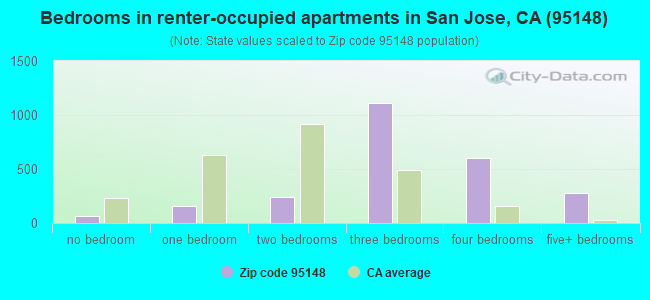
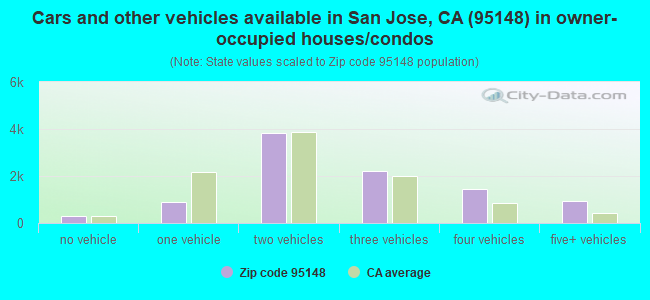
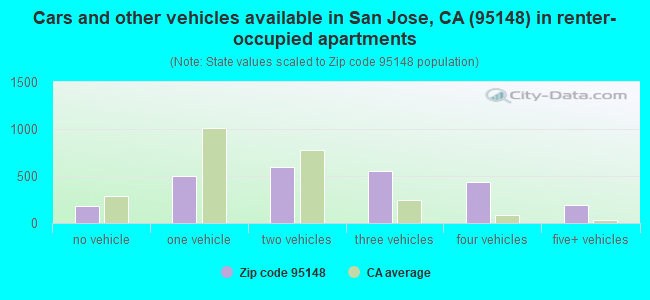


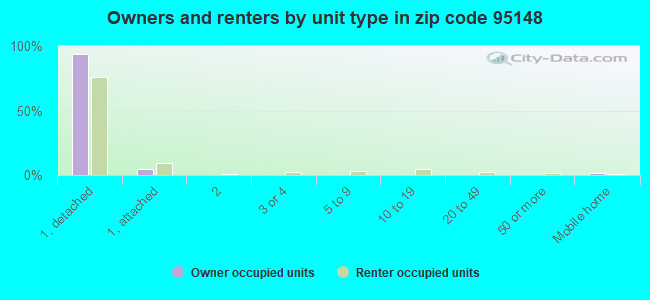
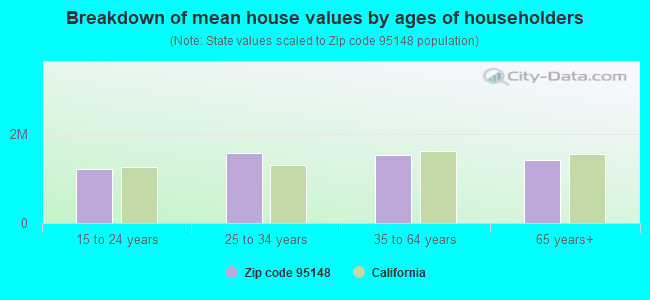


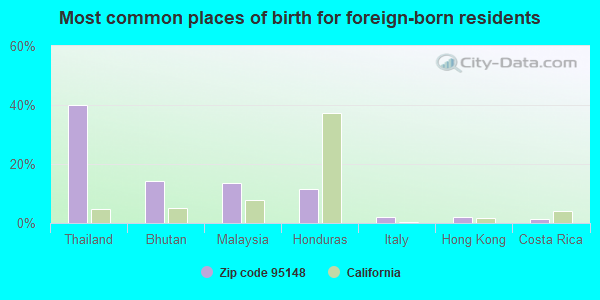
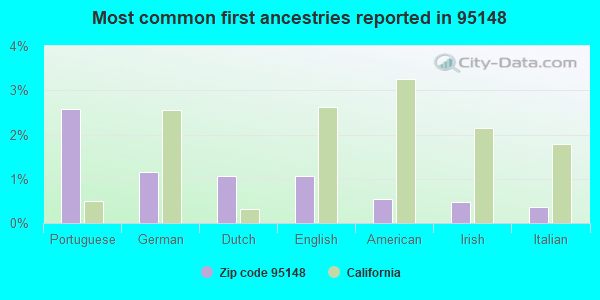
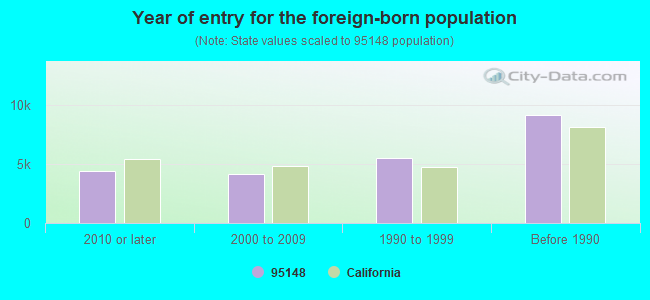
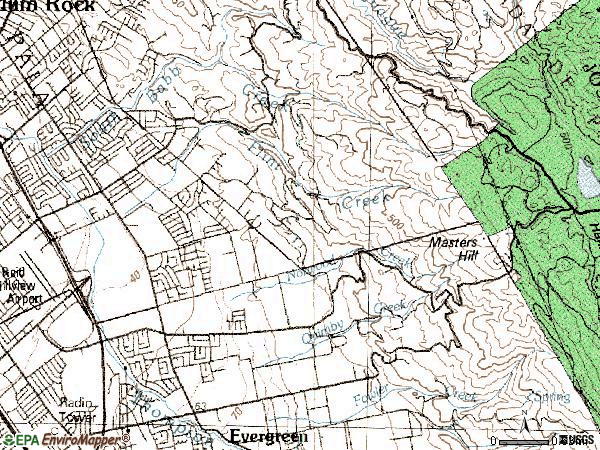


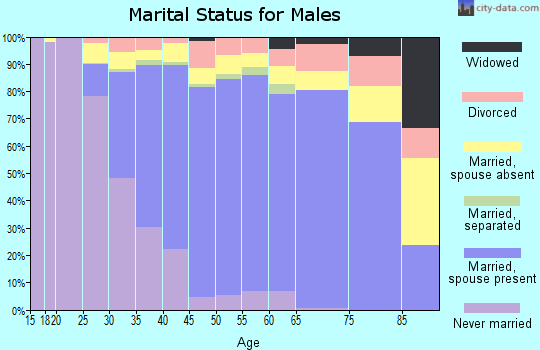
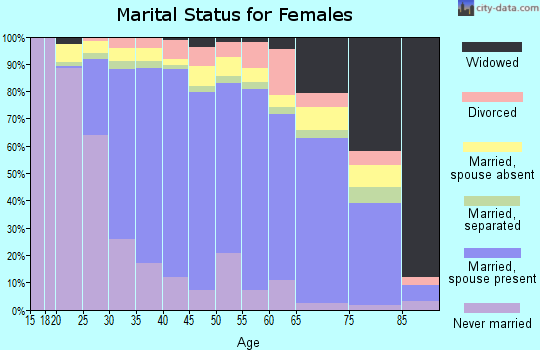
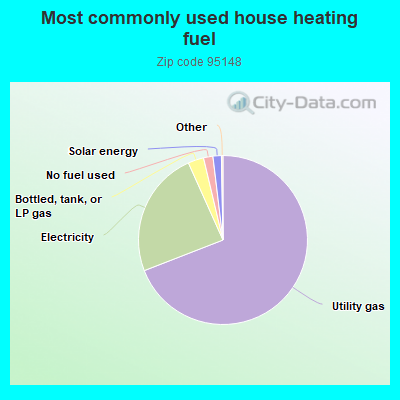
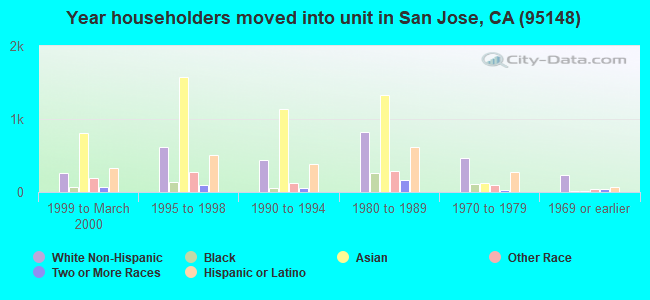
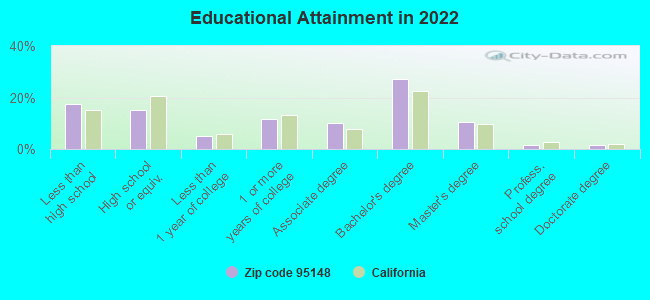
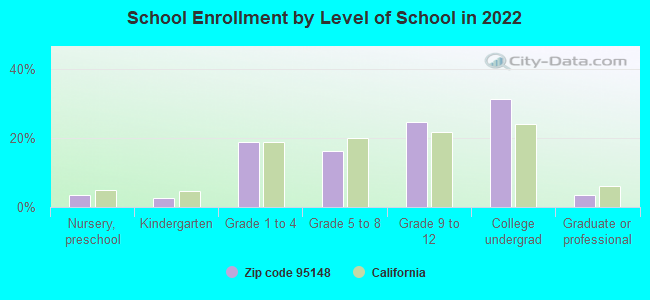
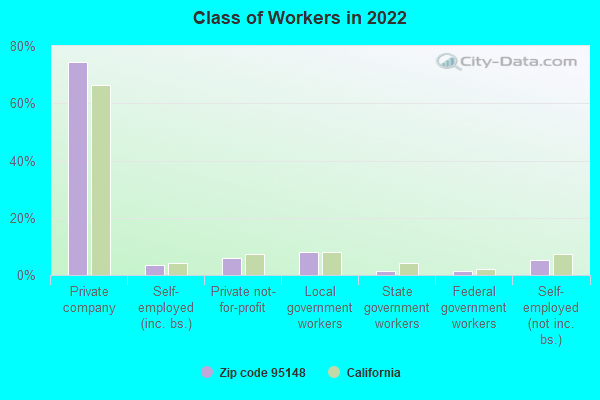
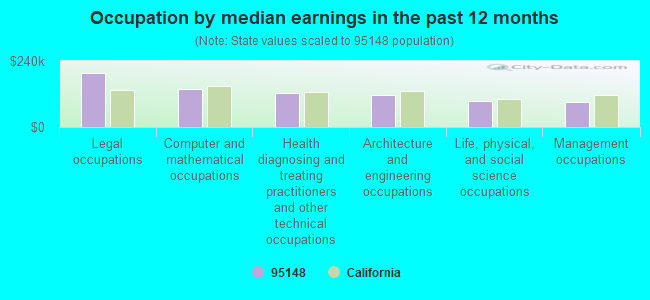
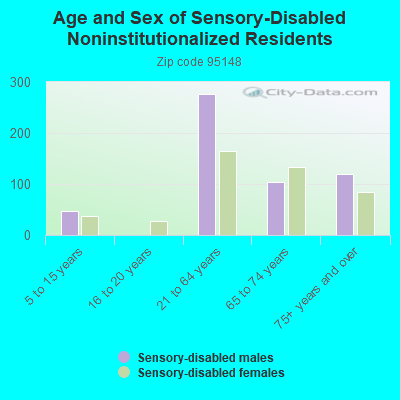
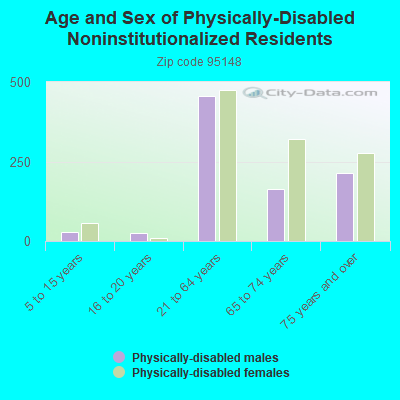
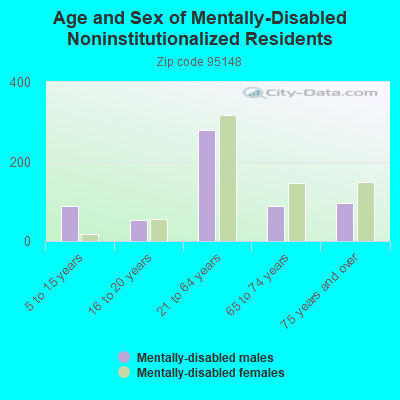
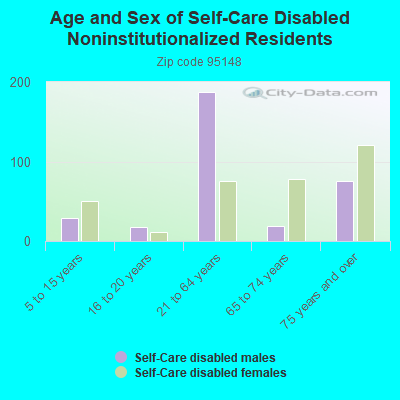
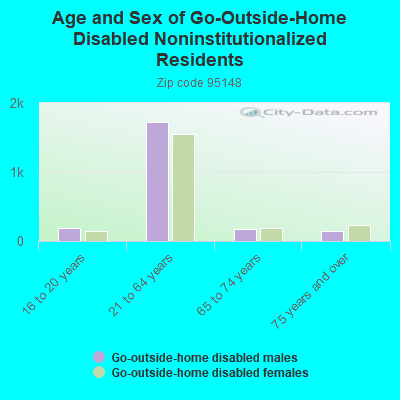
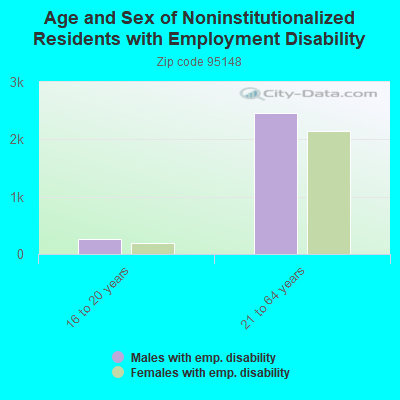
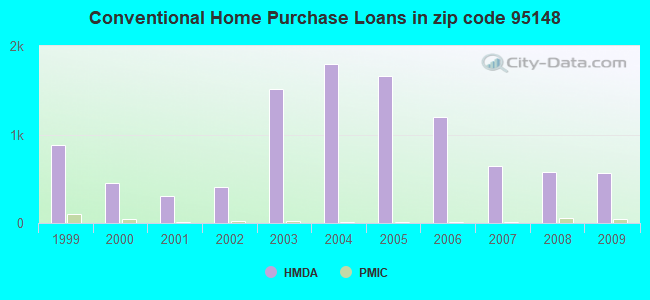
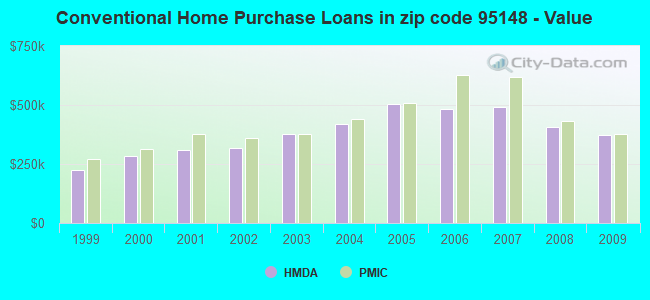
 According to the data from the years 2010 - 2018 the average number of fire incidents per year is 36. The highest number of fire incidents - 110 took place in 2016, and the least - 1 in 2014. The data has a dropping trend.
 When looking into fire subcategories, the most incidents belonged to: Outside Fires (56.3%), and Structure Fires (17.3%).