Estimated zip code population in 2022: 36,598 Zip code population in 2010: 36,981 Zip code population in 2000: 36,120
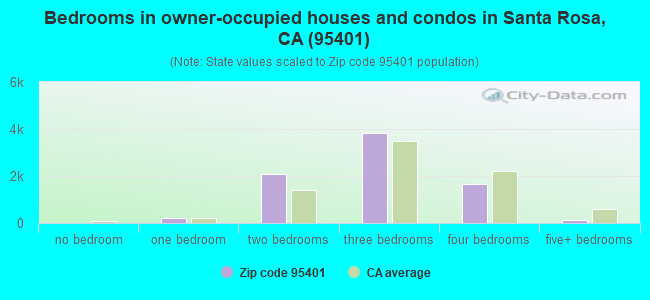
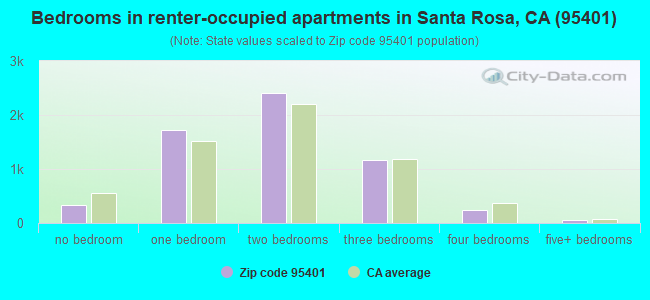
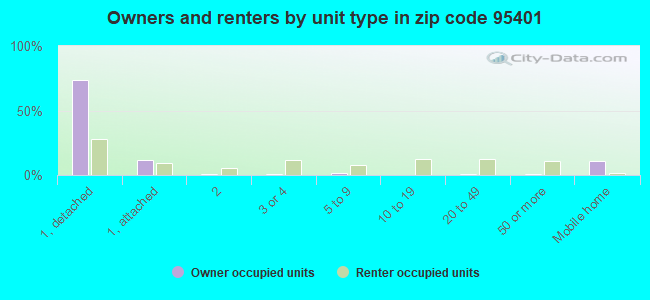
Houses and condos: 14,390 Renter-occupied apartments: 5,930
% of renters here:
43%
State:
44%
March 2022 cost of living index in zip code 95401: 114.7 (more than average, U.S. average is 100)
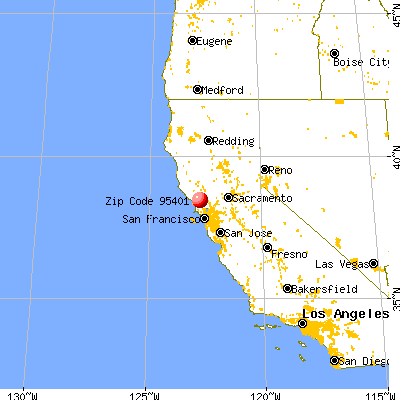
Land area: 20.6 sq. mi. Water area: 0.0 sq. mi.
Population density: 1,774 people per square mile
(low).
OSM Map
General Map
Google Map
MSN Map
OSM Map
General Map
Google Map
MSN Map
OSM Map
General Map
Google Map
MSN Map
OSM Map
General Map
Google Map
MSN Map
Please wait while loading the map...
Real estate property taxes paid for housing units in 2022:
This zip code:
0.6% ($4,117)
California:
0.7% ($4,831)
Median real estate property taxes paid for housing units with mortgages in 2022: $4,575 (0.7%) Median real estate property taxes paid for housing units with no mortgage in 2022: $2,955 (0.4%)
Estimated median house/condo value in 2022: $657,481
95401:
$657,481
California:
$715,900
According to our research of California and other state lists, there were 52 registered sex offenders living in 95401 zip code as of April 25, 2024. The ratio of all residents to sex offenders in zip code 95401 is 769 to 1. The ratio of registered sex offenders to all residents in this zip code is near the state average.
Median resident age:
This zip code:
39.8 years
California median age:
37.9 years
Average household size:
This zip code:
2.6 people
California:
2.8 people
Averages for the 2020 tax year for zip code 95401, filed in 2021:
Average Adjusted Gross Income (AGI) in 2020: $67,959 (Individual Income Tax Returns)
Here:
$67,959
State:
$95,910
Salary/wage: $56,621 (reported on 82.0% of returns)
Here:
$56,621
State:
$77,331
(% of AGI for various income ranges: 1386.4% for AGIs below $25k, 4413.3% for AGIs $25k-50k, 7462.0% for AGIs $50k-75k, 11043.5% for AGIs $75k-100k, 20042.0% for AGIs $100k-200k, 65629.0% for AGIs over 200k)
Taxable interest for individuals: $1,629 (reported on 34.7% of returns)
This zip code:
$1,629
California:
$2,294
(% of AGI for various income ranges: 20.8% for AGIs below $25k, 19.6% for AGIs $25k-50k, 40.0% for AGIs $50k-75k, 83.4% for AGIs $75k-100k, 197.0% for AGIs $100k-200k, 2413.0% for AGIs over 200k)
Ordinary dividends: $7,885 (reported on 16.5% of returns)
Here:
$7,885
State:
$10,949
(% of AGI for various income ranges: 40.7% for AGIs below $25k, 45.9% for AGIs $25k-50k, 86.8% for AGIs $50k-75k, 138.5% for AGIs $75k-100k, 274.1% for AGIs $100k-200k, 7111.0% for AGIs over 200k)
Net capital gain/loss in AGI: +$18,811 (reported on 15.2% of returns)
Here:
+$18,811
State:
+$49,306
(% of AGI for various income ranges: 20.8% for AGIs below $25k, 39.0% for AGIs $25k-50k, 89.6% for AGIs $50k-75k, 170.3% for AGIs $75k-100k, 455.1% for AGIs $100k-200k, 20455.5% for AGIs over 200k)
Profit/loss from business: +$16,970 (reported on 15.5% of returns)
Here:
+$16,970
State:
+$15,671
(% of AGI for various income ranges: 183.7% for AGIs below $25k, 266.3% for AGIs $25k-50k, 298.8% for AGIs $50k-75k, 360.4% for AGIs $75k-100k, 919.7% for AGIs $100k-200k, 6058.0% for AGIs over 200k)
Taxable individual retirement arrangement distribution: $17,878 (reported on 7.4% of returns)
95401:
$17,878
California:
$23,505
(% of AGI for various income ranges: 71.4% for AGIs below $25k, 81.7% for AGIs $25k-50k, 142.9% for AGIs $50k-75k, 298.9% for AGIs $75k-100k, 617.7% for AGIs $100k-200k, 2631.0% for AGIs over 200k)
Self-employed (Keogh) retirement plans: $21,845 (reported on 0.6% of returns)
95401:
$21,845
California:
$30,163
(% of AGI for various income ranges: 5.6% for AGIs $25k-50k, 48.0% for AGIs $100k-200k, 811.5% for AGIs over 200k)
Total itemized deductions: $31,002 (reported on 11.8% of returns)
Here:
$31,002
State:
$39,517
(% of AGI for various income ranges: 104.4% for AGIs below $25k, 146.3% for AGIs $25k-50k, 385.4% for AGIs $50k-75k, 885.0% for AGIs $75k-100k, 1859.2% for AGIs $100k-200k, 8723.0% for AGIs over 200k)
Charity contributions: $6,541 (reported on 8.2% of returns)
Here:
$6,541
State:
$12,598
(% of AGI for various income ranges: 3.1% for AGIs below $25k, 10.4% for AGIs $25k-50k, 31.6% for AGIs $50k-75k, 75.7% for AGIs $75k-100k, 178.9% for AGIs $100k-200k, 2780.0% for AGIs over 200k)
Taxes paid: $8,137 (reported on 11.7% of returns)
95401:
$8,137
State:
$8,807
(% of AGI for various income ranges: 20.1% for AGIs below $25k, 34.7% for AGIs $25k-50k, 109.1% for AGIs $50k-75k, 262.9% for AGIs $75k-100k, 559.2% for AGIs $100k-200k, 1714.0% for AGIs over 200k)
Earned income credit: $1,825 (reported on 10.7% of returns)
Here:
$1,825
State:
$2,074
(% of AGI for various income ranges: 70.0% for AGIs below $25k, 45.7% for AGIs $25k-50k, 0.5% for AGIs $50k-75k)
Percentage of individuals using paid preparers for their 2020 taxes: 92.6%
Here:
93%
State:
92%
(% for various income ranges: 90.0% for AGIs below $25k, 92.1% for AGIs $25k-50k, 94.1% for AGIs $50k-75k, 94.2% for AGIs $75k-100k, 94.8% for AGIs $100k-200k, 95.6% for AGIs over 200k)
Averages for the 2012 tax year for zip code 95401, filed in 2013:
Average Adjusted Gross Income (AGI) in 2012: $49,612 (Individual Income Tax Returns)
Here:
$49,612
State:
$72,726
Salary/wage: $42,290 (reported on 83.4% of returns)
Here:
$42,290
State:
$59,079
(% of AGI for various income ranges: 76.5% for AGIs below $25k, 80.4% for AGIs $25k-50k, 77.9% for AGIs $50k-75k, 75.2% for AGIs $75k-100k, 71.7% for AGIs $100k-200k, 44.0% for AGIs over 200k)
Taxable interest for individuals: $2,391 (reported on 32.7% of returns)
This zip code:
$2,391
California:
$2,146
(% of AGI for various income ranges: 1.0% for AGIs below $25k, 0.7% for AGIs $25k-50k, 0.8% for AGIs $50k-75k, 0.7% for AGIs $75k-100k, 1.2% for AGIs $100k-200k, 5.2% for AGIs over 200k)
Ordinary dividends: $4,051 (reported on 16.3% of returns)
Here:
$4,051
State:
$9,308
(% of AGI for various income ranges: 1.4% for AGIs below $25k, 0.9% for AGIs $25k-50k, 1.0% for AGIs $50k-75k, 1.0% for AGIs $75k-100k, 1.4% for AGIs $100k-200k, 2.4% for AGIs over 200k)
Net capital gain/loss in AGI: +$9,774 (reported on 12.9% of returns)
Here:
+$9,774
State:
+$30,460
(% of AGI for various income ranges: 0.1% for AGIs $25k-50k, 0.2% for AGIs $50k-75k, 0.7% for AGIs $75k-100k, 1.9% for AGIs $100k-200k, 12.4% for AGIs over 200k)
Profit/loss from business: +$16,144 (reported on 16.0% of returns)
Here:
+$16,144
State:
+$17,064
(% of AGI for various income ranges: 8.8% for AGIs below $25k, 5.3% for AGIs $25k-50k, 4.7% for AGIs $50k-75k, 3.7% for AGIs $75k-100k, 4.9% for AGIs $100k-200k, 4.8% for AGIs over 200k)
Taxable individual retirement arrangement distribution: $14,061 (reported on 8.0% of returns)
95401:
$14,061
California:
$19,557
(% of AGI for various income ranges: 2.3% for AGIs below $25k, 1.6% for AGIs $25k-50k, 1.9% for AGIs $50k-75k, 2.7% for AGIs $75k-100k, 2.7% for AGIs $100k-200k, 2.5% for AGIs over 200k)
Self-employment retirement plans: $21,118 (reported on 0.7% of returns)
95401:
$21,118
California:
$24,530
(% of AGI for various income ranges: 0.3% for AGIs $50k-75k, 0.6% for AGIs $100k-200k, 0.7% for AGIs over 200k)
Total itemized deductions: $24,217 (25% of AGI, reported on 29.6% of returns)
Here:
$24,217
State:
$34,004
Here:
25.2% of AGI
State:
22.7% of AGI
(% of AGI for various income ranges: 9.3% for AGIs below $25k, 9.7% for AGIs $25k-50k, 14.6% for AGIs $50k-75k, 17.0% for AGIs $75k-100k, 18.1% for AGIs $100k-200k, 16.4% for AGIs over 200k)
Charity contributions: $2,289 (reported on 22.7% of returns)
Here:
$2,289
State:
$4,659
(% of AGI for various income ranges: 0.4% for AGIs below $25k, 0.6% for AGIs $25k-50k, 0.9% for AGIs $50k-75k, 1.3% for AGIs $75k-100k, 1.6% for AGIs $100k-200k, 1.2% for AGIs over 200k)
Taxes paid: $8,880 (reported on 29.4% of returns)
95401:
$8,880
State:
$14,448
(% of AGI for various income ranges: 1.6% for AGIs below $25k, 2.1% for AGIs $25k-50k, 4.0% for AGIs $50k-75k, 5.4% for AGIs $75k-100k, 7.2% for AGIs $100k-200k, 10.3% for AGIs over 200k)
Earned income credit: $1,896 (reported on 16.0% of returns)
Here:
$1,896
State:
$2,286
(% of AGI for various income ranges: 4.2% for AGIs below $25k, 0.8% for AGIs $25k-50k)
Percentage of individuals using paid preparers for their 2012 taxes: 56.5%
Here:
57%
State:
64%
(% for various income ranges: 51.8% for AGIs below $25k, 56.4% for AGIs $25k-50k, 58.3% for AGIs $50k-75k, 63.8% for AGIs $75k-100k, 64.7% for AGIs $100k-200k, 81.5% for AGIs over 200k)
Averages for the 2004 tax year for zip code 95401, filed in 2005:
Average Adjusted Gross Income (AGI) in 2004: $44,646 (Individual Income Tax Returns)
Here:
$44,646
State:
$58,600
Salary/wage: $39,290 (reported on 83.5% of returns)
Here:
$39,290
State:
$49,455
(% of AGI for various income ranges: 264.5% for AGIs below $10k, 77.0% for AGIs $10k-25k, 83.8% for AGIs $25k-50k, 80.9% for AGIs $50k-75k, 79.5% for AGIs $75k-100k, 53.4% for AGIs over 100k)
Taxable interest for individuals: $2,259 (reported on 43.8% of returns)
This zip code:
$2,259
California:
$2,365
(% of AGI for various income ranges: 22.6% for AGIs below $10k, 2.2% for AGIs $10k-25k, 1.3% for AGIs $25k-50k, 1.3% for AGIs $50k-75k, 1.3% for AGIs $75k-100k, 3.6% for AGIs over 100k)
Taxable dividends: $2,435 (reported on 21.5% of returns)
Here:
$2,435
State:
$4,746
(% of AGI for various income ranges: 20.3% for AGIs below $10k, 1.5% for AGIs $10k-25k, 0.8% for AGIs $25k-50k, 0.9% for AGIs $50k-75k, 1.0% for AGIs $75k-100k, 1.3% for AGIs over 100k)
Net capital gain/loss: +$10,420 (reported on 18.0% of returns)
Here:
+$10,420
State:
+$23,418
(% of AGI for various income ranges: -3.0% for AGIs below $10k, 0.3% for AGIs $10k-25k, 0.7% for AGIs $25k-50k, 0.7% for AGIs $50k-75k, 1.3% for AGIs $75k-100k, 12.0% for AGIs over 100k)
Profit/loss from business: +$16,060 (reported on 16.0% of returns)
Here:
+$16,060
State:
+$16,826
(% of AGI for various income ranges: 0.5% for AGIs below $10k, 6.6% for AGIs $10k-25k, 4.6% for AGIs $25k-50k, 5.0% for AGIs $50k-75k, 5.4% for AGIs $75k-100k, 7.1% for AGIs over 100k)
IRA payment deduction: $3,027 (reported on 2.8% of returns)
95401:
$3,027
California:
$3,192
(% of AGI for various income ranges: 0.9% for AGIs below $10k, 0.2% for AGIs $10k-25k, 0.2% for AGIs $25k-50k, 0.2% for AGIs $50k-75k, 0.2% for AGIs $75k-100k, 0.1% for AGIs over 100k)
Self-employed pension: $13,392 (reported on 1.3% of returns)
Here:
$13,392
California:
$17,688
(% of AGI for various income ranges: 0.1% for AGIs $10k-25k, 0.2% for AGIs $25k-50k, 0.2% for AGIs $50k-75k, 0.3% for AGIs $75k-100k, 0.7% for AGIs over 100k)
Total itemized deductions: $22,019 (27% of AGI, reported on 35.4% of returns)
Here:
$22,019
State:
$28,113
Here:
27.4% of AGI
State:
25.3% of AGI
(% of AGI for various income ranges: 64.6% for AGIs below $10k, 11.0% for AGIs $10k-25k, 15.0% for AGIs $25k-50k, 19.8% for AGIs $50k-75k, 20.9% for AGIs $75k-100k, 17.3% for AGIs over 100k)
Charity contributions deductions: $2,213 (3% of AGI, reported on 30.0% of returns)
Here:
$2,213
State:
$3,923
Here:
2.6% of AGI
State:
3.3% of AGI
(% of AGI for various income ranges: 3.0% for AGIs below $10k, 0.7% for AGIs $10k-25k, 1.0% for AGIs $25k-50k, 1.6% for AGIs $50k-75k, 1.9% for AGIs $75k-100k, 1.8% for AGIs over 100k)
Total tax: $6,603 (reported on 76.5% of returns)
95401:
$6,603
State:
$10,761
(% of AGI for various income ranges: 11.9% for AGIs below $10k, 4.5% for AGIs $10k-25k, 7.1% for AGIs $25k-50k, 9.0% for AGIs $50k-75k, 10.4% for AGIs $75k-100k, 18.7% for AGIs over 100k)
Earned income credit: $1,447 (reported on 11.9% of returns)
Here:
$1,447
State:
$1,763
Percentage of individuals using paid preparers for their 2004 taxes: 61.3%
Here:
61%
State:
66%
(% for various income ranges: 50.9% for AGIs below $10k, 60.8% for AGIs $10k-25k, 62.2% for AGIs $25k-50k, 64.3% for AGIs $50k-75k, 62.6% for AGIs $75k-100k, 76.7% for AGIs over 100k)
Likely homosexual households (counted as self-reported same-sex unmarried-partner households)
Lesbian couples: 0.2% of all households
Gay men: 1.1% of all households
Household received Food Stamps/SNAP in the past 12 months: 1,533 Household did not receive Food Stamps/SNAP in the past 12 months: 12,338
Women who had a birth in the past 12 months: 393 (258 now married, 135 unmarried) Women who did not have a birth in the past 12 months: 7,638 (3,132 now married, 4,501 unmarried)
Housing units in zip code 95401 with a mortgage: 5,203 (633 second mortgage, 502 both second mortgage and home equity loan) Houses without a mortgage: 32
Median monthly owner costs for units with a mortgage: $2,519 Median monthly owner costs for units without a mortgage: $692
Residents with income below the poverty level in 2022:
This zip code:
14.8%
Whole state:
12.2%
Residents with income below 50% of the poverty level in 2022:
This zip code:
6.6%
Whole state:
6.2%
Median number of rooms in houses and condos:
Here:
5.6
State:
6.0
Median number of rooms in apartments:
Here:
3.9
State:
3.9
Notable locations in this zip code not listed on our city pages
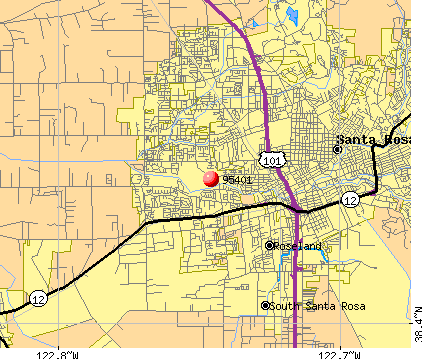
Notable locations in zip code 95401: Santa Rosa Golf and Country Club (A), Aggio Dairy (B), West College Treatment Plant (C), Wye (D), Truzer Gymnasium (E), Sonoma County Museum (F), Ripley Museum (G), Pioneer Hall (H), Luther Burbank Theatre (I), Jesse Peter Memorial Museum (J), Geary Hall (K), Garcia Hall (L), Doyle Tilden Center (M), Bussman Hall (N), Barnett Hall (O), Analy Hall (P), Santa Rosa Fire Department Station 2 (Q), Department of Forestry and Fire Protection Satna Rosa Station (R). Display/hide their locations on the map
Shopping Centers: Redwood Plaza Shopping Center (1), Brickyard Center Shopping Center (2), Santa Rosa Plaza Shopping Center (3), Coddington Regional Shopping Center (4), Fulton Marketplace Shopping Center (5). Display/hide their locations on the map
Churches in zip code 95401 include: Church of Christ Santa Rosa (A), Church Built from One Tree (B), Foursquare Gospel Church (C), Open Door Community Church (D), Saint Lukes Lutheran Church (E), Saint Rose Catholic Church (F). Display/hide their locations on the map
Parks in zip code 95401 include: Live Oak Park (1), Burbank Playground (2), De Meo Park (3), Finley Community Park (4), Jacobs Park (5), Olive Park (6), West Park (7), Railroad Park (8), Railroad Square Historic District (9). Display/hide their locations on the map
3,657 married couples with children.
2,484 single-parent households (1,018 men, 1,466 women).
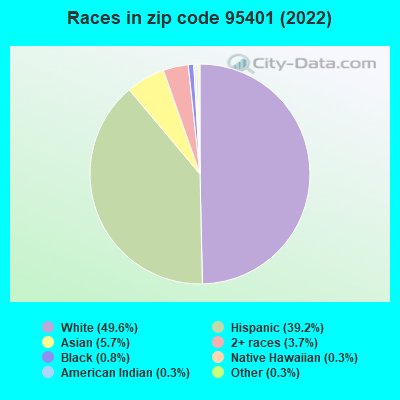
61.6% of residents of 95401 zip code speak English at home.
32.7% of residents speak Spanish at home (52% very well, 16% well, 22% not well, 10% not at all).
2.3% of residents speak other Indo-European language at home (57% very well, 22% well, 21% not well).
2.8% of residents speak Asian or Pacific Island language at home (55% very well, 31% well, 12% not well, 2% not at all).
0.4% of residents speak other language at home (78% very well, 22% not well).
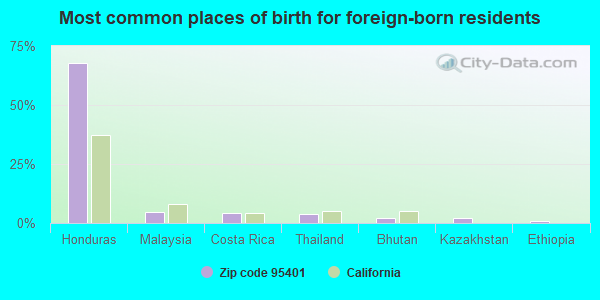
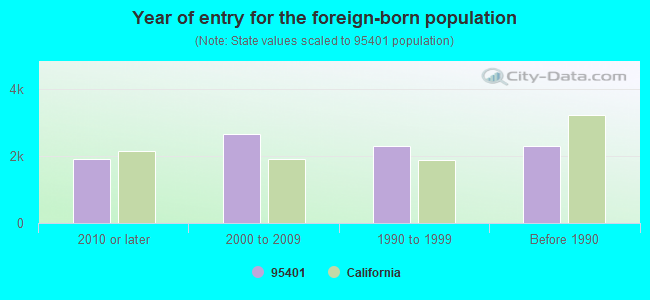
Foreign born population: 8,917 (24.4%) (35.9% of them are naturalized citizens)
Major facilities with environmental interests located in this zip code:
CALTRANS DISTRICT 4 (224 LINCOLN ST in SANTA ROSA, CA) . Federal Facility
STATE MASTER (California - Hazardous Waste Tracking) - HAZARDOU WASTE PROGRAM Small Quantity Generators, between 100 kg and 1000 kg of hazardous waste/month (Resource Conservation and Recovery Act (tracking hazardous waste)) - notification Organizations: STATE OF CALIFORNIA (CONTACT/OWNER)
Alternative names: SANTA ROSA MAINTENANCE STN
GOLDEN GATE BRIDGE AND TRANSIT DISTRICT (3225 INDUSTRIAL DRIVE in SANTA ROSA, CA)
STATE MASTER (California - Hazardous Waste Tracking) - HAZARDOU WASTE PROGRAM Small Quantity Generators, between 100 kg and 1000 kg of hazardous waste/month (Resource Conservation and Recovery Act (tracking hazardous waste)) Alternative names: GOLDEN GATE TRANSIT, GOLDEN GATE TRANSIT AUTHORITY
CALIFORNIA DEPARTMENT OF FORESTRY (2210 W COLLEGE in SANTA ROSA, CA)
STATE MASTER (California - Hazardous Waste Tracking) - HAZARDOU WASTE PROGRAM Small Quantity Generators, between 100 kg and 1000 kg of hazardous waste/month (Resource Conservation and Recovery Act (tracking hazardous waste)) - notification Organizations: STATE OF CALIFORNIA (CONTACT/OWNER)
ABRAHAM LINCOLN ELEMENTARY SCHOOL (850 WEST NINTH ST in SANTA ROSA, CA)
(Geographic Names Information System) (National Center for Education Statistics) - STATE ID-6052153 Organizations: SANTA ROSA ELEMENTARY (SCHOOL DISTRICT)
Alternative names: LINCOLN (ABRAHAM) ELEMENTARY
NORTH COAST HYDRAULICS (949 PINER PL in SANTA ROSA, CA)
STATE MASTER (California - Hazardous Waste Tracking) - HAZARDOU WASTE PROGRAM Small Quantity Generators, between 100 kg and 1000 kg of hazardous waste/month (Resource Conservation and Recovery Act (tracking hazardous waste)) - notification Organizations: BOB FENZEL (CONTACT/OWNER)
CHEVRON STATION NO 93692 (701 MENDOCINO AVE in SANTA ROSA, CA)
STATE MASTER (California - Hazardous Waste Tracking) - HAZARDOU WASTE PROGRAM Small Quantity Generators, between 100 kg and 1000 kg of hazardous waste/month (Resource Conservation and Recovery Act (tracking hazardous waste)) - notification Organizations: CHEVRON PRODUCTS CO (CONTACT/OWNER)
MESA HIGH (CONT.) (1235 MENDOCINO AVE. in SANTA ROSA, CA)
(National Center for Education Statistics) - STATE ID-4930145 Organizations: SANTA ROSA HIGH (SCHOOL DISTRICT)
LEHMAN (HELEN M.) ELEMENTARY (1700 JENNINGS AVE. in SANTA ROSA, CA)
(National Center for Education Statistics) - STATE ID-6066385 Organizations: SANTA ROSA ELEMENTARY (SCHOOL DISTRICT)
KID STREET CHARTER (54 W. SIXTH ST. in SANTA ROSA, CA)
(National Center for Education Statistics) - STATE ID-6116958 Organizations: SANTA ROSA ELEMENTARY (SCHOOL DISTRICT)
FORT ROSS CHARTER (520 MENDOCINO AVE., SUITE 225 in SANTA ROSA, CA)
(National Center for Education Statistics) - STATE ID-6117378 Organizations: FORT ROSS ELEMENTARY (SCHOOL DISTRICT)
ABC CLEANERS (711 STONYPOINT RD in SANTA ROSA, CA)
Small Quantity Generators, between 100 kg and 1000 kg of hazardous waste/month (Resource Conservation and Recovery Act (tracking hazardous waste)) Small Quantity Generators, between 100 kg and 1000 kg of hazardous waste/month (Resource Conservation and Recovery Act (tracking hazardous waste)) - notification Organizations: DRY CLEAN USA (CONTACT/OWNER)
, HONG PAK (CONTACT/OWNER)
Alternative names: DRY CLEAN USA
HENDRIX AUTO BODY (50B MAXWELL COURT in SANTA ROSA, CA)
CRITERIA AND HAZARDOUS AIR POLLUTANT INVENTORY (Inventory of air pollution sources) (Resource Conservation and Recovery Act (tracking hazardous waste)) Business SIC classification: TOP, BODY, AND UPHOLSTERY REPAIR SHOPS AND PAINT SHOPS Organizations: MEL HENDRIX (CONTACT/OWNER)
KOMAG MATERIAL TECHNOLOGIES INC. (93 STONY CIRCLE in SANTA ROSA, CA)
COMPLIANCE ACTIVITY (Tracking inspections of insecticide, fungicide, and rodenticide, and toxic substances) HAZARDOUS WASTE BIENNIAL REPORTER (Resource Conservation and Recovery Act (tracking hazardous waste)) Large Quantity Generators, more that 1000 kg of hazardous waste/month (Resource Conservation and Recovery Act (tracking hazardous waste)) TRI REPORTER (Tracking of toxic chemicals releasing facilities) Business SIC classification: COMPUTER STORAGE DEVICES; MAGNETIC AND OPTICAL RECORDING MEDIA Business NAICS classification: MAGNETIC AND OPTICAL RECORDING MEDIA MANUFACTURING.
Housing units lacking complete plumbing facilities: 0.4% Housing units lacking complete kitchen facilities: 1.4%
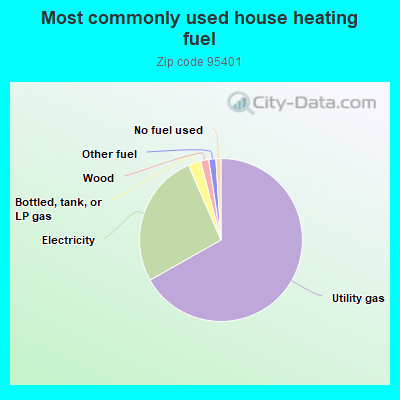
66.9%Utility gas
26.7%Electricity
2.5%Bottled, tank, or LP gas
1.6%Wood
1.4%Other fuel
1.0%No fuel used
Population in 1990: 30,549. Population change in the 1990s: +5,571 (+18.2%).
Place of birth for U.S.-born residents:
This state: 22,053
Northeast: 1,124
Midwest: 1,635
South: 1,307
West: 1,295
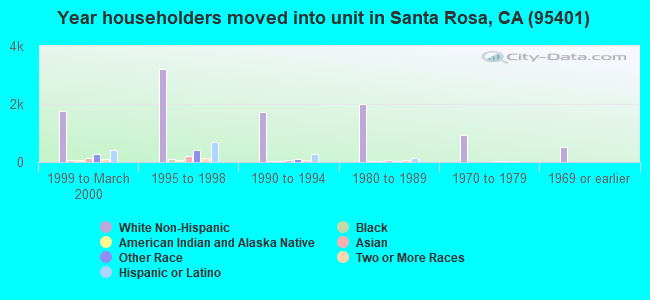
49% of the 95401 zip code residents lived in the same house 5 years ago. Out of people who lived in different houses, 75% lived in this county. Out of people who lived in different counties, 50% lived in California.
88% of the 95401 zip code residents lived in the same house 1 year ago. Out of people who lived in different houses, 66% moved from this county. Out of people who lived in different houses, 20% moved from different county within same state. Out of people who lived in different houses, 9% moved from different state. Out of people who lived in different houses, 2% moved from abroad.
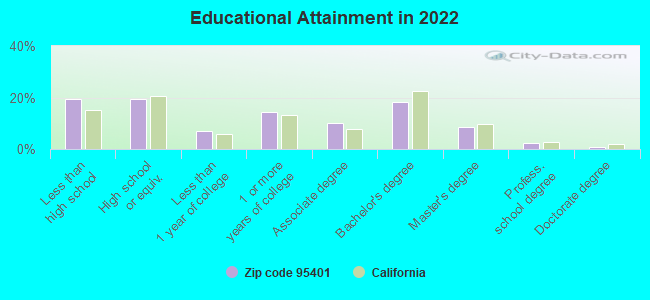
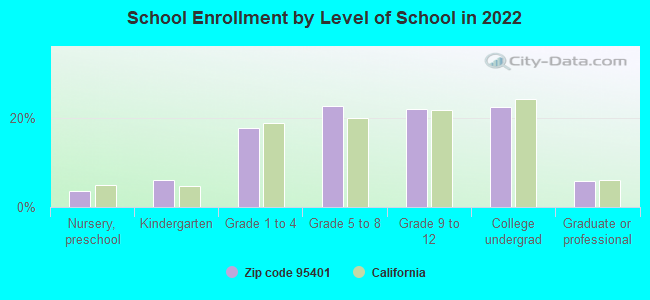
Private vs. public school enrollment:
Students in private schools in grades 1 to 8 (elementary and middle school): 95
Here:
3.1%
California:
10.5%
Students in private schools in grades 9 to 12 (high school): 94
Here:
5.5%
California:
8.5%
Students in private undergraduate colleges: 93
Here:
5.4%
California:
15.9%
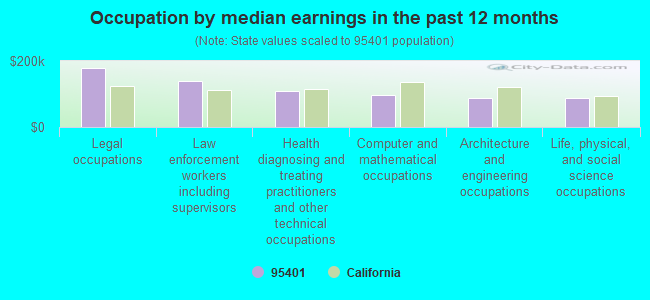
Occupation by median earnings in the past 12 months ($)
178,684Legal occupations
140,209Law enforcement workers including supervisors
110,048Health diagnosing and treating practitioners and other technical occupations
96,948Computer and mathematical occupations
89,226Architecture and engineering occupations
88,914Life, physical, and social science occupations
Companies with federal contracts located in this zip code (SANTA ROSA, CA):
W&K CONSULTING ENGINEERS (495 TESCONI CIRCLE) : $1,088,083 in 11 contractsfrom 2001 to 2005
Contracts for Architect - Engineer Services (including landscaping, interior layout, and designing), Other Buildings, Airfield, Communication and Missile Facilities by Navy Signed by year:2000: $0; 2001: $5,000; 2002: $1,062,111; 2003: $0; 2004: -$20,832; 2005: $41,804; 2006: $0.
Biggest contracts:
$476,158 with Navy for Architect - Engineer Services (including landscaping, interior layout, and designing). Signed on 2002-03-06. Completion date: 2003-06-18.
$442,447, same as above.Signed on 2002-01-14. Completion date: 2002-05-10.
$139,500, same as above.Signed on 2002-05-31. Completion date: 2004-06-30.
$46,916, same as above.Signed on 2005-09-02. Completion date: 2006-08-18.
WINZLER, KELLY CONSULTING ENGN (495 TESCONI CIR STE 9) : $630,828 in 53 contractsfrom 2000 to 2006
Contracts for Architect - Engineer Services (including landscaping, interior layout, and designing), Other Professional Services, Inspection Services (including commercial testing and lab services, except medical/dental) -- Railway Equipment, Other Architect and Engineering Services by Navy, U.S. Army Corps of Engineers - civil program financing only, Army Signed by year:2000: $212,279; 2001: -$6,742; 2002: $90,758; 2003: $100,599; 2004: $53,754; 2005: $229,012; 2006: -$48,832.
Biggest contracts:
$140,985 with Navy for Architect - Engineer Services (including landscaping, interior layout, and designing). Signed on 2000-11-15. Completion date: 2001-03-31.
$128,336, same as above.Signed on 2002-09-25. Completion date: 2004-01-23.
$112,017, same as above.Signed on 2003-02-20. Completion date: 2004-09-30.
$54,124 with U.S. Army Corps of Engineers - civil program financing only for Other Professional Services. Signed on 2005-09-09. Completion date: 2005-08-30.
ITT - BIW CONNECTOR SYSTEMS (500 TESCONI CIR) : $300,050 in 8 contractsfrom 2000 to 2004
Contracts for Miscellaneous Electric Power and Distribution Equipment, Connectors, Electrical, Lugs, Terminals, and Terminal Strips, Electrical Hardware and Supplies, and moreby Defense Logistics Agency, Navy Signed by year:2000: $71,330; 2001: $80,865; 2002: $0; 2003: $64,550; 2004: $83,305; 2005: $0; 2006: $0.
Biggest contracts:
$80,865 with Defense Logistics Agency for Miscellaneous Electric Power and Distribution Equipment. Signed on 2001-06-22. Completion date: 2001-10-12.
$71,330 with Defense Logistics Agency for Connectors, Electrical. Signed on 2000-11-28. Completion date: 2001-03-08.
$58,386 with Defense Logistics Agency for Lugs, Terminals, and Terminal Strips. Signed on 2003-11-06. Completion date: 2004-02-27.
$47,501, same as above.Signed on 2004-01-16. Completion date: 2004-05-16.
ENVIRO SAFE PRODUCTS (1488 OLIVET RD; small business)
$7,582 with Army for Miscellaneous Special Industry Machinery. Signed on 2002-09-27. Completion date: 2002-11-01.
RESULTS RADIO, LLC (1355 N DUTTON AVENUE SUIT)
$6,090 with Army for Advertising Services. Signed on 2005-09-16. Completion date: 2005-09-23.
Top industries in this zip code by the number of employees in 2005:
2005 - 2018 National Fire Incident Reporting System (NFIRS) incidents
According to the data from the years 2005 - 2018 the average number of fires per year is 94. The highest number of reported fire incidents - 183 took place in 2017, and the least - 26 in 2018. The data has a dropping trend.
When looking into fire subcategories, the most incidents belonged to: Outside Fires (44.4%), and Structure Fires (39.3%).
Fire incident types reported to NFIRS in Zip Code 95401


 Nearest zip codes: 95439, 95403, 95407, 95444, 95492, 95472.


 . Federal Facility

 According to the data from the years 2005 - 2018 the average number of fires per year is 94. The highest number of reported fire incidents - 183 took place in 2017, and the least - 26 in 2018. The data has a dropping trend.
 When looking into fire subcategories, the most incidents belonged to: Outside Fires (44.4%), and Structure Fires (39.3%).