Estimated zip code population in 2022: 36,912 Zip code population in 2010: 36,067 Zip code population in 2000: 27,784
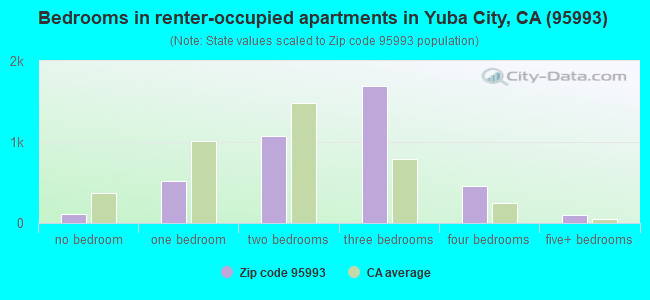
Houses and condos: 13,249 Renter-occupied apartments: 3,960
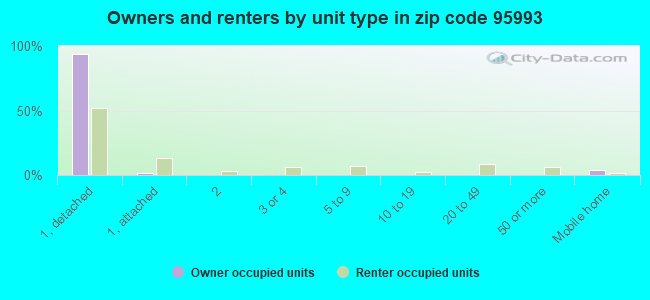
% of renters here:
31%
State:
44%
March 2022 cost of living index in zip code 95993: 93.5 (less than average, U.S. average is 100)
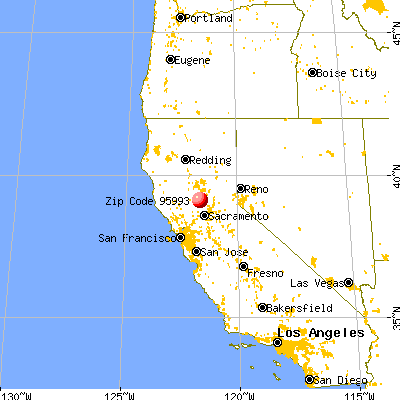
Land area: 85.5 sq. mi. Water area: 0.1 sq. mi.
Population density: 432 people per square mile
(low).
OSM Map
General Map
Google Map
MSN Map
OSM Map
General Map
Google Map
MSN Map
OSM Map
General Map
Google Map
MSN Map
OSM Map
General Map
Google Map
MSN Map
Please wait while loading the map...
Real estate property taxes paid for housing units in 2022:
This zip code:
0.8% ($3,663)
California:
0.7% ($4,831)
Median real estate property taxes paid for housing units with mortgages in 2022: $3,867 (0.8%) Median real estate property taxes paid for housing units with no mortgage in 2022: $3,413 (0.8%)
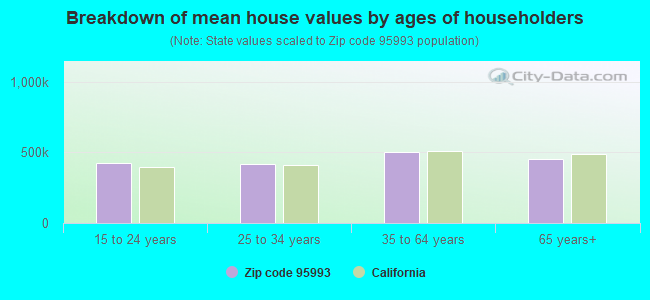
Estimated median house/condo value in 2022: $443,569
95993:
$443,569
California:
$715,900
According to our research of California and other state lists, there were 61 registered sex offenders living in 95993 zip code as of April 19, 2024. The ratio of all residents to sex offenders in zip code 95993 is 609 to 1. The ratio of registered sex offenders to all residents in this zip code is near the state average.
Median resident age:
This zip code:
39.4 years
California median age:
37.9 years
Average household size:
This zip code:
2.9 people
California:
2.8 people
Averages for the 2020 tax year for zip code 95993, filed in 2021:
Average Adjusted Gross Income (AGI) in 2020: $67,216 (Individual Income Tax Returns)
Here:
$67,216
State:
$95,910
Salary/wage: $56,056 (reported on 79.9% of returns)
Here:
$56,056
State:
$77,331
(% of AGI for various income ranges: 1419.7% for AGIs below $25k, 4183.0% for AGIs $25k-50k, 7704.2% for AGIs $50k-75k, 10881.5% for AGIs $75k-100k, 20576.7% for AGIs $100k-200k, 66833.3% for AGIs over 200k)
Taxable interest for individuals: $1,452 (reported on 37.2% of returns)
This zip code:
$1,452
California:
$2,294
(% of AGI for various income ranges: 15.5% for AGIs below $25k, 22.9% for AGIs $25k-50k, 46.8% for AGIs $50k-75k, 98.0% for AGIs $75k-100k, 155.4% for AGIs $100k-200k, 2208.6% for AGIs over 200k)
Ordinary dividends: $5,400 (reported on 15.8% of returns)
Here:
$5,400
State:
$10,949
(% of AGI for various income ranges: 28.3% for AGIs below $25k, 36.1% for AGIs $25k-50k, 94.2% for AGIs $50k-75k, 195.9% for AGIs $75k-100k, 336.8% for AGIs $100k-200k, 2561.4% for AGIs over 200k)
Net capital gain/loss in AGI: +$14,314 (reported on 15.5% of returns)
Here:
+$14,314
State:
+$49,306
(% of AGI for various income ranges: 15.4% for AGIs below $25k, 32.1% for AGIs $25k-50k, 96.2% for AGIs $50k-75k, 212.7% for AGIs $75k-100k, 797.3% for AGIs $100k-200k, 11136.2% for AGIs over 200k)
Profit/loss from business: +$19,625 (reported on 16.6% of returns)
Here:
+$19,625
State:
+$15,671
(% of AGI for various income ranges: 154.9% for AGIs below $25k, 493.3% for AGIs $25k-50k, 592.7% for AGIs $50k-75k, 513.5% for AGIs $75k-100k, 722.1% for AGIs $100k-200k, 7222.9% for AGIs over 200k)
Taxable individual retirement arrangement distribution: $18,273 (reported on 6.6% of returns)
95993:
$18,273
California:
$23,505
(% of AGI for various income ranges: 47.7% for AGIs below $25k, 66.1% for AGIs $25k-50k, 140.9% for AGIs $50k-75k, 328.7% for AGIs $75k-100k, 640.3% for AGIs $100k-200k, 2090.5% for AGIs over 200k)
Self-employed (Keogh) retirement plans: $27,386 (reported on 0.4% of returns)
95993:
$27,386
California:
$30,163
(% of AGI for various income ranges: 54.2% for AGIs $100k-200k, 595.2% for AGIs over 200k)
Total itemized deductions: $31,917 (reported on 9.9% of returns)
Here:
$31,917
State:
$39,517
(% of AGI for various income ranges: 54.3% for AGIs below $25k, 150.1% for AGIs $25k-50k, 396.2% for AGIs $50k-75k, 798.6% for AGIs $75k-100k, 1534.6% for AGIs $100k-200k, 7790.0% for AGIs over 200k)
Charity contributions: $8,347 (reported on 8.1% of returns)
Here:
$8,347
State:
$12,598
(% of AGI for various income ranges: 4.6% for AGIs below $25k, 16.3% for AGIs $25k-50k, 59.1% for AGIs $50k-75k, 131.0% for AGIs $75k-100k, 316.8% for AGIs $100k-200k, 2396.7% for AGIs over 200k)
Taxes paid: $8,167 (reported on 9.7% of returns)
95993:
$8,167
State:
$8,807
(% of AGI for various income ranges: 9.8% for AGIs below $25k, 29.8% for AGIs $25k-50k, 103.4% for AGIs $50k-75k, 225.8% for AGIs $75k-100k, 474.8% for AGIs $100k-200k, 1459.5% for AGIs over 200k)
Earned income credit: $2,013 (reported on 15.0% of returns)
Here:
$2,013
State:
$2,074
(% of AGI for various income ranges: 86.2% for AGIs below $25k, 91.6% for AGIs $25k-50k, 2.8% for AGIs $50k-75k)
Percentage of individuals using paid preparers for their 2020 taxes: 95.1%
Here:
95%
State:
92%
(% for various income ranges: 94.2% for AGIs below $25k, 95.7% for AGIs $25k-50k, 95.1% for AGIs $50k-75k, 94.7% for AGIs $75k-100k, 95.8% for AGIs $100k-200k, 95.9% for AGIs over 200k)
Averages for the 2012 tax year for zip code 95993, filed in 2013:
Average Adjusted Gross Income (AGI) in 2012: $55,978 (Individual Income Tax Returns)
Here:
$55,978
State:
$72,726
Salary/wage: $46,992 (reported on 81.1% of returns)
Here:
$46,992
State:
$59,079
(% of AGI for various income ranges: 70.8% for AGIs below $25k, 71.9% for AGIs $25k-50k, 72.2% for AGIs $50k-75k, 70.5% for AGIs $75k-100k, 72.3% for AGIs $100k-200k, 49.6% for AGIs over 200k)
Taxable interest for individuals: $1,359 (reported on 41.7% of returns)
This zip code:
$1,359
California:
$2,146
(% of AGI for various income ranges: 1.1% for AGIs below $25k, 0.7% for AGIs $25k-50k, 0.8% for AGIs $50k-75k, 0.7% for AGIs $75k-100k, 0.7% for AGIs $100k-200k, 2.3% for AGIs over 200k)
Ordinary dividends: $4,102 (reported on 17.3% of returns)
Here:
$4,102
State:
$9,308
(% of AGI for various income ranges: 1.4% for AGIs below $25k, 0.8% for AGIs $25k-50k, 0.9% for AGIs $50k-75k, 1.0% for AGIs $75k-100k, 0.9% for AGIs $100k-200k, 2.8% for AGIs over 200k)
Net capital gain/loss in AGI: +$5,584 (reported on 14.2% of returns)
Here:
+$5,584
State:
+$30,460
(% of AGI for various income ranges: 0.4% for AGIs below $25k, 0.4% for AGIs $50k-75k, 0.7% for AGIs $75k-100k, 1.2% for AGIs $100k-200k, 5.5% for AGIs over 200k)
Profit/loss from business: +$18,390 (reported on 16.2% of returns)
Here:
+$18,390
State:
+$17,064
(% of AGI for various income ranges: 8.7% for AGIs below $25k, 8.5% for AGIs $25k-50k, 3.9% for AGIs $50k-75k, 2.2% for AGIs $75k-100k, 3.0% for AGIs $100k-200k, 9.1% for AGIs over 200k)
Taxable individual retirement arrangement distribution: $14,195 (reported on 8.9% of returns)
95993:
$14,195
California:
$19,557
(% of AGI for various income ranges: 2.3% for AGIs below $25k, 1.8% for AGIs $25k-50k, 2.5% for AGIs $50k-75k, 2.6% for AGIs $75k-100k, 2.5% for AGIs $100k-200k, 1.8% for AGIs over 200k)
Self-employment retirement plans: $21,811 (reported on 0.6% of returns)
95993:
$21,811
California:
$24,530
(% of AGI for various income ranges: 0.3% for AGIs $25k-50k, 0.2% for AGIs $100k-200k, 0.8% for AGIs over 200k)
Total itemized deductions: $23,757 (24% of AGI, reported on 36.6% of returns)
Here:
$23,757
State:
$34,004
Here:
23.9% of AGI
State:
22.7% of AGI
(% of AGI for various income ranges: 10.7% for AGIs below $25k, 12.6% for AGIs $25k-50k, 15.7% for AGIs $50k-75k, 16.9% for AGIs $75k-100k, 17.7% for AGIs $100k-200k, 15.7% for AGIs over 200k)
Charity contributions: $3,391 (reported on 31.0% of returns)
Here:
$3,391
State:
$4,659
(% of AGI for various income ranges: 0.7% for AGIs below $25k, 1.2% for AGIs $25k-50k, 1.8% for AGIs $50k-75k, 2.1% for AGIs $75k-100k, 2.2% for AGIs $100k-200k, 2.3% for AGIs over 200k)
Taxes paid: $8,319 (reported on 36.5% of returns)
95993:
$8,319
State:
$14,448
(% of AGI for various income ranges: 2.1% for AGIs below $25k, 3.0% for AGIs $25k-50k, 4.1% for AGIs $50k-75k, 5.2% for AGIs $75k-100k, 6.9% for AGIs $100k-200k, 8.4% for AGIs over 200k)
Earned income credit: $2,194 (reported on 19.7% of returns)
Here:
$2,194
State:
$2,286
(% of AGI for various income ranges: 6.2% for AGIs below $25k, 1.7% for AGIs $25k-50k)
Percentage of individuals using paid preparers for their 2012 taxes: 67.7%
Here:
68%
State:
64%
(% for various income ranges: 63.2% for AGIs below $25k, 70.0% for AGIs $25k-50k, 68.1% for AGIs $50k-75k, 69.9% for AGIs $75k-100k, 71.0% for AGIs $100k-200k, 86.1% for AGIs over 200k)
Averages for the 2004 tax year for zip code 95993, filed in 2005:
Average Adjusted Gross Income (AGI) in 2004: $49,879 (Individual Income Tax Returns)
Here:
$49,879
State:
$58,600
Salary/wage: $42,390 (reported on 82.8% of returns)
Here:
$42,390
State:
$49,455
(% of AGI for various income ranges: 72.7% for AGIs $10k-25k, 76.4% for AGIs $25k-50k, 75.3% for AGIs $50k-75k, 77.9% for AGIs $75k-100k, 55.4% for AGIs over 100k)
Taxable interest for individuals: $1,514 (reported on 52.0% of returns)
This zip code:
$1,514
California:
$2,365
(% of AGI for various income ranges: 2.1% for AGIs $10k-25k, 1.6% for AGIs $25k-50k, 1.4% for AGIs $50k-75k, 1.3% for AGIs $75k-100k, 1.4% for AGIs over 100k)
Taxable dividends: $2,956 (reported on 21.8% of returns)
Here:
$2,956
State:
$4,746
(% of AGI for various income ranges: 1.3% for AGIs $10k-25k, 0.7% for AGIs $25k-50k, 0.9% for AGIs $50k-75k, 0.8% for AGIs $75k-100k, 1.8% for AGIs over 100k)
Net capital gain/loss: +$13,029 (reported on 19.7% of returns)
Here:
+$13,029
State:
+$23,418
(% of AGI for various income ranges: 0.3% for AGIs $10k-25k, 0.8% for AGIs $25k-50k, 1.5% for AGIs $50k-75k, 2.0% for AGIs $75k-100k, 10.5% for AGIs over 100k)
Profit/loss from business: +$16,617 (reported on 15.7% of returns)
Here:
+$16,617
State:
+$16,826
(% of AGI for various income ranges: 6.8% for AGIs $10k-25k, 5.0% for AGIs $25k-50k, 3.5% for AGIs $50k-75k, 3.1% for AGIs $75k-100k, 6.1% for AGIs over 100k)
IRA payment deduction: $3,374 (reported on 2.7% of returns)
95993:
$3,374
California:
$3,192
(% of AGI for various income ranges: 0.2% for AGIs $10k-25k, 0.2% for AGIs $25k-50k, 0.2% for AGIs $50k-75k, 0.2% for AGIs $75k-100k, 0.1% for AGIs over 100k)
Self-employed pension: $14,925 (reported on 1.0% of returns)
Here:
$14,925
California:
$17,688
(% of AGI for various income ranges: 0.1% for AGIs $25k-50k, 0.1% for AGIs $50k-75k, 0.3% for AGIs $75k-100k, 0.6% for AGIs over 100k)
Total itemized deductions: $21,116 (24% of AGI, reported on 41.8% of returns)
Here:
$21,116
State:
$28,113
Here:
23.9% of AGI
State:
25.3% of AGI
(% of AGI for various income ranges: 11.5% for AGIs $10k-25k, 16.8% for AGIs $25k-50k, 20.1% for AGIs $50k-75k, 20.9% for AGIs $75k-100k, 15.7% for AGIs over 100k)
Charity contributions deductions: $3,276 (4% of AGI, reported on 37.2% of returns)
Here:
$3,276
State:
$3,923
Here:
3.6% of AGI
State:
3.3% of AGI
(% of AGI for various income ranges: 1.3% for AGIs $10k-25k, 1.7% for AGIs $25k-50k, 2.7% for AGIs $50k-75k, 2.7% for AGIs $75k-100k, 2.7% for AGIs over 100k)
Total tax: $7,567 (reported on 75.2% of returns)
95993:
$7,567
State:
$10,761
(% of AGI for various income ranges: 4.0% for AGIs $10k-25k, 6.0% for AGIs $25k-50k, 8.0% for AGIs $50k-75k, 9.4% for AGIs $75k-100k, 17.2% for AGIs over 100k)
Earned income credit: $1,657 (reported on 14.3% of returns)
Here:
$1,657
State:
$1,763
Percentage of individuals using paid preparers for their 2004 taxes: 67.9%
Here:
68%
State:
66%
(% for various income ranges: 61.5% for AGIs below $10k, 67.5% for AGIs $10k-25k, 68.4% for AGIs $25k-50k, 69.6% for AGIs $50k-75k, 69.5% for AGIs $75k-100k, 74.4% for AGIs over 100k)
Household received Food Stamps/SNAP in the past 12 months: 933 Household did not receive Food Stamps/SNAP in the past 12 months: 11,733
Women who had a birth in the past 12 months: 411 (389 now married, 19 unmarried) Women who did not have a birth in the past 12 months: 7,754 (3,248 now married, 4,498 unmarried)
Housing units in zip code 95993 with a mortgage: 5,407 (267 second mortgage, 6 home equity loan, 219 both second mortgage and home equity loan) Houses without a mortgage: 156
Median monthly owner costs for units with a mortgage: $1,971 Median monthly owner costs for units without a mortgage: $686
Residents with income below the poverty level in 2022:
This zip code:
10.7%
Whole state:
12.2%
Residents with income below 50% of the poverty level in 2022:
This zip code:
6.4%
Whole state:
6.2%
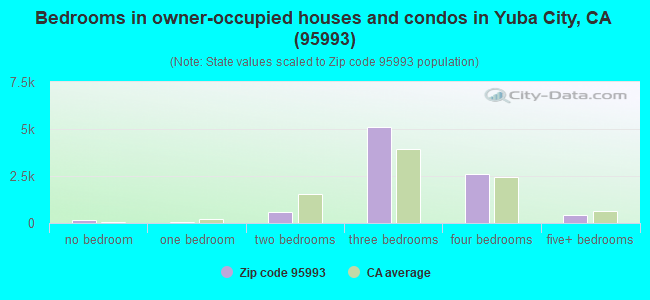
Median number of rooms in houses and condos:
Here:
6.6
State:
6.0
Median number of rooms in apartments:
Here:
5.1
State:
3.9
Notable locations in this zip code not listed on our city pages
Notable locations in zip code 95993: Barry Substation (A), Sutter County Museum (B), Bi - County Ambulance (C), Yuba City Fire Department Station 7 (D), Yuba City Fire Department Station 4 (E). Display/hide their locations on the map
5,567 married couples with children.
1,471 single-parent households (529 men, 942 women).
64.1% of residents of 95993 zip code speak English at home.
11.9% of residents speak Spanish at home (68% very well, 14% well, 13% not well, 4% not at all).
20.9% of residents speak other Indo-European language at home (47% very well, 18% well, 20% not well, 14% not at all).
3.9% of residents speak Asian or Pacific Island language at home (42% very well, 26% well, 18% not well, 14% not at all).
0.1% of residents speak other language at home (91% very well, 9% well).
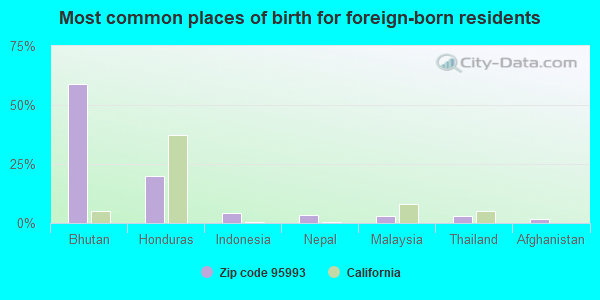
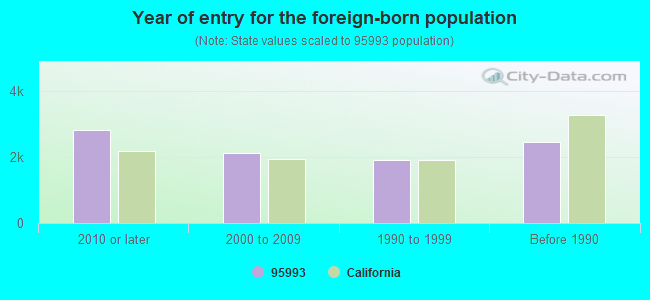
Foreign born population: 8,426 (22.8%) (65.4% of them are naturalized citizens)
Facilities with environmental interests located in this zip code:
CALPINE SUTTER ENERGY CENTER (5087 SOUTH TOWNSHIP ROAD in YUBA CITY, CA)
AIR MAJOR (AIRS/AFS) AIR PROGRAM (Clean Air Markets Division Business System) CRITERIA AND HAZARDOUS AIR POLLUTANT INVENTORY (Inventory of air pollution sources) National Pollutant Discharge Elimination System NON-MAJOR (Tracking pollutant discharge elimination systems) - permit (Resource Conservation and Recovery Act (tracking hazardous waste)) Business SIC classification: ELECTRIC SERVICES; ELECTRIC AND OTHER SERVICES COMBINED Organizations: GREENLEAF UNIT ONE ASSOC (CONTACT/OWNER)
, GREENLEAF POWER CORP (CONTACT/OWNER)
, CALPINE CONSTRUCTION FINANCE COMPANY, LP (OWNER/OPERATOR)
Alternative names: CALPINE GREENLEAF INCORPORATED UNIT 1, GREENLEAF POWER CORP, GREENLEAF UNIT 1, GREENLEAF UNIT ONE PROJECT
HYDRAULIC CONTROLS (3481 INDUSTRIAL DR in YUBA CITY, CA)
STATE MASTER (California - Hazardous Waste Tracking) - HAZARDOU WASTE PROGRAM Small Quantity Generators, between 100 kg and 1000 kg of hazardous waste/month (Resource Conservation and Recovery Act (tracking hazardous waste)) - notification
FRANKLIN ELEMENTARY (332 N. TOWNSHIP ROAD in YUBA CITY, CA)
(National Center for Education Statistics) - STATE ID-6053250
KARPEROS (ANDROS) MIDDLE (1666 CAMINO DEL FLORES in YUBA CITY, CA)
(National Center for Education Statistics) - STATE ID-6108252 Organizations: YUBA CITY UNIFIED (SCHOOL DISTRICT)
LINCOLN ELEMENTARY (1582 LINCOLN ROAD in YUBA CITY, CA)
(National Center for Education Statistics) - STATE ID-6053409 Organizations: YUBA CITY UNIFIED (SCHOOL DISTRICT)
CENTRAL GAITHER ELEMENTARY (8403 BAILEY ROAD in YUBA CITY, CA)
(National Center for Education Statistics) - STATE ID-6053375 Organizations: YUBA CITY UNIFIED (SCHOOL DISTRICT)
YUBA CITY ENERGY CENTER (875 NORTH WALTON in YUBA CITY, CA)
AIR MAJOR (AIRS/AFS) AIR PROGRAM (Clean Air Markets Division Business System) CRITERIA AND HAZARDOUS AIR POLLUTANT INVENTORY (Inventory of air pollution sources) Business SIC classification: ELECTRIC SERVICES; ELECTRIC AND OTHER SERVICES COMBINED Organizations: GILROY ENERGY CENTER, LLC (OWNER/OPERATOR)
, GREENLEAF II ENERGY CENTER (OWNER/OPERATOR)
Alternative names: GREENLEAF 2 POWER PLANT, GREENLEAF II ENERGY CENTER, GREENLEAF II ENERGY CENTER, GREENLEAF UNIT TWO ASSOCIATES
GARY YATES EXCAVATING (1431 WALNUT AVE in YUBA CITY, CA)
Small Quantity Generators, between 100 kg and 1000 kg of hazardous waste/month (Resource Conservation and Recovery Act (tracking hazardous waste)) - notification TRANSPORTER (Resource Conservation and Recovery Act (tracking hazardous waste)) - notification Organizations: YATES GARY (CONTACT/OWNER)
GILROY ENERGY CENTER, LLC (202 BURNS DRIVE in YUBA CITY, CA)
AIR MINOR (AIRS/AFS) Business SIC classification: ELECTRIC SERVICES
HANOVER CO (3243 INDUSTRIAL DR in YUBA CITY, CA)
(Resource Conservation and Recovery Act (tracking hazardous waste))
HOME DEPOT USA INC HD 1019 (1100 THARP RD in YUBA CITY, CA)
Small Quantity Generators, between 100 kg and 1000 kg of hazardous waste/month (Resource Conservation and Recovery Act (tracking hazardous waste))
Housing units lacking complete plumbing facilities: 0.2% Housing units lacking complete kitchen facilities: 1.3%
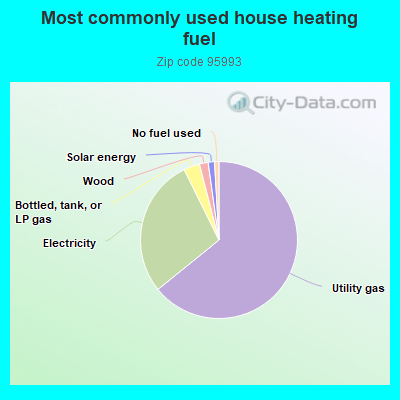
64.1%Utility gas
28.5%Electricity
3.3%Bottled, tank, or LP gas
1.8%Wood
1.3%Solar energy
0.9%No fuel used
Population in 1990: 19,635. Population change in the 1990s: +8,149 (+41.5%).
Place of birth for U.S.-born residents:
This state: 22,866
Northeast: 737
Midwest: 1,254
South: 1,646
West: 1,268
56% of the 95993 zip code residents lived in the same house 5 years ago. Out of people who lived in different houses, 59% lived in this county. Out of people who lived in different counties, 50% lived in California.
91% of the 95993 zip code residents lived in the same house 1 year ago. Out of people who lived in different houses, 56% moved from this county. Out of people who lived in different houses, 38% moved from different county within same state. Out of people who lived in different houses, 5% moved from different state. Out of people who lived in different houses, 1% moved from abroad.
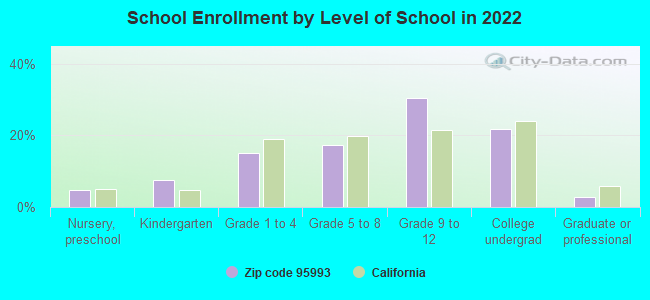
Private vs. public school enrollment:
Students in private schools in grades 1 to 8 (elementary and middle school): 167
Here:
5.4%
California:
10.5%
Students in private schools in grades 9 to 12 (high school): 136
Here:
4.6%
California:
8.5%
Students in private undergraduate colleges: 298
Here:
14.0%
California:
15.9%
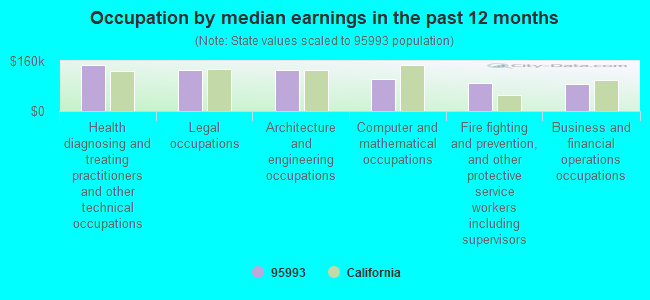
Occupation by median earnings in the past 12 months ($)
148,617Health diagnosing and treating practitioners and other technical occupations
131,255Legal occupations
131,236Architecture and engineering occupations
102,714Computer and mathematical occupations
88,929Fire fighting and prevention, and other protective service workers including supervisors
86,016Business and financial operations occupations
Companies with federal contracts located in this zip code (YUBA CITY, CA):
NORMANDIE GROUP (975 N GEORGE WASHINGTON B; small business) : $85,326 in 2 contractsin 2004
$82,326 with Army for Construction of Structures and Facilities -- Other Non-Building Facilities. Signed on 2004-08-02. Completion date: 2004-09-02.
$3,000, same as above.Signed on 2004-08-12. Completion date: 2004-09-02.
ORCHARD MACHINERY CORPORATION (2700 COLUSA HWY)
$84,927 with Navy for Seeds and Nursery Stock. Signed on 2000-08-04. Completion date: 2000-09-15.
VALLEY PUMP & MOTOR WORKS INC (470 N GEORGE WASHINGTON B; small business) : $83,827 in 4 contractsin 2001
$41,607 with Air Force for Installation of Equipment -- Engines, Turbines, and Components. Signed on 2001-07-09. Completion date: 2001-09-07.
$41,020, same as above.Signed on 2001-07-09. Completion date: 2001-09-07.
$1,200 with Air Force for Maintenance, Repair or Alteration of Real Property -- Sewage and Waste Facilities. Signed on 2001-08-17. Completion date: 2001-01-01.
$0, same as above.Signed on 2001-08-17. Completion date: 2001-01-01.
HART HIGH-VOLTAGE APPARATUS RE (1612 POOLE BLVD; small business) : $28,142 in 2 contractsfrom 2004 to 2005
$24,218 with Army for Maintenance, Repair and Rebuilding of Equipment -- Electrical and Electronic Equipment Components. Signed on 2005-01-24. Completion date: 2005-01-18.
$3,924, same as above.Signed on 2004-12-29. Completion date: 2005-01-18.
JABOBSES-DOWNING-HUGHES, INC (1340 BRIDGE STRREET; small business)
$26,966 with Air Force for Trucks and Truck Tractors, Wheeled. Signed on 2001-07-11. Completion date: 2001-06-20.
OPTIMUM ART (1831 GERMAINE DR; small business) : $13,563 in 2 contractsin 2003
$7,274 with Army for Badges and Insignia. Signed on 2003-05-28. Completion date: 2003-07-09.
$6,289, same as above.Signed on 2003-08-27. Completion date: 2003-09-27.
Top industries in this zip code by the number of employees in 2005:
2005 - 2018 National Fire Incident Reporting System (NFIRS) incidents
Based on the data from the years 2005 - 2018 the average number of fire incidents per year is 56. The highest number of fires - 136 took place in 2018, and the least - 6 in 2015. The data has an increasing trend.
When looking into fire subcategories, the most incidents belonged to: Structure Fires (41.6%), and Outside Fires (37.8%).
Fire incident types reported to NFIRS in Zip Code 95993


 Nearest zip codes: 95991, 95961, 95957, 95982, 95953, 95645.


 Based on the data from the years 2005 - 2018 the average number of fire incidents per year is 56. The highest number of fires - 136 took place in 2018, and the least - 6 in 2015. The data has an increasing trend.
 When looking into fire subcategories, the most incidents belonged to: Structure Fires (41.6%), and Outside Fires (37.8%).