Estimated median house/condo value in 2022: $22,255
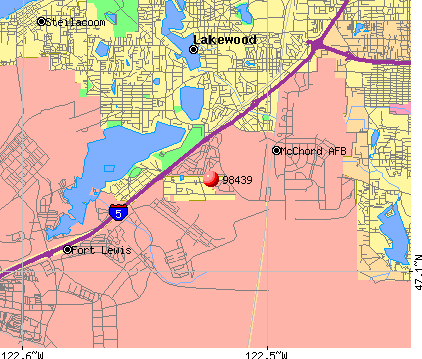
98439:
$22,255
Washington:
$569,500
According to our research of Washington and other state lists, there were 4 registered sex offenders living in 98439 zip code as of April 19, 2024. The ratio of all residents to sex offenders in zip code 98439 is 1,409 to 1. The ratio of registered sex offenders to all residents in this zip code is near the state average.
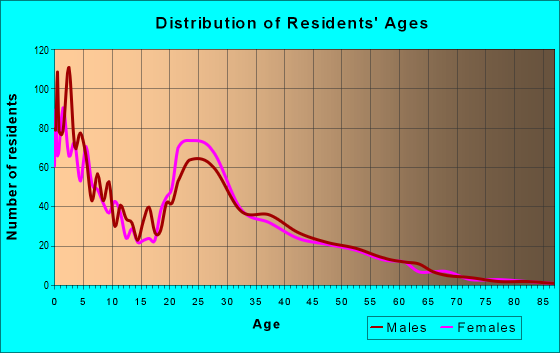
Median resident age:
This zip code:
25.8 years
Washington median age:
38.4 years
Average household size:
This zip code:
2.5 people
Washington:
2.5 people
Averages for the 2020 tax year for zip code 98439, filed in 2021:
Average Adjusted Gross Income (AGI) in 2020: $40,741 (Individual Income Tax Returns)
Here:
$40,741
State:
$99,264
Salary/wage: $39,507 (reported on 94.3% of returns)
Here:
$39,507
State:
$80,347
(% of AGI for various income ranges: 1371.1% for AGIs below $25k, 3731.4% for AGIs $25k-50k, 6092.2% for AGIs $50k-75k, 9196.7% for AGIs $75k-100k, 12040.0% for AGIs $100k-200k)
Taxable interest for individuals: $176 (reported on 9.7% of returns)
This zip code:
$176
Washington:
$2,077
(% of AGI for various income ranges: 0.4% for AGIs below $25k, 0.9% for AGIs $25k-50k, 3.0% for AGIs $50k-75k, 20.0% for AGIs $100k-200k)
Ordinary dividends: $800 (reported on 5.1% of returns)
Here:
$800
State:
$10,013
(% of AGI for various income ranges: 1.6% for AGIs $25k-50k, 6.3% for AGIs $50k-75k, 62.9% for AGIs $100k-200k)
Net capital gain/loss in AGI: +$1,562 (reported on 7.4% of returns)
Here:
+$1,562
State:
+$40,092
(% of AGI for various income ranges: 4.1% for AGIs $25k-50k, 17.8% for AGIs $50k-75k, 180.0% for AGIs $100k-200k)
Profit/loss from business: +$3,493 (reported on 8.5% of returns)
Here:
+$3,493
State:
+$18,312
(% of AGI for various income ranges: 52.2% for AGIs below $25k, 10.6% for AGIs $25k-50k, 77.8% for AGIs $50k-75k)
Earned income credit: $2,672 (reported on 34.7% of returns)
Here:
$2,672
State:
$2,020
(% of AGI for various income ranges: 142.4% for AGIs below $25k, 137.4% for AGIs $25k-50k, 4.8% for AGIs $50k-75k)
Percentage of individuals using paid preparers for their 2020 taxes: 96.6%
Here:
97%
State:
93%
(% for various income ranges: 94.2% for AGIs below $25k, 96.1% for AGIs $25k-50k, 100.0% for AGIs $50k-75k, 100.0% for AGIs $75k-100k, 100.0% for AGIs $100k-200k)
Averages for the 2012 tax year for zip code 98439, filed in 2013:
Average Adjusted Gross Income (AGI) in 2012: $29,095 (Individual Income Tax Returns)
Here:
$29,095
State:
$69,533
Salary/wage: $28,805 (reported on 95.7% of returns)
Here:
$28,805
State:
$57,267
(% of AGI for various income ranges: 94.1% for AGIs below $25k, 96.6% for AGIs $25k-50k, 91.6% for AGIs $50k-75k, 94.4% for AGIs $75k-100k, 94.1% for AGIs $100k-200k)
Taxable interest for individuals: $239 (reported on 11.2% of returns)
This zip code:
$239
Washington:
$1,816
(% of AGI for various income ranges: 0.1% for AGIs $50k-75k, 0.6% for AGIs $75k-100k)
Ordinary dividends: $557 (reported on 4.3% of returns)
Here:
$557
State:
$8,163
(% of AGI for various income ranges: 0.1% for AGIs $50k-75k, 0.6% for AGIs $75k-100k)
Net capital gain/loss in AGI: +$925 (reported on 2.5% of returns)
Here:
+$925
State:
+$21,568
Profit/loss from business: +$2,800 (reported on 3.7% of returns)
Here:
+$2,800
State:
+$16,521
(% of AGI for various income ranges: 1.4% for AGIs below $25k)
Total itemized deductions: $18,900 (30% of AGI, reported on 3.7% of returns)
Here:
$18,900
State:
$23,872
Here:
29.5% of AGI
State:
18.2% of AGI
Charity contributions: $4,575 (reported on 2.5% of returns)
Here:
$4,575
State:
$4,465
Taxes paid: $4,367 (reported on 3.7% of returns)
98439:
$4,367
State:
$6,400
Earned income credit: $2,863 (reported on 49.1% of returns)
Here:
$2,863
State:
$2,073
(% of AGI for various income ranges: 13.1% for AGIs below $25k, 3.9% for AGIs $25k-50k)
Percentage of individuals using paid preparers for their 2012 taxes: 37.9%
Here:
38%
State:
43%
(% for various income ranges: 41.5% for AGIs below $25k, 35.1% for AGIs $25k-50k, 33.3% for AGIs $50k-75k, 50.0% for AGIs $75k-100k)
Averages for the 2004 tax year for zip code 98439, filed in 2005:
Average Adjusted Gross Income (AGI) in 2004: $30,760 (Individual Income Tax Returns)
Here:
$30,760
State:
$54,331
Salary/wage: $28,416 (reported on 94.4% of returns)
Here:
$28,416
State:
$45,761
(% of AGI for various income ranges: 99.5% for AGIs below $10k, 93.5% for AGIs $10k-25k, 95.8% for AGIs $25k-50k, 89.8% for AGIs $50k-75k, 87.3% for AGIs $75k-100k, 43.5% for AGIs over 100k)
Taxable interest for individuals: $744 (reported on 21.5% of returns)
This zip code:
$744
Washington:
$2,110
(% of AGI for various income ranges: 0.4% for AGIs below $10k, 0.4% for AGIs $10k-25k, 0.3% for AGIs $25k-50k, 0.9% for AGIs $50k-75k, 0.3% for AGIs $75k-100k, 0.9% for AGIs over 100k)
Taxable dividends: $1,505 (reported on 10.1% of returns)
Here:
$1,505
State:
$5,879
(% of AGI for various income ranges: 0.5% for AGIs below $10k, 0.1% for AGIs $10k-25k, 0.1% for AGIs $25k-50k, 0.5% for AGIs $50k-75k, 0.5% for AGIs $75k-100k, 2.4% for AGIs over 100k)
Net capital gain/loss: +$1,797 (reported on 6.3% of returns)
Here:
+$1,797
State:
+$15,835
(% of AGI for various income ranges: 0.1% for AGIs $10k-25k, 0.1% for AGIs $25k-50k, 0.4% for AGIs $50k-75k, 0.0% for AGIs $75k-100k, 1.9% for AGIs over 100k)
Profit/loss from business: +$6,540 (reported on 7.3% of returns)
Here:
+$6,540
State:
+$13,994
(% of AGI for various income ranges: 2.0% for AGIs below $10k, 0.3% for AGIs $10k-25k, 0.9% for AGIs $25k-50k, 1.5% for AGIs $50k-75k, 10.4% for AGIs $75k-100k)
IRA payment deduction: $1,542 (reported on 1.3% of returns)
98439:
$1,542
Washington:
$3,001
Total itemized deductions: $17,650 (23% of AGI, reported on 8.5% of returns)
Here:
$17,650
State:
$19,669
Here:
23.0% of AGI
State:
20.7% of AGI
(% of AGI for various income ranges: 2.5% for AGIs $10k-25k, 3.7% for AGIs $25k-50k, 5.5% for AGIs $50k-75k, 9.2% for AGIs $75k-100k, 9.8% for AGIs over 100k)
Charity contributions deductions: $3,316 (4% of AGI, reported on 6.2% of returns)
Here:
$3,316
State:
$3,569
Here:
4.0% of AGI
State:
3.5% of AGI
(% of AGI for various income ranges: 0.2% for AGIs $10k-25k, 0.4% for AGIs $25k-50k, 0.7% for AGIs $50k-75k, 2.3% for AGIs $75k-100k, 1.3% for AGIs over 100k)
Total tax: $3,424 (reported on 52.9% of returns)
98439:
$3,424
State:
$9,065
(% of AGI for various income ranges: 1.6% for AGIs below $10k, 2.1% for AGIs $10k-25k, 3.7% for AGIs $25k-50k, 7.7% for AGIs $50k-75k, 10.4% for AGIs $75k-100k, 14.2% for AGIs over 100k)
Earned income credit: $1,842 (reported on 39.6% of returns)
Here:
$1,842
State:
$1,607
Percentage of individuals using paid preparers for their 2004 taxes: 58.2%
Here:
58%
State:
49%
(% for various income ranges: 63.3% for AGIs below $10k, 60.3% for AGIs $10k-25k, 55.3% for AGIs $25k-50k, 51.1% for AGIs $50k-75k, 56.6% for AGIs $75k-100k, 69.7% for AGIs over 100k)
Household received Food Stamps/SNAP in the past 12 months: 399 Household did not receive Food Stamps/SNAP in the past 12 months: 1,955
Women who had a birth in the past 12 months: 121 (125 now married, 0 unmarried) Women who did not have a birth in the past 12 months: 1,358 (932 now married, 416 unmarried)
Housing units in zip code 98439 with a mortgage: 13 Residents with income below the poverty level in 2022:
This zip code:
15.7%
Whole state:
10.0%
Residents with income below 50% of the poverty level in 2022:
This zip code:
8.1%
Whole state:
4.6%
Median number of rooms in houses and condos:
Here:
5.0
State:
6.5
Median number of rooms in apartments:
Here:
4.1
State:
3.9
Notable locations in this zip code not listed on our city pages
Notable locations in zip code 98439: Whispering Firs Golf Course (A), Fort Lewis - McChord Fire and Emergency Services Station 105 (B), Fort Lewis - McChord Fire and Emergency Services Station 103 (C), McChord Air Museum (D). Display/hide their locations on the map
Size of family households: 575 2-persons, 459 3-persons, 265 4-persons, 161 5-persons, 47 6-persons, 32 7-or-more-persons
Size of nonfamily households: 771 1-person, 32 2-persons
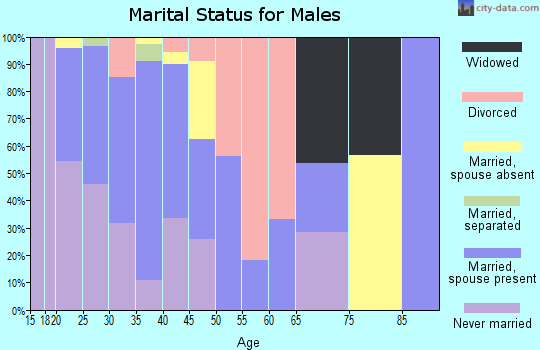
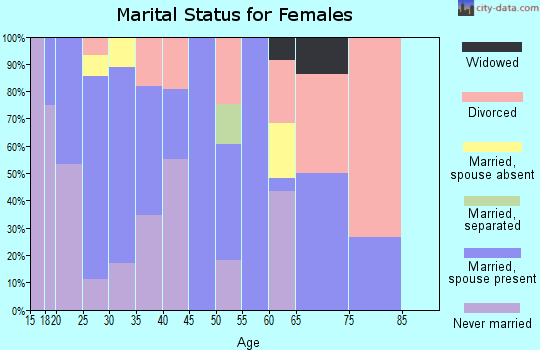
1,161 married couples with children.
663 single-parent households (123 men, 540 women).
72.2% of residents of 98439 zip code speak English at home.
24.9% of residents speak Spanish at home (85% very well, 9% well, 6% not well).
1.2% of residents speak other Indo-European language at home (92% very well, 8% well).
0.6% of residents speak Asian or Pacific Island language at home (73% very well, 27% not well).
Foreign born population: 432 (7.5%) (35.6% of them are naturalized citizens)
This zip code:
7.5%
Whole state:
15.3%
37%Honduras
18%Guatemala
13%Barbados
8%El Salvador
6%Serbia
3%Singapore
3%France
5%English
4%Italian
4%Irish
3%German
2%Ukrainian
2%Canadian
1%American
Year of entry for the foreign-born population
2142010 or later
1532000 to 2009
1691990 to 1999
34Before 1990
Facilities with environmental interests located in this zip code:
CLOVER PARK TECH COLLEGE FT LEWIS (14800 MURRAY RD in TACOMA, WA)
(Resource Conservation and Recovery Act (tracking hazardous waste)) STATE MASTER (Washington State Department of Ecology's Facility/Site identification system) - HAZWASTE-WAR000006973, HAZARDOUS WASTE PROGRAM Business SIC classification: NONCLASSIFIABLE ESTABLISHMENTS Organizations: MIKE ANDERSON (CONTACT/OPERATOR)
, WA CPTC (CONTACT/OWNER)
Alternative names: CLOVER PARK VOCATIONAL TECHNICAL INST
CARTER LAKE ELEMENTARY SCHOOL (3415 LINCOLN BLVD SW in TACOMA, WA)
(Geographic Names Information System) (National Center for Education Statistics) - STATE ID-3457 Organizations: CLOVER PARK SCHOOL DIST 400 (SCHOOL DISTRICT)
AMERICAN LAKE GARDENS/MCCHORD AFB (6411 146TH ST SW in TACOMA, WA) . Federal Facility
SUPERFUND NPL (Superfund database) Alternative names: AMERICAN LAKE GARDENS / MCCHORD AIR FORCE BASE, MCCHORD AFB AREA 'D', USAF MCCHORD AFB AMERICAN LAKE GARDENS
84.4%Electricity
10.5%Utility gas
4.7%No fuel used
0.5%Wood
Population in 1990: 3,064. Population change in the 1990s: +3,730 (+121.7%).
Place of birth for U.S.-born residents:
This state: 1,672
Northeast: 266
Midwest: 763
South: 1,295
West: 1,145
15% of the 98439 zip code residents lived in the same house 5 years ago. Out of people who lived in different houses, 28% lived in this county. Out of people who lived in different counties, 50% lived in Washington.
70% of the 98439 zip code residents lived in the same house 1 year ago. Out of people who lived in different houses, 33% moved from this county. Out of people who lived in different houses, 18% moved from different county within same state. Out of people who lived in different houses, 46% moved from different state. Out of people who lived in different houses, 4% moved from abroad.
Private vs. public school enrollment:
Students in private schools in grades 1 to 8 (elementary and middle school): 60
Here:
8.0%
Washington:
12.4%
Students in private schools in grades 9 to 12 (high school): 49
Here:
15.2%
Washington:
9.2%
Students in private undergraduate colleges: 217
Here:
59.4%
Washington:
16.5%
Occupation by median earnings in the past 12 months ($)
77,655Management occupations
41,109Installation, maintenance, and repair occupations
41,046Office and administrative support occupations
34,167Material moving occupations
32,711Construction and extraction occupations
31,097Production occupations
Companies with federal contracts located in this zip code:
MICHELSON, LARRY (6416 150TH ST SW in LAKEWOOD, WA; small business)
$5,410 with Army for Outerwear, Men's. Signed on 2003-07-26. Completion date: 2002-11-15.
Top industries in this zip code by the number of employees in 2005:
Health Care and Social Assistance: Other Individual and Family Services (250-499 employees: 1 establishment)
Construction: Drywall and Insulation Contractors (20-49: 1)
Construction: Painting and Wall Covering Contractors (10-19: 1)
Accommodation and Food Services: Limited-Service Restaurants (10-19: 1)
Real Estate and Rental and Leasing: Lessors of Nonresidential Buildings (except Miniwarehouses) (5-9: 1, 1-4: 1)
Health Care and Social Assistance: Services for the Elderly and Persons with Disabilities (5-9: 1)
Administrative and Support and Waste Management and Remediation Services: Office Administrative Services (5-9: 1)
Management of Companies and Enterprises: Corporate, Subsidiary, and Regional Managing Offices (1-4: 2)
People in group quarters in 2000:
619 people in military barracks, etc.
Home Mortgage Disclosure Act Aggregated Statistics For Year 2009 (Based on 4 partial tracts)
A) FHA, FSA/RHS & VA Home Purchase Loans
B) Conventional Home Purchase Loans
C) Refinancings
D) Home Improvement Loans
E) Loans on Dwellings For 5+ Families
F) Non-occupant Loans on < 5 Family Dwellings (A B C & D)
G) Loans On Manufactured Home Dwelling (A B C & D)
Number
Average Value
Number
Average Value
Number
Average Value
Number
Average Value
Number
Average Value
Number
Average Value
Number
Average Value
LOANS ORIGINATED
7
$146,039
2
$86,825
20
$236,943
2
$87,955
2
$1,624,760
3
$139,170
2
$83,425
APPLICATIONS APPROVED, NOT ACCEPTED
1
$98,910
0
$0
4
$310,615
0
$0
0
$0
1
$56,630
0
$0
APPLICATIONS DENIED
1
$107,210
1
$314,830
24
$210,915
2
$10,195
0
$0
4
$80,972
4
$353,450
APPLICATIONS WITHDRAWN
1
$74,750
0
$0
5
$352,132
1
$12,080
0
$0
0
$0
0
$0
FILES CLOSED FOR INCOMPLETENESS
0
$0
0
$0
2
$108,720
1
$67,950
0
$0
1
$67,950
0
$0
Aggregated Statistics For Year 2008 (Based on 4 partial tracts)
A) FHA, FSA/RHS & VA Home Purchase Loans
B) Conventional Home Purchase Loans
C) Refinancings
D) Home Improvement Loans
E) Loans on Dwellings For 5+ Families
F) Non-occupant Loans on < 5 Family Dwellings (A B C & D)
G) Loans On Manufactured Home Dwelling (A B C & D)
Number
Average Value
Number
Average Value
Number
Average Value
Number
Average Value
Number
Average Value
Number
Average Value
Number
Average Value
LOANS ORIGINATED
4
$187,995
14
$271,278
18
$226,793
5
$131,620
3
$34,850,923
5
$144,960
3
$189,503
APPLICATIONS APPROVED, NOT ACCEPTED
0
$0
0
$0
4
$309,628
0
$0
0
$0
0
$0
2
$287,055
APPLICATIONS DENIED
2
$147,225
2
$224,235
28
$358,305
11
$34,085
0
$0
8
$275,090
3
$317,417
APPLICATIONS WITHDRAWN
0
$0
4
$248,018
9
$217,873
0
$0
0
$0
2
$124,955
2
$62,665
FILES CLOSED FOR INCOMPLETENESS
0
$0
1
$85,310
1
$85,310
0
$0
0
$0
1
$85,310
0
$0
Aggregated Statistics For Year 2007 (Based on 4 partial tracts)
A) FHA, FSA/RHS & VA Home Purchase Loans
B) Conventional Home Purchase Loans
C) Refinancings
D) Home Improvement Loans
E) Loans on Dwellings For 5+ Families
F) Non-occupant Loans on < 5 Family Dwellings (A B C & D)
G) Loans On Manufactured Home Dwelling (A B C & D)
Number
Average Value
Number
Average Value
Number
Average Value
Number
Average Value
Number
Average Value
Number
Average Value
Number
Average Value
LOANS ORIGINATED
2
$160,060
34
$194,035
29
$188,620
2
$120,800
5
$531,672
21
$131,442
0
$0
APPLICATIONS APPROVED, NOT ACCEPTED
2
$253,330
5
$196,452
10
$239,033
1
$37,750
0
$0
3
$206,620
0
$0
APPLICATIONS DENIED
1
$167,610
16
$272,817
46
$173,773
5
$23,734
2
$3,084,375
7
$231,030
2
$17,365
APPLICATIONS WITHDRAWN
2
$211,415
9
$282,076
19
$178,115
1
$139,680
0
$0
5
$211,154
1
$180,440
FILES CLOSED FOR INCOMPLETENESS
0
$0
6
$126,923
7
$256,053
0
$0
0
$0
4
$210,255
0
$0
Aggregated Statistics For Year 2006 (Based on 4 partial tracts)
A) FHA, FSA/RHS & VA Home Purchase Loans
B) Conventional Home Purchase Loans
C) Refinancings
D) Home Improvement Loans
E) Loans on Dwellings For 5+ Families
F) Non-occupant Loans on < 5 Family Dwellings (A B C & D)
G) Loans On Manufactured Home Dwelling (A B C & D)
Number
Average Value
Number
Average Value
Number
Average Value
Number
Average Value
Number
Average Value
Number
Average Value
Number
Average Value
LOANS ORIGINATED
4
$142,318
32
$145,723
51
$173,250
6
$54,235
3
$1,353,213
24
$111,153
2
$119,670
APPLICATIONS APPROVED, NOT ACCEPTED
0
$0
8
$111,929
13
$139,965
2
$35,485
0
$0
6
$91,480
1
$12,080
APPLICATIONS DENIED
0
$0
14
$116,270
47
$137,279
8
$72,770
1
$528,500
14
$121,825
1
$64,930
APPLICATIONS WITHDRAWN
1
$106,460
13
$153,841
19
$187,163
2
$132,880
0
$0
9
$99,779
2
$296,100
FILES CLOSED FOR INCOMPLETENESS
0
$0
7
$197,400
14
$159,482
1
$151,000
0
$0
7
$172,279
0
$0
Aggregated Statistics For Year 2005 (Based on 4 partial tracts)
A) FHA, FSA/RHS & VA Home Purchase Loans
B) Conventional Home Purchase Loans
C) Refinancings
D) Home Improvement Loans
E) Loans on Dwellings For 5+ Families
F) Non-occupant Loans on < 5 Family Dwellings (A B C & D)
G) Loans On Manufactured Home Dwelling (A B C & D)
Number
Average Value
Number
Average Value
Number
Average Value
Number
Average Value
Number
Average Value
Number
Average Value
Number
Average Value
LOANS ORIGINATED
1
$129,860
62
$114,407
50
$174,277
8
$82,955
5
$543,752
29
$94,478
2
$91,735
APPLICATIONS APPROVED, NOT ACCEPTED
1
$119,290
15
$92,225
12
$219,390
1
$12,840
0
$0
5
$93,922
1
$44,550
APPLICATIONS DENIED
2
$164,225
19
$127,494
30
$150,259
10
$34,030
2
$368,065
7
$161,163
1
$83,050
APPLICATIONS WITHDRAWN
2
$145,585
20
$164,044
22
$117,155
2
$112,495
0
$0
5
$163,662
0
$0
FILES CLOSED FOR INCOMPLETENESS
0
$0
0
$0
8
$126,935
0
$0
0
$0
0
$0
0
$0
Aggregated Statistics For Year 2004 (Based on 4 partial tracts)
A) FHA, FSA/RHS & VA Home Purchase Loans
B) Conventional Home Purchase Loans
C) Refinancings
D) Home Improvement Loans
E) Loans on Dwellings For 5+ Families
F) Non-occupant Loans on < 5 Family Dwellings (A B C & D)
G) Loans On Manufactured Home Dwelling (A B C & D)
Number
Average Value
Number
Average Value
Number
Average Value
Number
Average Value
Number
Average Value
Number
Average Value
Number
Average Value
LOANS ORIGINATED
4
$154,020
45
$138,266
36
$140,220
3
$83,553
7
$665,479
19
$92,786
1
$76,250
APPLICATIONS APPROVED, NOT ACCEPTED
0
$0
12
$116,885
8
$149,175
2
$24,540
0
$0
2
$97,020
0
$0
APPLICATIONS DENIED
2
$138,920
22
$108,480
34
$125,020
7
$113,250
1
$254,440
8
$118,842
0
$0
APPLICATIONS WITHDRAWN
6
$154,008
5
$135,626
18
$126,541
2
$35,110
0
$0
2
$104,190
0
$0
FILES CLOSED FOR INCOMPLETENESS
0
$0
2
$144,960
5
$226,046
0
$0
0
$0
0
$0
1
$48,320
Aggregated Statistics For Year 2003 (Based on 4 partial tracts)
A) FHA, FSA/RHS & VA Home Purchase Loans
B) Conventional Home Purchase Loans
C) Refinancings
D) Home Improvement Loans
E) Loans on Dwellings For 5+ Families
F) Non-occupant Loans on < 5 Family Dwellings (A B C & D)
Number
Average Value
Number
Average Value
Number
Average Value
Number
Average Value
Number
Average Value
Number
Average Value
LOANS ORIGINATED
4
$121,178
45
$158,021
53
$128,429
5
$33,674
5
$1,747,362
27
$124,351
APPLICATIONS APPROVED, NOT ACCEPTED
2
$100,795
10
$90,272
11
$112,838
0
$0
0
$0
2
$88,335
APPLICATIONS DENIED
9
$105,849
12
$98,796
20
$85,466
7
$17,139
1
$216,690
9
$70,299
APPLICATIONS WITHDRAWN
1
$64,170
4
$123,630
18
$125,221
2
$35,110
0
$0
1
$52,850
FILES CLOSED FOR INCOMPLETENESS
0
$0
4
$77,960
3
$103,687
0
$0
0
$0
2
$58,135
Aggregated Statistics For Year 2002 (Based on 4 partial tracts)
A) FHA, FSA/RHS & VA Home Purchase Loans
B) Conventional Home Purchase Loans
C) Refinancings
D) Home Improvement Loans
E) Loans on Dwellings For 5+ Families
F) Non-occupant Loans on < 5 Family Dwellings (A B C & D)
Number
Average Value
Number
Average Value
Number
Average Value
Number
Average Value
Number
Average Value
Number
Average Value
LOANS ORIGINATED
6
$110,482
21
$133,491
37
$116,270
5
$25,924
2
$49,075
19
$81,182
APPLICATIONS APPROVED, NOT ACCEPTED
1
$79,280
7
$105,280
10
$126,064
0
$0
1
$226,500
2
$60,400
APPLICATIONS DENIED
4
$173,975
13
$89,682
24
$102,183
2
$166,100
0
$0
5
$77,464
APPLICATIONS WITHDRAWN
1
$98,910
3
$163,843
17
$99,438
2
$33,220
0
$0
6
$76,758
FILES CLOSED FOR INCOMPLETENESS
2
$166,935
2
$107,220
8
$94,576
0
$0
0
$0
1
$41,520
Aggregated Statistics For Year 2001 (Based on 4 partial tracts)
A) FHA, FSA/RHS & VA Home Purchase Loans
B) Conventional Home Purchase Loans
C) Refinancings
D) Home Improvement Loans
E) Loans on Dwellings For 5+ Families
F) Non-occupant Loans on < 5 Family Dwellings (A B C & D)
Number
Average Value
Number
Average Value
Number
Average Value
Number
Average Value
Number
Average Value
Number
Average Value
LOANS ORIGINATED
4
$89,845
20
$113,487
29
$105,812
4
$7,928
2
$568,895
8
$106,926
APPLICATIONS APPROVED, NOT ACCEPTED
0
$0
10
$76,691
5
$100,264
0
$0
0
$0
2
$89,090
APPLICATIONS DENIED
0
$0
9
$73,074
35
$80,486
0
$0
0
$0
5
$97,396
APPLICATIONS WITHDRAWN
2
$108,570
7
$103,337
16
$91,926
1
$74,750
0
$0
2
$105,325
FILES CLOSED FOR INCOMPLETENESS
1
$120,050
2
$60,400
4
$105,752
0
$0
0
$0
1
$83,050
Aggregated Statistics For Year 2000 (Based on 4 partial tracts)
A) FHA, FSA/RHS & VA Home Purchase Loans
B) Conventional Home Purchase Loans
C) Refinancings
D) Home Improvement Loans
E) Loans on Dwellings For 5+ Families
F) Non-occupant Loans on < 5 Family Dwellings (A B C & D)
Number
Average Value
Number
Average Value
Number
Average Value
Number
Average Value
Number
Average Value
Number
Average Value
LOANS ORIGINATED
6
$85,818
10
$168,592
16
$103,058
5
$18,120
2
$476,025
4
$315,402
APPLICATIONS APPROVED, NOT ACCEPTED
4
$100,270
8
$75,506
6
$78,143
0
$0
0
$0
3
$88,587
APPLICATIONS DENIED
3
$85,043
19
$51,108
17
$66,863
5
$10,528
0
$0
2
$38,125
APPLICATIONS WITHDRAWN
10
$95,980
17
$105,512
8
$77,230
0
$0
0
$0
8
$70,615
FILES CLOSED FOR INCOMPLETENESS
0
$0
2
$69,840
4
$62,288
0
$0
0
$0
0
$0
Aggregated Statistics For Year 1999 (Based on 2 partial tracts)
A) FHA, FSA/RHS & VA Home Purchase Loans
B) Conventional Home Purchase Loans
C) Refinancings
D) Home Improvement Loans
E) Loans on Dwellings For 5+ Families
F) Non-occupant Loans on < 5 Family Dwellings (A B C & D)
Detailed PMIC statistics for the following Tracts:0720.00
, 0729.01
2002 - 2018 National Fire Incident Reporting System (NFIRS) incidents
Based on the data from the years 2002 - 2018 the average number of fire incidents per year is 11. The highest number of fire incidents - 36 took place in 2018, and the least - 2 in 2004. The data has an increasing trend.
When looking into fire subcategories, the most incidents belonged to: Structure Fires (47.9%), and Outside Fires (41.1%).
Fire incident types reported to NFIRS in Zip Code 98439


 Nearest zip codes: 98438, 98499, 98498, 98430, 98444, 98447.


 Based on the data from the years 2002 - 2018 the average number of fire incidents per year is 11. The highest number of fire incidents - 36 took place in 2018, and the least - 2 in 2004. The data has an increasing trend.
 When looking into fire subcategories, the most incidents belonged to: Structure Fires (47.9%), and Outside Fires (41.1%).