Estimated zip code population in 2022: 2,821 Zip code population in 2010: 2,902 Zip code population in 2000: 2,599
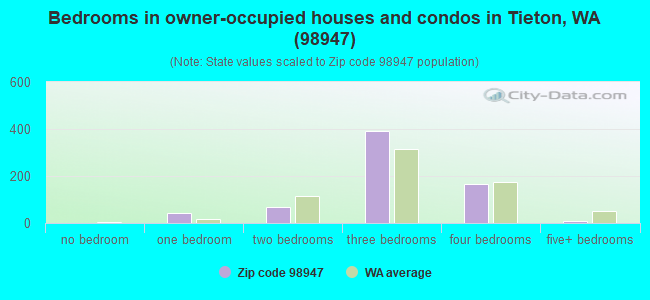
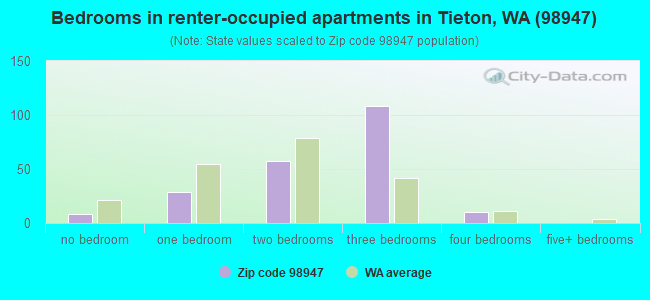
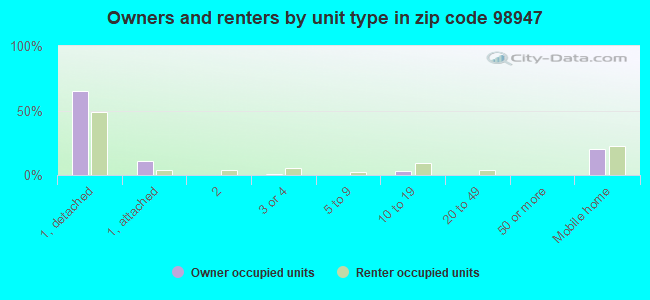
Houses and condos: 906 Renter-occupied apartments: 217
% of renters here:
24%
State:
36%
March 2022 cost of living index in zip code 98947: 87.2 (less than average, U.S. average is 100)
Land area: 41.3 sq. mi. Water area: 0.0 sq. mi.
Population density: 68 people per square mile
(very low).
OSM Map
General Map
Google Map
MSN Map
OSM Map
General Map
Google Map
MSN Map
OSM Map
General Map
Google Map
MSN Map
OSM Map
General Map
Google Map
MSN Map
Please wait while loading the map...
Real estate property taxes paid for housing units in 2022:
This zip code:
0.8% ($1,904)
Washington:
0.8% ($4,283)
Median real estate property taxes paid for housing units with mortgages in 2022: $1,720 (0.8%) Median real estate property taxes paid for housing units with no mortgage in 2022: $2,387 (1.0%)
Business Search- 14 Million verified businesses
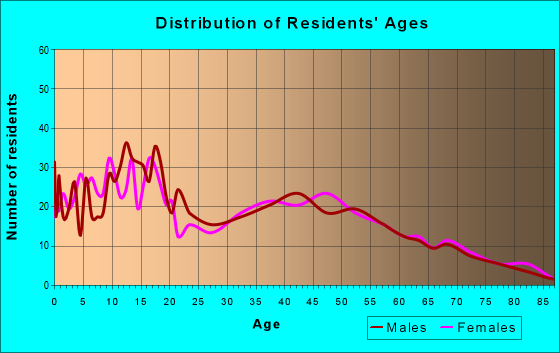
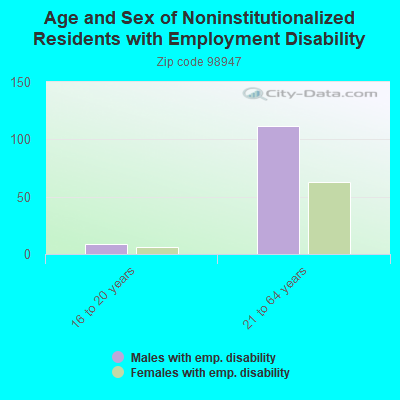
Males: 1,296
(46.0%)
Females: 1,524
(54.0%)
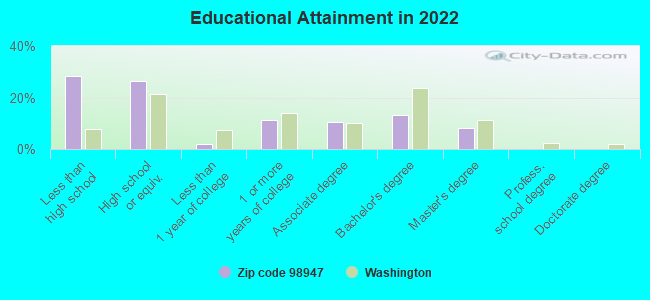
For population 25 years and over in 98947:
High school or higher: 71.0%
Bachelor's degree or higher: 21.4%
Graduate or professional degree: 8.4%
Unemployed: 0.4%
Mean travel time to work (commute): 20.3 minutes
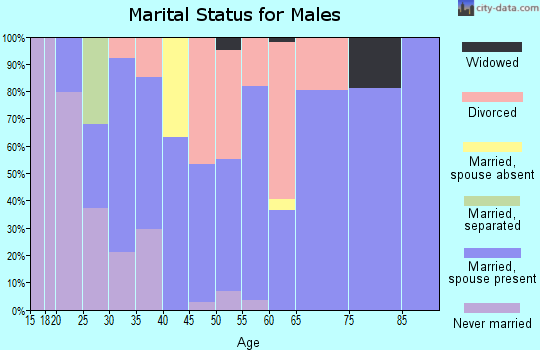
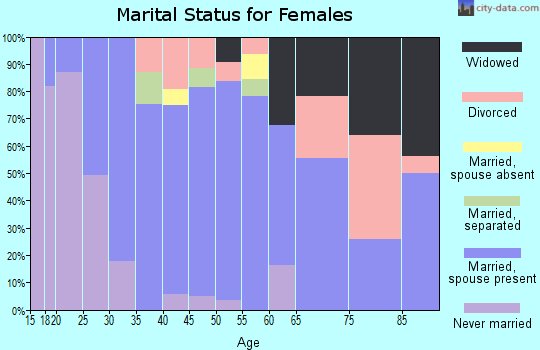
For population 15 years and over in 98947:
Never married: 38.6%
Now married: 44.1%
Separated: 1.9%
Widowed: 5.8%
Divorced: 9.5%
Zip code 98947 compared to state average:
Median household income below state average.
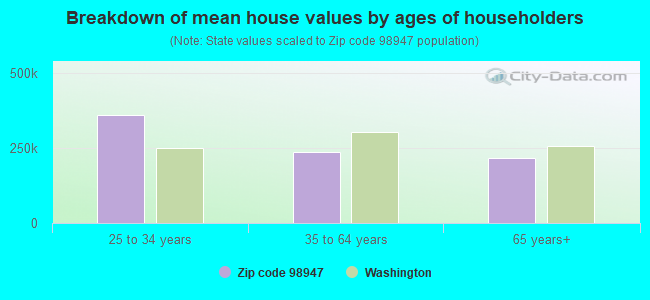
Median house value significantly below state average.
Unemployed percentage significantly below state average.
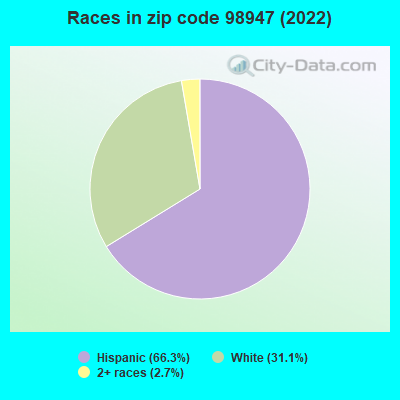
Black race population percentage significantly below state average.
Hispanic race population percentage significantly above state average.
Median age significantly below state average.
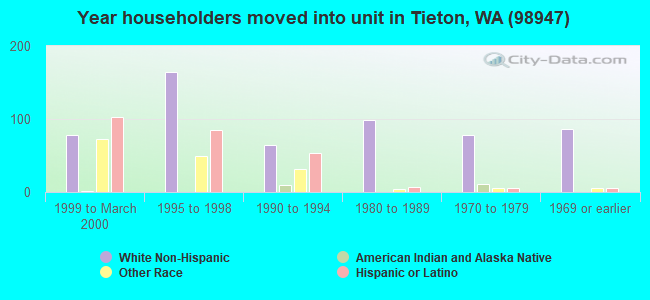
Length of stay since moving in significantly above state average.
Percentage of population with a bachelor's degree or higher significantly below state average.
Estimated median house/condo value in 2022: $232,059
98947:
$232,059
Washington:
$569,500
According to our research of Washington and other state lists, there were 3 registered sex offenders living in 98947 zip code as of April 19, 2024. The ratio of all residents to sex offenders in zip code 98947 is 1,054 to 1. The ratio of registered sex offenders to all residents in this zip code is near the state average.
Median resident age:
This zip code:
28.3 years
Washington median age:
38.4 years
Average household size:
This zip code:
3.1 people
Washington:
2.5 people
Averages for the 2020 tax year for zip code 98947, filed in 2021:
Average Adjusted Gross Income (AGI) in 2020: $51,023 (Individual Income Tax Returns)
Here:
$51,023
State:
$99,264
Salary/wage: $43,166 (reported on 92.4% of returns)
Here:
$43,166
State:
$80,347
(% of AGI for various income ranges: 1530.3% for AGIs below $25k, 3966.0% for AGIs $25k-50k, 7101.6% for AGIs $50k-75k, 10277.5% for AGIs $75k-100k, 13088.7% for AGIs $100k-200k)
Taxable interest for individuals: $605 (reported on 13.1% of returns)
This zip code:
$605
Washington:
$2,077
(% of AGI for various income ranges: 3.0% for AGIs below $25k, 2.4% for AGIs $25k-50k, 9.5% for AGIs $50k-75k, 3.8% for AGIs $75k-100k, 33.8% for AGIs $100k-200k)
Ordinary dividends: $3,700 (reported on 6.9% of returns)
Here:
$3,700
State:
$10,013
(% of AGI for various income ranges: 7.6% for AGIs below $25k, 20.0% for AGIs $50k-75k, 383.8% for AGIs $100k-200k)
Net capital gain/loss in AGI: +$5,050 (reported on 6.9% of returns)
Here:
+$5,050
State:
+$40,092
(% of AGI for various income ranges: 8.2% for AGIs below $25k, 29.5% for AGIs $50k-75k, 527.5% for AGIs $100k-200k)
Profit/loss from business: +$7,270 (reported on 6.9% of returns)
Here:
+$7,270
State:
+$18,312
(% of AGI for various income ranges: 42.7% for AGIs below $25k, 54.8% for AGIs $25k-50k, 445.0% for AGIs $75k-100k)
Taxable individual retirement arrangement distribution: $17,160 (reported on 3.4% of returns)
98947:
$17,160
Washington:
$24,221
(% of AGI for various income ranges: 65.2% for AGIs below $25k, 803.8% for AGIs $75k-100k)
Total itemized deductions: $30,375 (reported on 2.8% of returns)
Here:
$30,375
State:
$39,068
(% of AGI for various income ranges: 639.5% for AGIs $50k-75k)
Charity contributions: $6,900 (reported on 1.4% of returns)
Here:
$6,900
State:
$15,331
(% of AGI for various income ranges: 32.9% for AGIs $25k-50k)
Taxes paid: $5,000 (reported on 2.8% of returns)
98947:
$5,000
State:
$7,774
(% of AGI for various income ranges: 105.3% for AGIs $50k-75k)
Earned income credit: $2,336 (reported on 19.3% of returns)
Here:
$2,336
State:
$2,020
(% of AGI for various income ranges: 89.1% for AGIs below $25k, 85.7% for AGIs $25k-50k)
Percentage of individuals using paid preparers for their 2020 taxes: 92.4%
Here:
92%
State:
93%
(% for various income ranges: 88.9% for AGIs below $25k, 96.0% for AGIs $25k-50k, 96.0% for AGIs $50k-75k, 90.9% for AGIs $75k-100k, 90.9% for AGIs $100k-200k, 66.7% for AGIs over 200k)
Averages for the 2012 tax year for zip code 98947, filed in 2013:
Average Adjusted Gross Income (AGI) in 2012: $38,893 (Individual Income Tax Returns)
Here:
$38,893
State:
$69,533
Salary/wage: $33,601 (reported on 92.3% of returns)
Here:
$33,601
State:
$57,267
(% of AGI for various income ranges: 89.1% for AGIs below $25k, 86.7% for AGIs $25k-50k, 82.1% for AGIs $50k-75k, 75.6% for AGIs $75k-100k, 65.9% for AGIs $100k-200k)
Taxable interest for individuals: $642 (reported on 16.2% of returns)
This zip code:
$642
Washington:
$1,816
(% of AGI for various income ranges: 0.4% for AGIs below $25k, 0.2% for AGIs $25k-50k, 0.2% for AGIs $50k-75k, 0.4% for AGIs $100k-200k)
Ordinary dividends: $3,733 (reported on 7.7% of returns)
Here:
$3,733
State:
$8,163
(% of AGI for various income ranges: 0.9% for AGIs below $25k, 1.4% for AGIs $50k-75k, 1.2% for AGIs $100k-200k)
Net capital gain/loss in AGI: +$2,650 (reported on 5.1% of returns)
Here:
+$2,650
State:
+$21,568
Profit/loss from business: +$7,600 (reported on 8.5% of returns)
Here:
+$7,600
State:
+$16,521
(% of AGI for various income ranges: 2.4% for AGIs below $25k, 2.7% for AGIs $25k-50k, 2.6% for AGIs $50k-75k)
Taxable individual retirement arrangement distribution: $9,883 (reported on 5.1% of returns)
98947:
$9,883
Washington:
$18,648
Total itemized deductions: $18,188 (22% of AGI, reported on 13.7% of returns)
Here:
$18,188
State:
$23,872
Here:
22.1% of AGI
State:
18.2% of AGI
(% of AGI for various income ranges: 4.7% for AGIs below $25k, 4.9% for AGIs $25k-50k, 8.4% for AGIs $50k-75k, 8.0% for AGIs $75k-100k, 6.8% for AGIs $100k-200k)
Charity contributions: $3,364 (reported on 9.4% of returns)
Here:
$3,364
State:
$4,465
(% of AGI for various income ranges: 0.5% for AGIs $25k-50k, 1.8% for AGIs $50k-75k, 1.2% for AGIs $100k-200k)
Taxes paid: $3,775 (reported on 13.7% of returns)
98947:
$3,775
State:
$6,400
(% of AGI for various income ranges: 0.7% for AGIs below $25k, 0.8% for AGIs $25k-50k, 1.6% for AGIs $50k-75k, 1.8% for AGIs $75k-100k, 1.9% for AGIs $100k-200k)
Earned income credit: $2,307 (reported on 25.6% of returns)
Here:
$2,307
State:
$2,073
(% of AGI for various income ranges: 6.6% for AGIs below $25k, 1.6% for AGIs $25k-50k)
Percentage of individuals using paid preparers for their 2012 taxes: 60.7%
Here:
61%
State:
43%
(% for various income ranges: 58.2% for AGIs below $25k, 64.7% for AGIs $25k-50k, 60.0% for AGIs $50k-75k, 66.7% for AGIs $75k-100k, 57.1% for AGIs $100k-200k)
Averages for the 2004 tax year for zip code 98947, filed in 2005:
Average Adjusted Gross Income (AGI) in 2004: $31,372 (Individual Income Tax Returns)
Here:
$31,372
State:
$54,331
Salary/wage: $29,620 (reported on 91.3% of returns)
Here:
$29,620
State:
$45,761
(% of AGI for various income ranges: 90.1% for AGIs $10k-25k, 90.2% for AGIs $25k-50k, 85.3% for AGIs $50k-75k, 84.0% for AGIs $75k-100k, 46.1% for AGIs over 100k)
Taxable interest for individuals: $1,484 (reported on 31.6% of returns)
This zip code:
$1,484
Washington:
$2,110
(% of AGI for various income ranges: 1.3% for AGIs $10k-25k, 1.1% for AGIs $25k-50k, 1.0% for AGIs $50k-75k, 0.5% for AGIs $75k-100k, 1.8% for AGIs over 100k)
Taxable dividends: $2,656 (reported on 13.1% of returns)
Here:
$2,656
State:
$5,879
(% of AGI for various income ranges: 0.5% for AGIs $10k-25k, 0.3% for AGIs $25k-50k, 2.4% for AGIs $50k-75k, 0.2% for AGIs $75k-100k, 1.5% for AGIs over 100k)
Net capital gain/loss: +$2,378 (reported on 9.8% of returns)
Here:
+$2,378
State:
+$15,835
(% of AGI for various income ranges: -0.1% for AGIs $10k-25k, -0.2% for AGIs $25k-50k, 0.2% for AGIs $50k-75k, 3.4% for AGIs over 100k)
Profit/loss from business: +$5,188 (reported on 9.6% of returns)
Here:
+$5,188
State:
+$13,994
(% of AGI for various income ranges: 2.5% for AGIs $10k-25k, 1.3% for AGIs $25k-50k, 1.2% for AGIs $50k-75k, 1.6% for AGIs $75k-100k)
IRA payment deduction: $1,154 (reported on 1.3% of returns)
98947:
$1,154
Washington:
$3,001
Total itemized deductions: $15,655 (23% of AGI, reported on 17.4% of returns)
Here:
$15,655
State:
$19,669
Here:
23.0% of AGI
State:
20.7% of AGI
(% of AGI for various income ranges: 6.5% for AGIs $10k-25k, 6.7% for AGIs $25k-50k, 12.4% for AGIs $50k-75k, 11.0% for AGIs $75k-100k, 7.1% for AGIs over 100k)
Charity contributions deductions: $2,132 (3% of AGI, reported on 11.4% of returns)
Here:
$2,132
State:
$3,569
Here:
3.3% of AGI
State:
3.5% of AGI
(% of AGI for various income ranges: 0.3% for AGIs $10k-25k, 0.4% for AGIs $25k-50k, 1.4% for AGIs $50k-75k, 1.0% for AGIs $75k-100k, 0.8% for AGIs over 100k)
Total tax: $4,214 (reported on 57.5% of returns)
98947:
$4,214
State:
$9,065
(% of AGI for various income ranges: 2.4% for AGIs $10k-25k, 4.4% for AGIs $25k-50k, 7.9% for AGIs $50k-75k, 11.1% for AGIs $75k-100k, 15.4% for AGIs over 100k)
Earned income credit: $1,988 (reported on 24.2% of returns)
Here:
$1,988
State:
$1,607
Percentage of individuals using paid preparers for their 2004 taxes: 63.5%
Here:
64%
State:
49%
(% for various income ranges: 60.2% for AGIs below $10k, 65.8% for AGIs $10k-25k, 62.9% for AGIs $25k-50k, 61.1% for AGIs $50k-75k, 67.4% for AGIs $75k-100k, 67.9% for AGIs over 100k)
Household received Food Stamps/SNAP in the past 12 months: 211 Household did not receive Food Stamps/SNAP in the past 12 months: 687
Women who had a birth in the past 12 months: 16 (8 now married, 7 unmarried) Women who did not have a birth in the past 12 months: 646 (238 now married, 409 unmarried)
Housing units in zip code 98947 with a mortgage: 388 (28 second mortgage, 28 both second mortgage and home equity loan) Median monthly owner costs for units with a mortgage: $1,323 Median monthly owner costs for units without a mortgage: $529
Residents with income below the poverty level in 2022:
This zip code:
15.5%
Whole state:
10.0%
Residents with income below 50% of the poverty level in 2022:
This zip code:
7.4%
Whole state:
4.6%
Median number of rooms in houses and condos:
Here:
5.9
State:
6.5
Median number of rooms in apartments:
Here:
4.0
State:
3.9
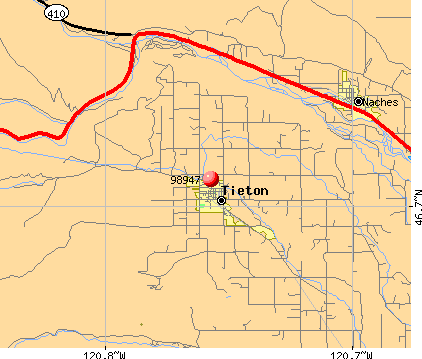
Notable locations in this zip code not listed on our city pages
Notable locations in zip code 98947: Yakima County Fire District 1 Highland (A), Tieton Volunteer Fire Department (B). Display/hide their locations on the map
Size of family households: 151 2-persons, 206 3-persons, 129 4-persons, 115 5-persons, 24 6-persons, 47 7-or-more-persons
Size of nonfamily households: 180 1-person, 36 2-persons
413 married couples with children.
528 single-parent households (34 men, 494 women).
43.9% of residents of 98947 zip code speak English at home.
55.2% of residents speak Spanish at home (62% very well, 13% well, 19% not well, 5% not at all).
Foreign born population: 597 (21.2%) (23.4% of them are naturalized citizens)
This zip code:
21.2%
Whole state:
15.3%
97%Honduras
2%Greece
1%Costa Rica
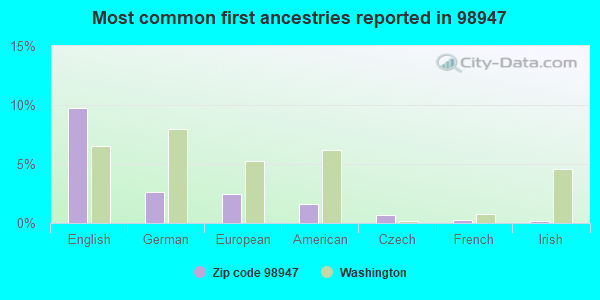
10%English
3%German
2%European
2%American
1%Czech
0%French
0%Irish
Year of entry for the foreign-born population
1292010 or later
1812000 to 2009
1461990 to 1999
169Before 1990
Facilities with environmental interests located in this zip code:
AT&T TIETON (16.5 MILES W OF in TIETON, WA)
Conditionally Exempt Small Quantity Generators, less than 100 kg/month of hazardous waste (Resource Conservation and Recovery Act (tracking hazardous waste)) STATE MASTER (Washington State Department of Ecology's Facility/Site identification system) - HAZWASTE-WAT540010154, EPCRA, CESQG Business SIC classification: TELEPHONE COMMUNICATIONS, EXCEPT RADIOTELEPHONE Organizations: AT&T CORP (CONTACT/ HAZARDOUS WASTE)
, VERN WOLD (CONTACT/OPERATOR)
Alternative names: AT&T TIETON WA0500 TITNWAQ7061
CDM ENTERPRISES LLC (19851 SUMMITVIEW in TIETON, WA)
Conditionally Exempt Small Quantity Generators, less than 100 kg/month of hazardous waste (Resource Conservation and Recovery Act (tracking hazardous waste)) STATE MASTER (Washington State Department of Ecology's Facility/Site identification system) - TOXICS-11239, LEAKING STORAGE TANK, UNDERGROUND STORAGE TANK PROGRAM, HAZWASTE-WAD988515540, CESQG Business SIC classification: GASOLINE SERVICE STATIONS; MISCELLANEOUS RETAIL STORES; GENERAL AUTOMOTIVE REPAIR SHOPS Organizations: UPPER VALLEY FARM SVC CTR (CONTACT/OPERATOR)
, UPPER VALLEY FARM SVC CENTER (CONTACT/OWNER)
Alternative names: UPPER VALLEY FARM SVC CENTER
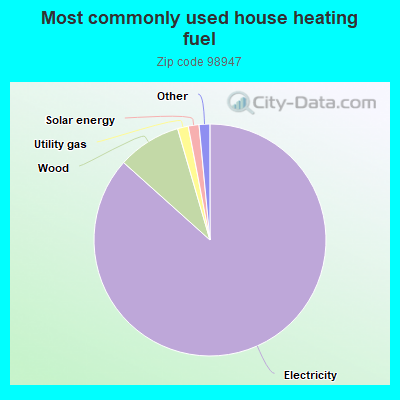
86.9%Electricity
8.9%Wood
1.5%Utility gas
1.5%Solar energy
0.9%Fuel oil, kerosene, etc.
0.6%Bottled, tank, or LP gas
Population in 1990: 2,079. Population change in the 1990s: +520 (+25.0%).
Place of birth for U.S.-born residents:
This state: 1,841
Northeast: 47
Midwest: 35
South: 62
West: 194
51% of the 98947 zip code residents lived in the same house 5 years ago. Out of people who lived in different houses, 89% lived in this county. Out of people who lived in different counties, 50% lived in Washington.
89% of the 98947 zip code residents lived in the same house 1 year ago. Out of people who lived in different houses, 64% moved from this county. Out of people who lived in different houses, 32% moved from different county within same state.
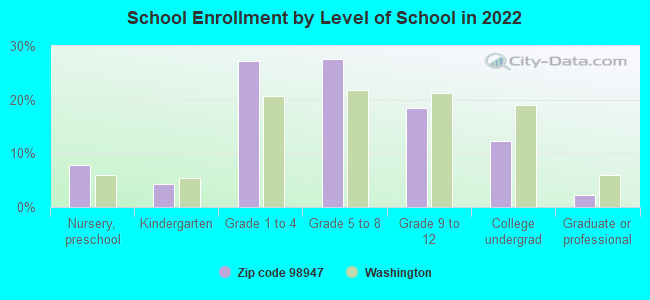
Private vs. public school enrollment:
Students in private schools in grades 1 to 8 (elementary and middle school): 7
Here:
1.3%
Washington:
12.4%
Students in private schools in grades 9 to 12 (high school): 4
Here:
2.4%
Washington:
9.2%
Students in private undergraduate colleges: 30
Here:
22.7%
Washington:
16.5%
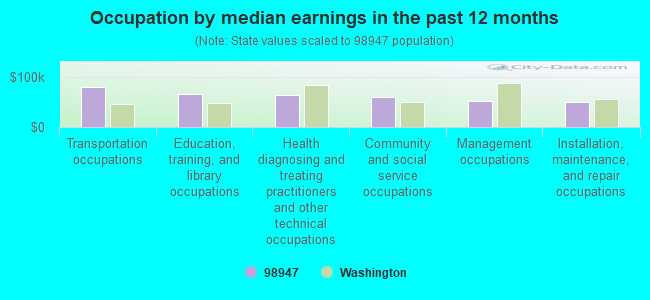
Occupation by median earnings in the past 12 months ($)
80,744Transportation occupations
65,678Education, training, and library occupations
63,756Health diagnosing and treating practitioners and other technical occupations
60,887Community and social service occupations
52,041Management occupations
50,574Installation, maintenance, and repair occupations
Top industries in this zip code by the number of employees in 2005:
Construction: New Single-Family Housing Construction (except Operative Builders) (5-9 employees: 2 establishments, 1-4 employees: 1 establishment)
Real Estate and Rental and Leasing: Lessors of Residential Buildings and Dwellings (10-19: 1)
Construction: Site Preparation Contractors (10-19: 1)
Construction: Residential Remodelers (1-4: 2)
Other Services (except Public Administration): Religious Organizations (1-4: 2)
Educational Services: All Other Miscellaneous Schools and Instruction (1-4: 1)
Fatal accident statistics in 2012:
Fatal accident count: 1
Vehicles involved in fatal accidents: 2
Fatal accidents caused by drunken drivers: 0
Fatalities: 1
Persons involved in fatal accidents: 2
Pedestrians involved in fatal accidents: 0
Fatal accident statistics in 2011:
Fatal accident count: 1
Vehicles involved in fatal accidents: 1
Fatal accidents caused by drunken drivers: 0
Fatalities: 1
Persons involved in fatal accidents: 2
Pedestrians involved in fatal accidents: 0
Home Mortgage Disclosure Act Aggregated Statistics For Year 2009 (Based on 2 partial tracts)
A) FHA, FSA/RHS & VA Home Purchase Loans
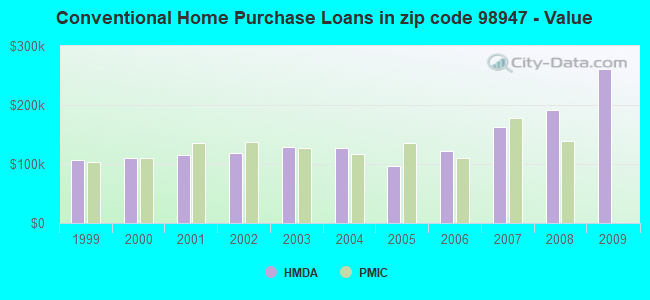
B) Conventional Home Purchase Loans
C) Refinancings
D) Home Improvement Loans
F) Non-occupant Loans on < 5 Family Dwellings (A B C & D)
G) Loans On Manufactured Home Dwelling (A B C & D)
Number
Average Value
Number
Average Value
Number
Average Value
Number
Average Value
Number
Average Value
Number
Average Value
LOANS ORIGINATED
11
$155,040
13
$261,312
99
$190,663
9
$53,887
9
$202,763
12
$101,402
APPLICATIONS APPROVED, NOT ACCEPTED
1
$27,670
2
$307,665
9
$191,273
1
$171,130
1
$39,320
3
$129,377
APPLICATIONS DENIED
6
$130,468
7
$218,251
44
$188,091
4
$19,842
1
$7,280
6
$106,803
APPLICATIONS WITHDRAWN
4
$150,555
4
$225,742
33
$166,846
2
$83,745
1
$294,190
7
$120,257
FILES CLOSED FOR INCOMPLETENESS
1
$104,130
0
$0
9
$176,952
1
$65,540
0
$0
1
$67,720
Aggregated Statistics For Year 2008 (Based on 2 partial tracts)
A) FHA, FSA/RHS & VA Home Purchase Loans
B) Conventional Home Purchase Loans
C) Refinancings
D) Home Improvement Loans
F) Non-occupant Loans on < 5 Family Dwellings (A B C & D)
G) Loans On Manufactured Home Dwelling (A B C & D)
Number
Average Value
Number
Average Value
Number
Average Value
Number
Average Value
Number
Average Value
Number
Average Value
LOANS ORIGINATED
12
$161,114
25
$191,604
58
$168,804
11
$75,997
9
$127,436
17
$105,204
APPLICATIONS APPROVED, NOT ACCEPTED
0
$0
0
$0
6
$191,880
1
$37,870
0
$0
1
$334,970
APPLICATIONS DENIED
4
$120,335
7
$315,519
40
$131,313
9
$45,310
4
$88,840
10
$92,336
APPLICATIONS WITHDRAWN
3
$118,697
6
$275,745
23
$122,939
5
$73,256
1
$78,650
9
$108,907
FILES CLOSED FOR INCOMPLETENESS
1
$107,050
1
$241,760
4
$112,142
1
$145,640
0
$0
0
$0
Aggregated Statistics For Year 2007 (Based on 2 partial tracts)
A) FHA, FSA/RHS & VA Home Purchase Loans
B) Conventional Home Purchase Loans
C) Refinancings
D) Home Improvement Loans
F) Non-occupant Loans on < 5 Family Dwellings (A B C & D)
G) Loans On Manufactured Home Dwelling (A B C & D)
Number
Average Value
Number
Average Value
Number
Average Value
Number
Average Value
Number
Average Value
Number
Average Value
LOANS ORIGINATED
3
$114,570
58
$162,389
71
$144,573
14
$87,852
9
$145,236
19
$114,097
APPLICATIONS APPROVED, NOT ACCEPTED
0
$0
10
$117,313
9
$222,991
2
$94,300
3
$93,697
1
$145,640
APPLICATIONS DENIED
1
$213,360
8
$164,209
62
$156,081
8
$73,821
1
$189,330
12
$117,543
APPLICATIONS WITHDRAWN
0
$0
5
$185,400
28
$130,790
5
$84,326
1
$455,130
5
$134,862
FILES CLOSED FOR INCOMPLETENESS
0
$0
3
$100,977
11
$186,022
0
$0
1
$129,620
0
$0
Aggregated Statistics For Year 2006 (Based on 2 partial tracts)
A) FHA, FSA/RHS & VA Home Purchase Loans
B) Conventional Home Purchase Loans
C) Refinancings
D) Home Improvement Loans
F) Non-occupant Loans on < 5 Family Dwellings (A B C & D)
G) Loans On Manufactured Home Dwelling (A B C & D)
Number
Average Value
Number
Average Value
Number
Average Value
Number
Average Value
Number
Average Value
Number
Average Value
LOANS ORIGINATED
7
$118,280
63
$121,609
60
$113,915
15
$42,964
9
$117,563
25
$114,968
APPLICATIONS APPROVED, NOT ACCEPTED
0
$0
10
$131,440
14
$132,116
1
$104,130
1
$45,880
2
$88,110
APPLICATIONS DENIED
4
$124,888
26
$123,010
48
$116,755
15
$31,604
8
$73,092
17
$101,734
APPLICATIONS WITHDRAWN
4
$107,592
11
$143,389
31
$141,153
2
$146,370
0
$0
7
$113,183
FILES CLOSED FOR INCOMPLETENESS
0
$0
0
$0
8
$130,894
0
$0
0
$0
0
$0
Aggregated Statistics For Year 2005 (Based on 2 partial tracts)
A) FHA, FSA/RHS & VA Home Purchase Loans
B) Conventional Home Purchase Loans
C) Refinancings
D) Home Improvement Loans
F) Non-occupant Loans on < 5 Family Dwellings (A B C & D)
G) Loans On Manufactured Home Dwelling (A B C & D)
Number
Average Value
Number
Average Value
Number
Average Value
Number
Average Value
Number
Average Value
Number
Average Value
LOANS ORIGINATED
15
$110,929
67
$96,938
62
$138,158
7
$71,364
11
$84,140
22
$92,845
APPLICATIONS APPROVED, NOT ACCEPTED
1
$104,860
7
$104,653
14
$125,094
5
$25,342
1
$132,530
1
$115,060
APPLICATIONS DENIED
2
$116,150
17
$96,722
76
$116,809
9
$34,468
2
$144,550
19
$83,819
APPLICATIONS WITHDRAWN
3
$82,043
9
$112,386
44
$129,934
7
$106,733
1
$127,430
9
$81,559
FILES CLOSED FOR INCOMPLETENESS
1
$94,670
4
$101,585
7
$124,106
1
$41,510
1
$78,650
1
$215,550
Aggregated Statistics For Year 2004 (Based on 2 partial tracts)
A) FHA, FSA/RHS & VA Home Purchase Loans
B) Conventional Home Purchase Loans
C) Refinancings
D) Home Improvement Loans
E) Loans on Dwellings For 5+ Families
F) Non-occupant Loans on < 5 Family Dwellings (A B C & D)
G) Loans On Manufactured Home Dwelling (A B C & D)
Number
Average Value
Number
Average Value
Number
Average Value
Number
Average Value
Number
Average Value
Number
Average Value
Number
Average Value
LOANS ORIGINATED
11
$121,014
55
$127,793
66
$121,356
15
$34,614
0
$0
9
$87,384
22
$91,356
APPLICATIONS APPROVED, NOT ACCEPTED
1
$133,260
8
$189,969
15
$151,563
3
$56,800
0
$0
2
$154,740
0
$0
APPLICATIONS DENIED
1
$95,390
13
$103,965
47
$119,487
11
$49,584
1
$69,910
1
$87,380
12
$94,788
APPLICATIONS WITHDRAWN
1
$165,300
6
$167,365
31
$135,422
1
$89,570
0
$0
1
$87,380
9
$101,220
FILES CLOSED FOR INCOMPLETENESS
1
$99,760
4
$184,962
7
$142,623
0
$0
0
$0
0
$0
1
$99,760
Aggregated Statistics For Year 2003 (Based on 2 partial tracts)
A) FHA, FSA/RHS & VA Home Purchase Loans
B) Conventional Home Purchase Loans
C) Refinancings
D) Home Improvement Loans
F) Non-occupant Loans on < 5 Family Dwellings (A B C & D)
Number
Average Value
Number
Average Value
Number
Average Value
Number
Average Value
Number
Average Value
LOANS ORIGINATED
17
$105,932
42
$128,059
149
$122,533
10
$47,479
7
$84,576
APPLICATIONS APPROVED, NOT ACCEPTED
0
$0
7
$73,131
20
$104,060
1
$16,020
0
$0
APPLICATIONS DENIED
2
$152,195
20
$126,416
48
$118,211
4
$25,305
2
$88,110
APPLICATIONS WITHDRAWN
1
$85,200
5
$76,606
25
$102,298
1
$14,560
1
$75,000
FILES CLOSED FOR INCOMPLETENESS
0
$0
1
$173,310
9
$135,931
0
$0
1
$72,820
Aggregated Statistics For Year 2002 (Based on 2 partial tracts)
A) FHA, FSA/RHS & VA Home Purchase Loans
B) Conventional Home Purchase Loans
C) Refinancings
D) Home Improvement Loans
F) Non-occupant Loans on < 5 Family Dwellings (A B C & D)
Number
Average Value
Number
Average Value
Number
Average Value
Number
Average Value
Number
Average Value
LOANS ORIGINATED
14
$92,481
40
$118,788
95
$126,247
6
$30,342
8
$73,002
APPLICATIONS APPROVED, NOT ACCEPTED
1
$112,140
9
$97,498
14
$107,149
1
$14,560
2
$65,900
APPLICATIONS DENIED
3
$91,267
7
$131,909
33
$94,291
7
$21,430
1
$61,170
APPLICATIONS WITHDRAWN
3
$97,337
4
$144,548
25
$99,181
0
$0
1
$42,960
FILES CLOSED FOR INCOMPLETENESS
0
$0
3
$156,807
4
$111,960
0
$0
1
$66,270
Aggregated Statistics For Year 2001 (Based on 2 partial tracts)
A) FHA, FSA/RHS & VA Home Purchase Loans
B) Conventional Home Purchase Loans
C) Refinancings
D) Home Improvement Loans
F) Non-occupant Loans on < 5 Family Dwellings (A B C & D)
Number
Average Value
Number
Average Value
Number
Average Value
Number
Average Value
Number
Average Value
LOANS ORIGINATED
9
$98,954
33
$114,747
102
$107,081
10
$28,327
11
$60,970
APPLICATIONS APPROVED, NOT ACCEPTED
1
$102,680
11
$70,702
12
$134,171
1
$8,740
2
$83,380
APPLICATIONS DENIED
1
$109,230
21
$73,583
45
$101,770
6
$44,905
7
$107,670
APPLICATIONS WITHDRAWN
1
$64,810
7
$92,066
29
$105,288
3
$18,203
0
$0
FILES CLOSED FOR INCOMPLETENESS
0
$0
0
$0
4
$157,655
0
$0
1
$98,310
Aggregated Statistics For Year 2000 (Based on 2 partial tracts)
A) FHA, FSA/RHS & VA Home Purchase Loans
B) Conventional Home Purchase Loans
C) Refinancings
D) Home Improvement Loans
F) Non-occupant Loans on < 5 Family Dwellings (A B C & D)
Number
Average Value
Number
Average Value
Number
Average Value
Number
Average Value
Number
Average Value
LOANS ORIGINATED
5
$107,192
47
$110,314
31
$108,196
10
$23,157
6
$73,183
APPLICATIONS APPROVED, NOT ACCEPTED
1
$76,460
7
$108,606
17
$98,136
2
$48,790
1
$100,490
APPLICATIONS DENIED
1
$94,670
25
$82,607
39
$64,324
7
$17,789
3
$83,500
APPLICATIONS WITHDRAWN
3
$96,123
5
$66,848
15
$61,315
0
$0
0
$0
FILES CLOSED FOR INCOMPLETENESS
0
$0
2
$83,015
7
$98,203
0
$0
0
$0
Aggregated Statistics For Year 1999 (Based on 1 partial tract)
A) FHA, FSA/RHS & VA Home Purchase Loans
B) Conventional Home Purchase Loans
C) Refinancings
D) Home Improvement Loans
F) Non-occupant Loans on < 5 Family Dwellings (A B C & D)
Detailed PMIC statistics for the following Tracts:0029.00
2002 - 2018 National Fire Incident Reporting System (NFIRS) incidents
Based on the data from the years 2002 - 2018 the average number of fire incidents per year is 24. The highest number of reported fire incidents - 55 took place in 2007, and the least - 9 in 2013. The data has a declining trend.
When looking into fire subcategories, the most reports belonged to: Structure Fires (45.1%), and Outside Fires (45.1%).
Fire incident types reported to NFIRS in Zip Code 98947


 Nearest zip codes: 98923, 98908, 98942, 98903, 98902, 98933.


 Based on the data from the years 2002 - 2018 the average number of fire incidents per year is 24. The highest number of reported fire incidents - 55 took place in 2007, and the least - 9 in 2013. The data has a declining trend.
 When looking into fire subcategories, the most reports belonged to: Structure Fires (45.1%), and Outside Fires (45.1%).