Estimated zip code population in 2022: 51,978 Zip code population in 2010: 48,753 Zip code population in 2000: 40,820
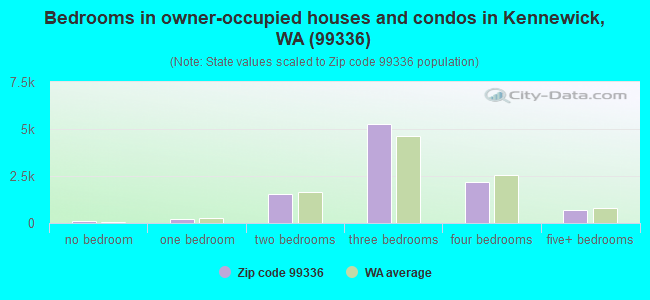
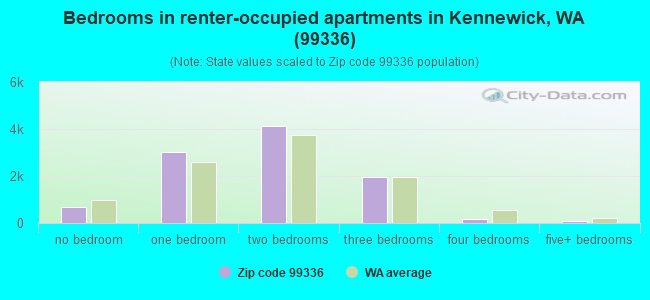
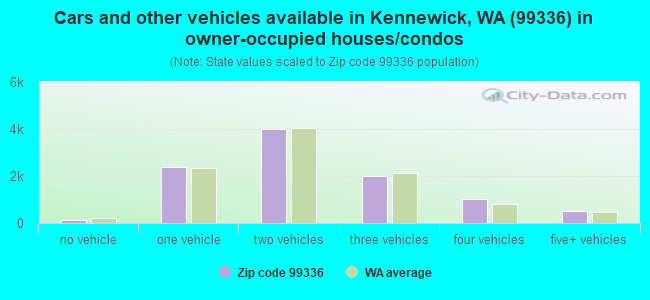
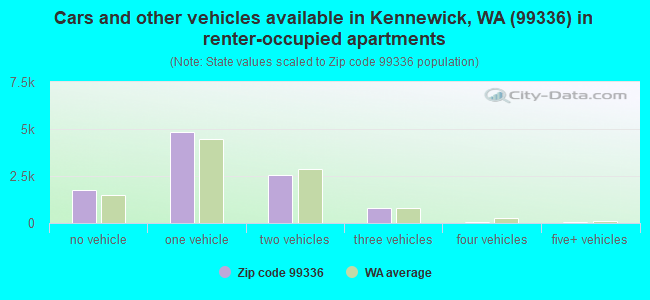
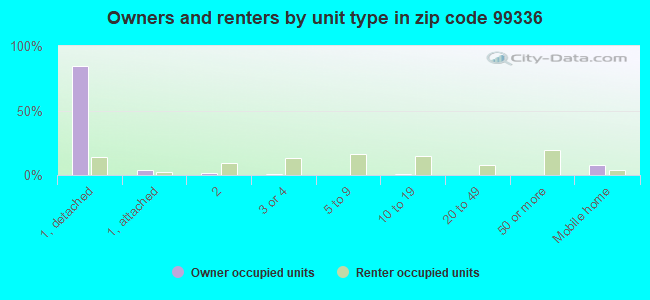
Houses and condos: 21,580 Renter-occupied apartments: 9,991
% of renters here:
50%
State:
36%
March 2022 cost of living index in zip code 99336: 95.7 (near average, U.S. average is 100)
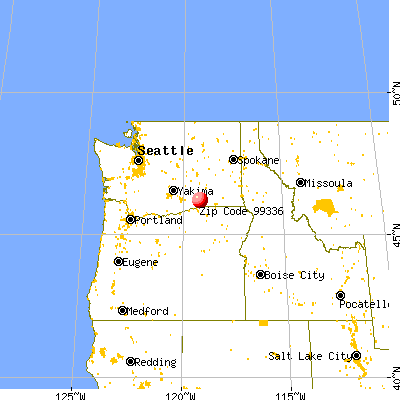
Land area: 13.3 sq. mi. Water area: 1.4 sq. mi.
Population density: 3,894 people per square mile
(average).
OSM Map
General Map
Google Map
MSN Map
OSM Map
General Map
Google Map
MSN Map
OSM Map
General Map
Google Map
MSN Map
OSM Map
General Map
Google Map
MSN Map
Please wait while loading the map...
Real estate property taxes paid for housing units in 2022:
This zip code:
0.7% ($2,340)
Washington:
0.8% ($4,283)
Median real estate property taxes paid for housing units with mortgages in 2022: $2,401 (0.7%) Median real estate property taxes paid for housing units with no mortgage in 2022: $2,176 (0.8%)
Averages for the 2020 tax year for zip code 99336, filed in 2021:
Average Adjusted Gross Income (AGI) in 2020: $53,721 (Individual Income Tax Returns)
Here:
$53,721
State:
$99,264
Salary/wage: $45,586 (reported on 84.9% of returns)
Here:
$45,586
State:
$80,347
(% of AGI for various income ranges: 1239.2% for AGIs below $25k, 3479.0% for AGIs $25k-50k, 6195.2% for AGIs $50k-75k, 9363.7% for AGIs $75k-100k, 16806.6% for AGIs $100k-200k, 68994.0% for AGIs over 200k)
Taxable interest for individuals: $1,160 (reported on 21.6% of returns)
This zip code:
$1,160
Washington:
$2,077
(% of AGI for various income ranges: 10.5% for AGIs below $25k, 9.0% for AGIs $25k-50k, 26.0% for AGIs $50k-75k, 53.1% for AGIs $75k-100k, 130.0% for AGIs $100k-200k, 1328.0% for AGIs over 200k)
Ordinary dividends: $5,693 (reported on 9.8% of returns)
Here:
$5,693
State:
$10,013
(% of AGI for various income ranges: 12.1% for AGIs below $25k, 12.4% for AGIs $25k-50k, 40.5% for AGIs $50k-75k, 81.0% for AGIs $75k-100k, 195.0% for AGIs $100k-200k, 6348.0% for AGIs over 200k)
Net capital gain/loss in AGI: +$21,255 (reported on 9.9% of returns)
Here:
+$21,255
State:
+$40,092
(% of AGI for various income ranges: 5.7% for AGIs below $25k, 14.6% for AGIs $25k-50k, 61.3% for AGIs $50k-75k, 141.4% for AGIs $75k-100k, 570.0% for AGIs $100k-200k, 34839.0% for AGIs over 200k)
Profit/loss from business: +$11,903 (reported on 9.7% of returns)
Here:
+$11,903
State:
+$18,312
(% of AGI for various income ranges: 71.1% for AGIs below $25k, 67.4% for AGIs $25k-50k, 155.3% for AGIs $50k-75k, 214.7% for AGIs $75k-100k, 514.0% for AGIs $100k-200k, 3985.0% for AGIs over 200k)
Taxable individual retirement arrangement distribution: $18,842 (reported on 6.7% of returns)
99336:
$18,842
Washington:
$24,221
(% of AGI for various income ranges: 35.6% for AGIs below $25k, 51.4% for AGIs $25k-50k, 160.0% for AGIs $50k-75k, 327.4% for AGIs $75k-100k, 806.5% for AGIs $100k-200k, 3536.0% for AGIs over 200k)
Self-employed (Keogh) retirement plans: $21,600 (reported on 0.1% of returns)
99336:
$21,600
Washington:
$24,166
(% of AGI for various income ranges: 47.6% for AGIs $100k-200k)
Total itemized deductions: $34,000 (reported on 4.0% of returns)
Here:
$34,000
State:
$39,068
(% of AGI for various income ranges: 25.7% for AGIs below $25k, 58.9% for AGIs $25k-50k, 146.1% for AGIs $50k-75k, 293.2% for AGIs $75k-100k, 629.5% for AGIs $100k-200k, 9370.0% for AGIs over 200k)
Charity contributions: $11,347 (reported on 2.9% of returns)
Here:
$11,347
State:
$15,331
(% of AGI for various income ranges: 1.6% for AGIs below $25k, 5.4% for AGIs $25k-50k, 20.8% for AGIs $50k-75k, 55.7% for AGIs $75k-100k, 196.2% for AGIs $100k-200k, 3070.0% for AGIs over 200k)
Taxes paid: $5,498 (reported on 3.8% of returns)
99336:
$5,498
State:
$7,774
(% of AGI for various income ranges: 2.3% for AGIs below $25k, 7.4% for AGIs $25k-50k, 23.9% for AGIs $50k-75k, 54.7% for AGIs $75k-100k, 125.4% for AGIs $100k-200k, 1101.0% for AGIs over 200k)
Earned income credit: $2,355 (reported on 19.2% of returns)
Here:
$2,355
State:
$2,020
(% of AGI for various income ranges: 97.5% for AGIs below $25k, 77.0% for AGIs $25k-50k, 2.0% for AGIs $50k-75k)
Percentage of individuals using paid preparers for their 2020 taxes: 93.9%
Here:
94%
State:
93%
(% for various income ranges: 92.4% for AGIs below $25k, 94.8% for AGIs $25k-50k, 94.5% for AGIs $50k-75k, 94.5% for AGIs $75k-100k, 94.4% for AGIs $100k-200k, 95.2% for AGIs over 200k)
Averages for the 2012 tax year for zip code 99336, filed in 2013:
Average Adjusted Gross Income (AGI) in 2012: $44,266 (Individual Income Tax Returns)
Here:
$44,266
State:
$69,533
Salary/wage: $38,898 (reported on 86.8% of returns)
Here:
$38,898
State:
$57,267
(% of AGI for various income ranges: 81.8% for AGIs below $25k, 82.4% for AGIs $25k-50k, 78.9% for AGIs $50k-75k, 78.1% for AGIs $75k-100k, 77.0% for AGIs $100k-200k, 43.9% for AGIs over 200k)
Taxable interest for individuals: $1,225 (reported on 24.7% of returns)
This zip code:
$1,225
Washington:
$1,816
(% of AGI for various income ranges: 0.7% for AGIs below $25k, 0.4% for AGIs $25k-50k, 0.6% for AGIs $50k-75k, 0.5% for AGIs $75k-100k, 0.8% for AGIs $100k-200k, 1.4% for AGIs over 200k)
Ordinary dividends: $6,455 (reported on 10.9% of returns)
Here:
$6,455
State:
$8,163
(% of AGI for various income ranges: 1.0% for AGIs below $25k, 0.6% for AGIs $25k-50k, 0.7% for AGIs $50k-75k, 0.8% for AGIs $75k-100k, 0.9% for AGIs $100k-200k, 9.2% for AGIs over 200k)
Net capital gain/loss in AGI: +$8,096 (reported on 9.0% of returns)
Here:
+$8,096
State:
+$21,568
(% of AGI for various income ranges: 0.2% for AGIs $25k-50k, 0.4% for AGIs $50k-75k, 0.5% for AGIs $75k-100k, 1.3% for AGIs $100k-200k, 12.6% for AGIs over 200k)
Profit/loss from business: +$10,911 (reported on 9.5% of returns)
Here:
+$10,911
State:
+$16,521
(% of AGI for various income ranges: 3.6% for AGIs below $25k, 1.8% for AGIs $25k-50k, 1.9% for AGIs $50k-75k, 2.1% for AGIs $75k-100k, 2.1% for AGIs $100k-200k, 3.6% for AGIs over 200k)
Taxable individual retirement arrangement distribution: $14,673 (reported on 7.9% of returns)
99336:
$14,673
Washington:
$18,648
(% of AGI for various income ranges: 1.7% for AGIs below $25k, 1.9% for AGIs $25k-50k, 2.5% for AGIs $50k-75k, 3.3% for AGIs $75k-100k, 3.6% for AGIs $100k-200k, 2.5% for AGIs over 200k)
Self-employment retirement plans: $25,950 (reported on 0.2% of returns)
99336:
$25,950
Washington:
$20,087
Total itemized deductions: $18,636 (22% of AGI, reported on 20.2% of returns)
Here:
$18,636
State:
$23,872
Here:
21.6% of AGI
State:
18.2% of AGI
(% of AGI for various income ranges: 4.8% for AGIs below $25k, 6.8% for AGIs $25k-50k, 9.6% for AGIs $50k-75k, 10.5% for AGIs $75k-100k, 10.5% for AGIs $100k-200k, 7.4% for AGIs over 200k)
Charity contributions: $4,423 (reported on 15.2% of returns)
Here:
$4,423
State:
$4,465
(% of AGI for various income ranges: 0.4% for AGIs below $25k, 0.9% for AGIs $25k-50k, 1.4% for AGIs $50k-75k, 1.8% for AGIs $75k-100k, 2.4% for AGIs $100k-200k, 2.2% for AGIs over 200k)
Taxes paid: $4,130 (reported on 19.7% of returns)
99336:
$4,130
State:
$6,400
(% of AGI for various income ranges: 0.9% for AGIs below $25k, 1.2% for AGIs $25k-50k, 2.0% for AGIs $50k-75k, 2.2% for AGIs $75k-100k, 2.6% for AGIs $100k-200k, 2.0% for AGIs over 200k)
Earned income credit: $2,449 (reported on 23.1% of returns)
Here:
$2,449
State:
$2,073
(% of AGI for various income ranges: 7.4% for AGIs below $25k, 1.4% for AGIs $25k-50k)
Percentage of individuals using paid preparers for their 2012 taxes: 47.8%
Here:
48%
State:
43%
(% for various income ranges: 46.7% for AGIs below $25k, 47.3% for AGIs $25k-50k, 48.3% for AGIs $50k-75k, 48.4% for AGIs $75k-100k, 51.9% for AGIs $100k-200k, 68.2% for AGIs over 200k)
Averages for the 2004 tax year for zip code 99336, filed in 2005:
Average Adjusted Gross Income (AGI) in 2004: $37,945 (Individual Income Tax Returns)
Here:
$37,945
State:
$54,331
Salary/wage: $35,169 (reported on 87.2% of returns)
Here:
$35,169
State:
$45,761
(% of AGI for various income ranges: 124.8% for AGIs below $10k, 81.0% for AGIs $10k-25k, 83.2% for AGIs $25k-50k, 83.6% for AGIs $50k-75k, 85.2% for AGIs $75k-100k, 68.3% for AGIs over 100k)
Taxable interest for individuals: $1,307 (reported on 39.6% of returns)
This zip code:
$1,307
Washington:
$2,110
(% of AGI for various income ranges: 4.3% for AGIs below $10k, 1.5% for AGIs $10k-25k, 1.2% for AGIs $25k-50k, 1.0% for AGIs $50k-75k, 0.9% for AGIs $75k-100k, 1.9% for AGIs over 100k)
Taxable dividends: $2,030 (reported on 15.7% of returns)
Here:
$2,030
State:
$5,879
(% of AGI for various income ranges: 3.1% for AGIs below $10k, 0.8% for AGIs $10k-25k, 0.7% for AGIs $25k-50k, 0.6% for AGIs $50k-75k, 0.7% for AGIs $75k-100k, 1.1% for AGIs over 100k)
Net capital gain/loss: +$6,154 (reported on 12.9% of returns)
Here:
+$6,154
State:
+$15,835
(% of AGI for various income ranges: -1.2% for AGIs below $10k, 0.1% for AGIs $10k-25k, 0.4% for AGIs $25k-50k, 0.7% for AGIs $50k-75k, 0.9% for AGIs $75k-100k, 7.8% for AGIs over 100k)
Profit/loss from business: +$10,199 (reported on 10.3% of returns)
Here:
+$10,199
State:
+$13,994
(% of AGI for various income ranges: 3.3% for AGIs below $10k, 3.2% for AGIs $10k-25k, 2.3% for AGIs $25k-50k, 1.7% for AGIs $50k-75k, 1.8% for AGIs $75k-100k, 4.7% for AGIs over 100k)
IRA payment deduction: $3,052 (reported on 1.8% of returns)
99336:
$3,052
Washington:
$3,001
(% of AGI for various income ranges: 0.1% for AGIs $10k-25k, 0.2% for AGIs $25k-50k, 0.2% for AGIs $50k-75k, 0.1% for AGIs $75k-100k, 0.1% for AGIs over 100k)
Self-employed pension: $12,780 (reported on 0.3% of returns)
Here:
$12,780
Washington:
$14,244
Total itemized deductions: $15,419 (22% of AGI, reported on 24.0% of returns)
Here:
$15,419
State:
$19,669
Here:
22.4% of AGI
State:
20.7% of AGI
(% of AGI for various income ranges: 9.1% for AGIs below $10k, 5.8% for AGIs $10k-25k, 8.3% for AGIs $25k-50k, 11.0% for AGIs $50k-75k, 12.5% for AGIs $75k-100k, 10.5% for AGIs over 100k)
Charity contributions deductions: $3,390 (5% of AGI, reported on 20.3% of returns)
Here:
$3,390
State:
$3,569
Here:
4.7% of AGI
State:
3.5% of AGI
(% of AGI for various income ranges: 0.4% for AGIs below $10k, 0.8% for AGIs $10k-25k, 1.1% for AGIs $25k-50k, 1.7% for AGIs $50k-75k, 2.3% for AGIs $75k-100k, 3.1% for AGIs over 100k)
Total tax: $5,179 (reported on 70.6% of returns)
99336:
$5,179
State:
$9,065
(% of AGI for various income ranges: 2.5% for AGIs below $10k, 3.5% for AGIs $10k-25k, 6.5% for AGIs $25k-50k, 9.2% for AGIs $50k-75k, 10.8% for AGIs $75k-100k, 16.9% for AGIs over 100k)
Earned income credit: $1,787 (reported on 19.5% of returns)
Here:
$1,787
State:
$1,607
Percentage of individuals using paid preparers for their 2004 taxes: 52.1%
Here:
52%
State:
49%
(% for various income ranges: 46.7% for AGIs below $10k, 55.7% for AGIs $10k-25k, 52.8% for AGIs $25k-50k, 50.8% for AGIs $50k-75k, 48.9% for AGIs $75k-100k, 55.2% for AGIs over 100k)
Likely homosexual households (counted as self-reported same-sex unmarried-partner households)
Lesbian couples: 0.1% of all households
Gay men: 0.0% of all households
Household received Food Stamps/SNAP in the past 12 months: 4,212 Household did not receive Food Stamps/SNAP in the past 12 months: 15,867
Women who had a birth in the past 12 months: 556 (344 now married, 200 unmarried) Women who did not have a birth in the past 12 months: 12,018 (4,113 now married, 7,942 unmarried)
Housing units in zip code 99336 with a mortgage: 6,327 (434 second mortgage, 396 both second mortgage and home equity loan) Houses without a mortgage: 55
Median monthly owner costs for units with a mortgage: $1,433 Median monthly owner costs for units without a mortgage: $555
Residents with income below the poverty level in 2022:
This zip code:
17.9%
Whole state:
10.0%
Residents with income below 50% of the poverty level in 2022:
This zip code:
9.6%
Whole state:
4.6%
Median number of rooms in houses and condos:
Here:
6.3
State:
6.5
Median number of rooms in apartments:
Here:
3.8
State:
3.9
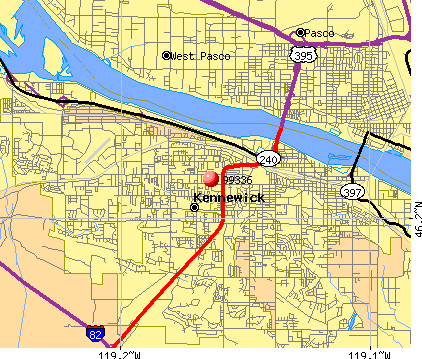
Notable locations in this zip code not listed on our city pages
Notable locations in zip code 99336: Columbia Park Golf Course (A), The Highlands Center (B), Tri-Cities Center (C), Midtown Plaza (D), Kennewick Plaza (E), Tri-City Golf Course (F), Columbia Square (G), Benton County Fire District 1 Station 130 (H), Tri Cities Vocational Center (I), Kennewick Fire Department Station 2 (J), Kennewick Fire Department Station 3 (K), Kennewick Fire Department Station 1 (L). Display/hide their locations on the map
Parks in zip code 99336 include: Fruitland Park (1), Layton Park (2), Keewaydin Park (3), Lawrence Scott Park (4), John Day Park (5), Hatfield Park (6), Underwood Park (7), Sanders Field (8). Display/hide their locations on the map
6,751 married couples with children.
5,490 single-parent households (1,367 men, 4,123 women).
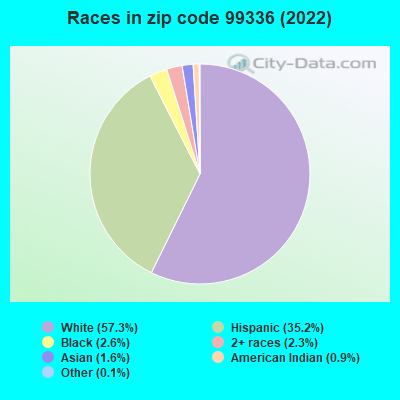
68.2% of residents of 99336 zip code speak English at home.
28.3% of residents speak Spanish at home (57% very well, 20% well, 15% not well, 8% not at all).
1.5% of residents speak other Indo-European language at home (75% very well, 11% well, 14% not well).
0.8% of residents speak Asian or Pacific Island language at home (31% very well, 37% well, 23% not well, 9% not at all).
1.4% of residents speak other language at home (44% very well, 35% well, 21% not well).
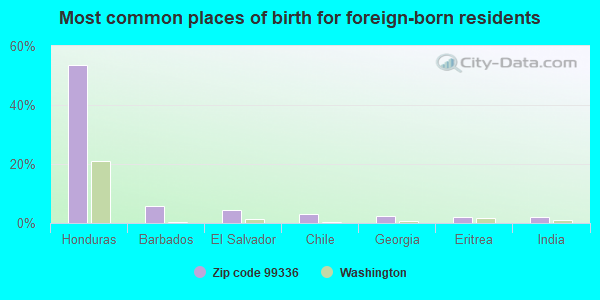
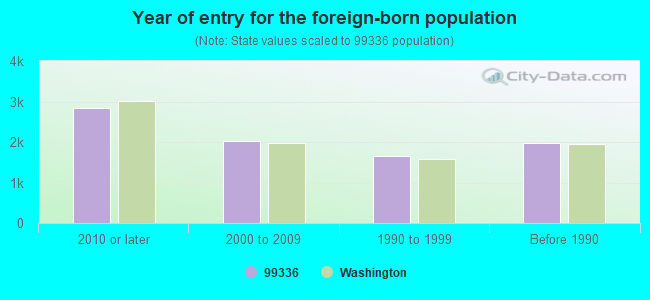
Foreign born population: 7,966 (15.3%) (33.4% of them are naturalized citizens)
Major facilities with environmental interests located in this zip code:
AGRIUM US (227108 EAST HEDGES ROAD in KENNEWICK, WA)
National Pollutant Discharge Elimination System NON-MAJOR (Tracking pollutant discharge elimination systems) - permit (Resource Conservation and Recovery Act (tracking hazardous waste)) TRI REPORTER (Tracking of toxic chemicals releasing facilities) STATE MASTER (Washington State Department of Ecology's Facility/Site identification system) - HAZWASTE-WAD988483723, HAZARDOUS WASTE PROGRAM, EPCRA, TRI REPORTER Business SIC classification: NITROGENOUS FERTILIZERS; PESTICIDES AND AGRICULTURAL CHEMICALS; SPECIAL WAREHOUSING AND STORAGE; CHEMICALS AND ALLIED PRODUCTS; FARM SUPPLIES Organizations: AGRIUM US INC - KFO (CONTACT/OPERATOR)
, UNION OIL CO OF CALIFORNIA (CONTACT/OPERATOR)
, AGRIUM US INC (CONTACT/OWNER)
Alternative names: AGRIUM KENNEWICK FERTILIZER OPS. HEDGES AREA, AGRIUM U.S. INC, AGRIUM U.S. INC. KFO HEDGES, AGRIUM US INC KFO HEDGES RD, AGRIUM US INC KFO HEDGES RD, PRODICA LLC HEDGES RD, UNOCAL AGRICULTURAL PRODS.
BUILDERS LUMBER MILLWORK (3919 W CLEARWATER AVE in KENNEWICK, WA)
(Resource Conservation and Recovery Act (tracking hazardous waste)) STATE MASTER (Washington State Department of Ecology's Facility/Site identification system) - AIRQUAL-J 005 0051, AIR MINOR Business SIC classification: MILLWORK; NONCLASSIFIABLE ESTABLISHMENTS Alternative names: LUMBERMENS BUILDING CENTER, LUMBERMENS BUILDING CENTER KENNEWICK
APEX ENVIRONMENTAL INCORPORATED (403 N DAYTON in KENNEWICK, WA)
(Resource Conservation and Recovery Act (tracking hazardous waste)) USED OIL PROGRAM (Resource Conservation and Recovery Act (tracking hazardous waste)) STATE MASTER (Washington State Department of Ecology's Facility/Site identification system) - HAZWASTE-WAH000011577, HAZARDOUS WASTE PROGRAM, TRANSPORTER Business SIC classification: SCRAP AND WASTE MATERIALS Business NAICS classification: PETROLEUM LUBRICATING OIL AND GREASE MANUFACTURING. Organizations: OIL RE REFINING COMPANY INC (CONTACT/OPERATOR)
Alternative names: APEX ENVIRONMENTAL INC KENNEWICK, APEX ENVIRONMENTAL INC KENNEWICK, OIL RE REFINING COMPANY INC, OIL RE REFINING COMPANY INC KENNEWICK, OIL RE REFINING COMPANY INC KENNEWICK
10TH AVENUE CLEANERS (3001 W 10TH STE C in KENNEWICK, WA)
(Resource Conservation and Recovery Act (tracking hazardous waste)) STATE MASTER (Washington State Department of Ecology's Facility/Site identification system) - HAZWASTE-WAH000001750, CESQG Organizations: JUNG CHA (CONTACT/OPERATOR)
AMERICAN ROCK PRODUCTS HOSPITA (2 MILES S OF KENNEWICK in KENNEWICK, WA)
National Pollutant Discharge Elimination System NON-MAJOR (Tracking pollutant discharge elimination systems) - permit STATE MASTER (Washington State Department of Ecology's Facility/Site identification system) - WATQUAL-WAG505066, National Pollutant Discharge Elimination System Permit Business SIC classification: CRUSHED AND BROKEN STONE Alternative names: AMERICAN ROCK PRODUCTS HOSPITAL, DEATLEY CRUSHING -, DEATLEY CRUSHING - HOSPITAL PI, DEATLEY CRUSHING HOSPTIAL PIT (EUCON)
APPLE VALLEY BROADCASTING INC KVEW TV (JUMP OFF JOE BUTTE in KENNEWICK, WA)
(Resource Conservation and Recovery Act (tracking hazardous waste)) STATE MASTER (Washington State Department of Ecology's Facility/Site identification system) - HAZWASTE-WAD981761919, HAZARDOUS WASTE PROGRAM Business SIC classification: TELEVISION BROADCASTING STATIONS Organizations: H BLUE (CONTACT/OPERATOR)
CHARLIES AUTOMOTIVE (421 E COLUMBIA DR S END OF BLD in KENNEWICK, WA)
(Resource Conservation and Recovery Act (tracking hazardous waste)) STATE MASTER (Washington State Department of Ecology's Facility/Site identification system) - HAZWASTE-WAD988504874, CESQG Business SIC classification: AUTOMOTIVE EXHAUST SYSTEM REPAIR SHOPS; AUTOMOTIVE REPAIR SHOPS; AUTOMOTIVE SERVICES, EXCEPT REPAIR AND CARWASHES Business NAICS classification: AUTOMOTIVE EXHAUST SYSTEM REPAIR.; AUTOMOTIVE EXHAUST SYSTEM REPAIR. Organizations: CHARLES MITCHELL (CONTACT/OPERATOR)
COLUMBIA PACIFIC TRANSPORT (607 E COLUMBIA DR in KENNEWICK, WA)
(Resource Conservation and Recovery Act (tracking hazardous waste)) STATE MASTER (Washington State Department of Ecology's Facility/Site identification system) - HAZWASTE-WAD003897139, HAZARDOUS WASTE PROGRAM Business SIC classification: TRUCKING, EXCEPT LOCAL Business NAICS classification: GENERAL FREIGHT TRUCKING, LONG-DISTANCE, TRUCKLOAD.; GENERAL FREIGHT TRUCKING, LONG-DISTANCE, TRUCKLOAD. Organizations: HERB COULTER (CONTACT/OPERATOR)
BUDGET PRINTING (4207 CLEARWATER AVENUE in KENNEWICK, WA)
Conditionally Exempt Small Quantity Generators, less than 100 kg/month of hazardous waste (Resource Conservation and Recovery Act (tracking hazardous waste)) - notification STATE MASTER (Washington State Department of Ecology's Facility/Site identification system) - HAZWASTE-WAR000003475, CESQG Business SIC classification: COMMERCIAL PRINTING, LITHOGRAPHIC Business NAICS classification: QUICK PRINTING.; QUICK PRINTING. Organizations: DAVID ASHBY (CONTACT/OPERATOR)
, BUDGET PRINT CENTER INC (CONTACT/OWNER)
CLEARWATER COLLISION & TOWING LLC (4023 W CLEARWATER AVE in KENNEWICK, WA)
Conditionally Exempt Small Quantity Generators, less than 100 kg/month of hazardous waste (Resource Conservation and Recovery Act (tracking hazardous waste)) - notification STATE MASTER (Washington State Department of Ecology's Facility/Site identification system) - HAZWASTE-WA0000940288, CESQG Business SIC classification: TOP, BODY, AND UPHOLSTERY REPAIR SHOPS AND PAINT SHOPS Business NAICS classification: AUTOMOTIVE BODY, PAINT, AND INTERIOR REPAIR AND MAINTENANCE.; AUTOMOTIVE BODY, PAINT, AND INTERIOR REPAIR AND MAINTENANCE. Organizations: TIMOTHY DEAN (CONTACT/OPERATOR)
, CLEARWATER COLLISION AND TOWING LLC (CONTACT/OWNER)
AMISTAD ELEMENTARY SCHOOL (930 W 4TH AVE in KENNEWICK, WA)
(National Center for Education Statistics) - STATE ID-4418 Organizations: KENNEWICK SCH DIST 17 (SCHOOL DISTRICT)
BENTON/FRANKLIN JUV JUSTICE CNTR (5606 W CANAL DR in KENNEWICK, WA)
(National Center for Education Statistics) - STATE ID-4007 Organizations: KENNEWICK SCH DIST 17 (SCHOOL DISTRICT)
BON MARCHE KENNEWICK (400 COLUMBIA CTR in KENNEWICK, WA)
Conditionally Exempt Small Quantity Generators, less than 100 kg/month of hazardous waste (Resource Conservation and Recovery Act (tracking hazardous waste)) - notification Organizations: DOUG CHANTRY (CONTACT/OPERATOR)
, THE BON INC (CONTACT/OWNER)
Housing units lacking complete plumbing facilities: 0.9% Housing units lacking complete kitchen facilities: 2.8%
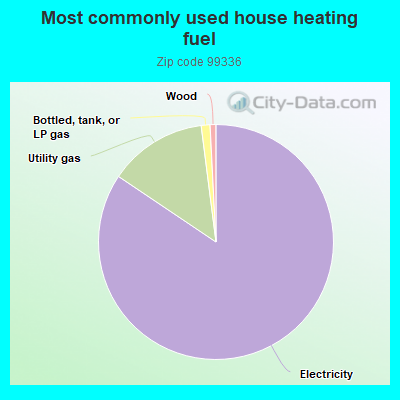
84.0%Electricity
13.5%Utility gas
1.2%Bottled, tank, or LP gas
0.8%Wood
Population in 1990: 33,860. Population change in the 1990s: +6,960 (+20.6%).
Place of birth for U.S.-born residents:
This state: 26,582
Northeast: 1,183
Midwest: 2,994
South: 2,998
West: 9,666
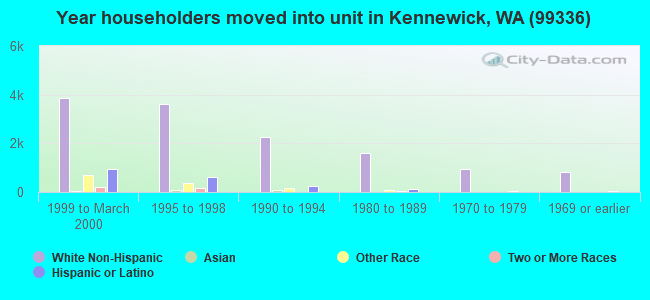
44% of the 99336 zip code residents lived in the same house 5 years ago. Out of people who lived in different houses, 51% lived in this county. Out of people who lived in different counties, 50% lived in Washington.
89% of the 99336 zip code residents lived in the same house 1 year ago. Out of people who lived in different houses, 46% moved from this county. Out of people who lived in different houses, 30% moved from different county within same state. Out of people who lived in different houses, 19% moved from different state. Out of people who lived in different houses, 6% moved from abroad.
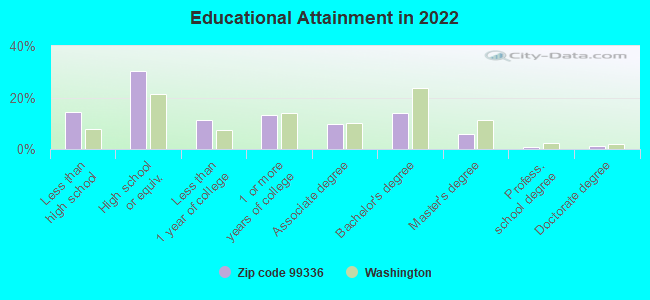
Private vs. public school enrollment:
Students in private schools in grades 1 to 8 (elementary and middle school): 526
Here:
8.9%
Washington:
12.4%
Students in private schools in grades 9 to 12 (high school): 242
Here:
8.8%
Washington:
9.2%
Students in private undergraduate colleges: 237
Here:
13.8%
Washington:
16.5%
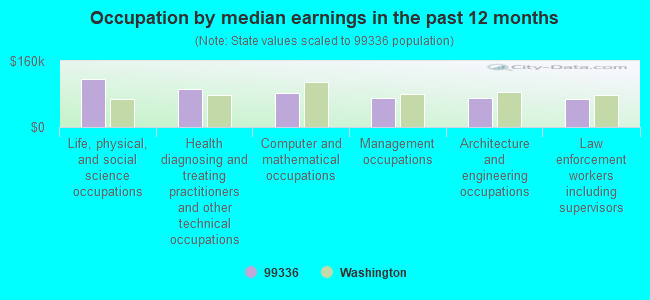
Occupation by median earnings in the past 12 months ($)
116,321Life, physical, and social science occupations
91,680Health diagnosing and treating practitioners and other technical occupations
81,688Computer and mathematical occupations
69,632Management occupations
69,468Architecture and engineering occupations
66,971Law enforcement workers including supervisors
Companies with biggest federal contracts located in this zip code (KENNEWICK, WA):
MESOSYSTEMS TECHNOLOGY, INC (415 N QUAY; small business) : $20,758,799 in 93 contractsfrom 1999 to 2006
Contracts for Other Defense -- Applied Research and Exploratory Development (R&D), Other Research and Development -- Basic Research (R&D), Other Defense -- Advanced Development (R&D), Water Purification Equipment, and moreby Department of Defense, Army, Office of Policy, Management and Budget/Chief Financial Officer, Defense Advanced Research Projects Agency, and others Signed by year:2000: $5,083,122; 2001: $2,223,184; 2002: $3,228,339; 2003: $2,728,266; 2004: $4,430,446; 2005: $1,473,875; 2006: $697,699.
Biggest contracts:
$2,384,165 with Department of Defense for Other Defense -- Applied Research and Exploratory Development (R&D). Taking place in NM. Signed on 2004-10-14. Completion date: 2006-09-29.
$2,252,860 with Army for Other Research and Development -- Basic Research (R&D). Signed on 2000-03-06. Completion date: 2001-07-31.
$1,815,401, same as above.Signed on 2000-10-25. Completion date: 2001-09-01.
$1,121,000 with Office of Policy, Management and Budget/Chief Financial Officer for Other Research and Development -- Basic Research (R&D). Signed on 2001-03-15. Completion date: 2001-09-15.
STAVELEY INSTRUMENTS INC (421 N QUAY ST; small business) : $10,972,857 in 128 contractsfrom 1999 to 2006
Contracts for Physical Properties Testing and Inspection, Aircraft Maintenance and Repair Shop Specialized Equipment, Electrical and Electronic Properties Measuring and Testing Instruments, Aircraft Ground Servicing Equipment, and moreby Air Force, U.S. Coast Guard, Army, Defense Logistics Agency, and others Signed by year:2000: $3,928,584; 2001: $653,056; 2002: $237,189; 2003: $1,171,133; 2004: $701,987; 2005: $3,462,313; 2006: $765,945.
Biggest contracts:
$3,210,784 with Air Force for Physical Properties Testing and Inspection. Signed on 2000-08-04. Completion date: 2000-12-31.
$1,698,619, same as above.Signed on 2005-06-01. Completion date: 2005-09-30.
$611,483, same as above.Signed on 2005-07-26. Completion date: 2005-10-31.
$596,595, same as above.Signed on 2006-06-30. Completion date: 2006-10-31.
INFINIA CORPORATION (6811 WEST OKANOGAN PLACE; small business) : $8,485,441 in 33 contractsfrom 1999 to 2006
Contracts for Aeronautics and Space Technology -- Engineering Development (R&D), Other Defense -- Applied Research and Exploratory Development (R&D), Services -- Basic Research (R&D), Engineering and Technical Services, and moreby ENERGY, Department of, Army, NASA, Air Force, and others Signed by year:2000: $2,763,572; 2001: $2,645,897; 2002: $1,099,132; 2003: $449,841; 2004: $418,982; 2005: $767,840; 2006: $160,177.
Biggest contracts:
$1,111,000 with ENERGY, Department of for Aeronautics and Space Technology -- Engineering Development (R&D). Signed on 2001-09-15. Completion date: 2002-01-15.
$1,000,000, same as above.Signed on 2002-03-15. Completion date: 2002-09-15.
$947,000, same as above.Signed on 2001-05-15. Completion date: 2002-01-15.
$599,000, same as above.Signed on 2000-12-15. Completion date: 2002-01-15.
NEIL F LAMPSON INC (607 E COLUMBIA DR; small business) : $5,986,293 in 17 contractsfrom 2000 to 2003
Contracts for Motor Freight by Navy Signed by year:2000: $1,098,201; 2001: $1,422,829; 2002: $2,593,978; 2003: $871,285; 2004: $0; 2005: $0; 2006: $0.
Biggest contracts:
$655,187 with Navy for Motor Freight. Signed on 2000-12-11. Completion date: 2000-12-31.
$590,548, same as above.Signed on 2002-05-22. Completion date: 2002-10-25.
$504,118, same as above.Signed on 2002-06-12. Completion date: 2002-11-01.
$501,415, same as above.Signed on 2001-12-19. Completion date: 2002-05-01.
LAMPSON INTERNATIONAL LTD. (607 E. COLUMBIA DRIVE) : $5,709,010 in 10 contractsfrom 1999 to 2000
Contracts for Hazardous Substance Removal, Cleanup, and Disposal Services and Operational Support by Navy Signed by year:2000: $1,130,461; 2001: $0; 2002: $0; 2003: $0; 2004: $0; 2005: $0; 2006: $0.
Biggest contracts:
$3,300,502 with Navy for Hazardous Substance Removal, Cleanup, and Disposal Services and Operational Support. Signed on 1999-11-01. Completion date: 2000-12-11.
$448,865, same as above.Signed on 1999-12-16. Completion date: 1999-12-31.
$277,194, same as above.Signed on 1999-12-16. Completion date: 1999-12-31.
$276,102, same as above.Signed on 2000-06-22. Completion date: 2000-11-15.
LAMPSON INTERNATIONAL LLC (607 E COLUMBIA DRIVE; small business) : $1,675,244 in 11 contractsfrom 2004 to 2005
Contracts for Air Freight, Motor Freight, Technical Representation Services -- Special Industry Machinery by Navy Signed by year:2000: $0; 2001: $0; 2002: $0; 2003: $0; 2004: $1,154,696; 2005: $520,548; 2006: $0.
Biggest contracts:
$470,522 with Navy for Air Freight. Signed on 2005-07-19. Completion date: 2004-12-31.
$430,220, same as above.Signed on 2004-06-29. Completion date: 2004-11-18.
$326,649 with Navy for Motor Freight. Signed on 2004-06-29. Completion date: 2004-11-24.
$326,649 with Navy for Air Freight. Signed on 2004-06-29. Completion date: 2004-11-24.
APOLLO, INC (1201 W COLUMBIA DRIVE; small business) : $1,211,316 in 35 contractsfrom 2000 to 2005
Contracts for Construction of Structures and Facilities -- Sewage and Waste Facilities, Maintenance, Repair or Alteration of Real Property -- Highways, Roads, Streets, Bridges, and Railways (includes resurfacing), Maintenance, Repair or Alteration of Real Property -- Other Non-Building Facilities by Public Health Service, Forest Service (disused code: now 12C2), Army, Indian Health Service, and others Signed by year:2000: $543,298; 2001: $150,311; 2002: $0; 2003: $368,886; 2004: $159,582; 2005: -$10,761; 2006: $0.
Biggest contracts:
$349,153 with Public Health Service for Construction of Structures and Facilities -- Sewage and Waste Facilities. Taking place in ID. Signed on 2003-08-15. Completion date: 2004-01-15.
$149,264, same as above.Signed on 2004-11-18. Completion date: 2004-11-18.
$103,000 with Forest Service (disused code: now 12C2) for Maintenance, Repair or Alteration of Real Property -- Highways, Roads, Streets, Bridges, and Railways (includes resurfacing). Taking place in OR. Signed on 2000-09-15. Completion date: 2001-12-15.
$97,216 with Army for Maintenance, Repair or Alteration of Real Property -- Other Non-Building Facilities. Taking place in ID. Signed on 2001-02-26. Completion date: 2001-09-30.
CADWELL LABORATORIES INC (909 N KELLOGG ST; small business) : $885,474 in 61 contractsfrom 1999 to 2006
Contracts for ADP Software, Medical and Surgical Instruments, Equipment, and Supplies, Hospital Furniture, Equipment, Utensils, and Supplies, X-Ray Equipment and Supplies: Medical, Dental, Veterinary, and moreby Department of Veterans Affairs, Navy, Army, Air Force, and others Signed by year:2000: $73,000; 2001: $112,378; 2002: $23,196; 2003: $126,962; 2004: $0; 2005: $196,885; 2006: $313,053.
Biggest contracts:
$73,000 with Department of Veterans Affairs for ADP Software. Signed on 2000-09-15. Completion date: 2000-09-15.
$64,665 with Department of Veterans Affairs for Medical and Surgical Instruments, Equipment, and Supplies. Taking place in TX. Signed on 2006-09-27. Completion date: 2006-11-01.
$59,000 with Department of Veterans Affairs for Hospital Furniture, Equipment, Utensils, and Supplies. Signed on 2001-05-15. Completion date: 2001-06-15.
$56,247 with Navy for Medical and Surgical Instruments, Equipment, and Supplies. Taking place in VA. Signed on 2005-03-07. Completion date: 2005-03-15.
VISTA LEAK DETECTION INC (8203 W QUINAULT AVE BLDG C; small business) : $676,630 in 3 contractsin 2006
$364,795 with Navy for Maintenance, Repair and Rebuilding of Equipment -- Communication, Detection, and Coherent Radiation Equipment. Taking place in SC. Signed on 2006-02-10. Completion date: 2007-02-15.
$302,487 with Navy for Maintenance, Repair and Rebuilding of Equipment -- Communication, Detection, and Coherent Radiation Equipment. Taking place in FL. Signed on 2006-06-07. Completion date: 2007-04-15.
$9,348 with Navy for Maintenance, Repair and Rebuilding of Equipment -- Communication, Detection, and Coherent Radiation Equipment. Taking place in SC. Signed on 2006-05-18. Completion date: 2007-02-15.
H B SUPPLY COMPANY (800 E 1ST AVENUE; small business) : $669,334 in 18 contractsfrom 2003 to 2006
Contracts for Liquid and Gas Flow, Liquid Level, and Mechanical Motion Measuring Instruments, Valves, Powered, Valves, Nonpowered, Pressure, Temperature, and Humidity Measuring and Controlling Instruments, and moreby Army, U.S. Army Corps of Engineers - civil program financing only, Bureau of Reclamation Signed by year:2000: $0; 2001: $0; 2002: $0; 2003: $28,015; 2004: $530,420; 2005: $105,554; 2006: $5,345.
Biggest contracts:
$248,119 with Army for Liquid and Gas Flow, Liquid Level, and Mechanical Motion Measuring Instruments. Signed on 2004-09-30. Completion date: 2004-09-30.
$248,119 with U.S. Army Corps of Engineers - civil program financing only for Liquid and Gas Flow, Liquid Level, and Mechanical Motion Measuring Instruments. Signed on 2004-09-30. Completion date: 2004-09-30.
$49,739, same as above.Signed on 2005-09-17. Completion date: 2005-09-04.
$49,739 with Army for Liquid and Gas Flow, Liquid Level, and Mechanical Motion Measuring Instruments. Signed on 2005-09-17. Completion date: 2005-09-04.
Top industries in this zip code by the number of employees in 2005:
Health Care and Social Assistance: General Medical and Surgical Hospitals (500-999: 1)
Administrative and Support and Waste Management and Remediation Services: Professional Employer Organizations (500-999: 1)
Health Care and Social Assistance: Offices of Physicians (except Mental Health Specialists) (100-249: 1, 50-99: 1, 20-49: 4, 10-19: 6, 5-9: 15, 1-4: 17)
Administrative and Support and Waste Management and Remediation Services: Temporary Help Services (100-249: 2, 50-99: 3, 10-19: 2, 1-4: 1)
Administrative and Support and Waste Management and Remediation Services: Janitorial Services (250-499: 1, 50-99: 1, 20-49: 2, 10-19: 2, 5-9: 2, 1-4: 4)
Other Services (except Public Administration): Religious Organizations (100-249: 1, 50-99: 1, 20-49: 2, 10-19: 4, 5-9: 7, 1-4: 12)
People in group quarters in 2010:
663 people in local jails and other municipal confinement facilities
130 people in nursing facilities/skilled-nursing facilities
68 people in group homes intended for adults
31 people in correctional facilities intended for juveniles
30 people in residential treatment centers for adults
29 people in correctional residential facilities
7 people in in-patient hospice facilities
4 people in workers' group living quarters and job corps centers
People in group quarters in 2000:
243 people in local jails and other confinement facilities (including police lockups)
106 people in nursing homes
60 people in short-term care, detention or diagnostic centers for delinquent children
49 people in other noninstitutional group quarters
37 people in other group homes
21 people in halfway houses
5 people in religious group quarters
4 people in hospitals/wards and hospices for chronically ill
4 people in hospices or homes for chronically ill
Fatal accident statistics in 2014:
Fatal accident count: 3
Vehicles involved in fatal accidents: 3
Fatal accidents caused by drunken drivers: 2
Fatalities: 3
Persons involved in fatal accidents: 3
Pedestrians involved in fatal accidents: 2
Fatal accident statistics in 2013:
Fatal accident count: 1
Vehicles involved in fatal accidents: 2
Fatal accidents caused by drunken drivers: 0
Fatalities: 1
Persons involved in fatal accidents: 2
Pedestrians involved in fatal accidents: 0
Home Mortgage Disclosure Act Aggregated Statistics For Year 2009 (Based on 2 full and 16 partial tracts)
A) FHA, FSA/RHS & VA Home Purchase Loans
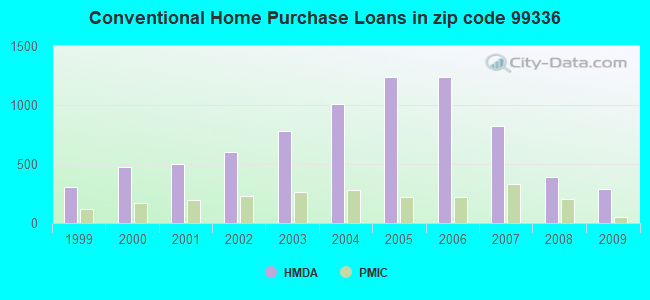
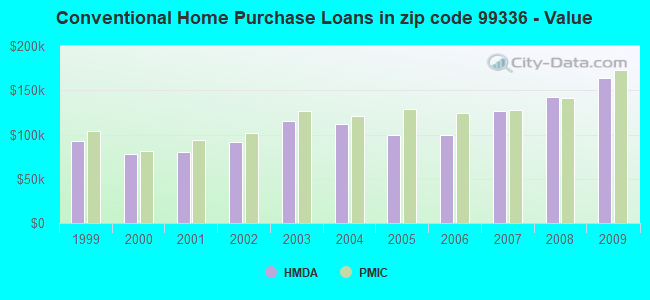
B) Conventional Home Purchase Loans
C) Refinancings
D) Home Improvement Loans
E) Loans on Dwellings For 5+ Families
F) Non-occupant Loans on < 5 Family Dwellings (A B C & D)
G) Loans On Manufactured Home Dwelling (A B C & D)
Number
Average Value
Number
Average Value
Number
Average Value
Number
Average Value
Number
Average Value
Number
Average Value
Number
Average Value
LOANS ORIGINATED
530
$138,311
288
$164,227
876
$139,191
67
$69,197
10
$2,761,459
74
$115,414
32
$106,524
APPLICATIONS APPROVED, NOT ACCEPTED
19
$122,447
24
$138,249
98
$146,640
8
$37,509
0
$0
9
$108,037
1
$67,760
APPLICATIONS DENIED
60
$139,666
29
$139,231
385
$127,733
50
$53,704
4
$266,895
33
$100,698
21
$95,536
APPLICATIONS WITHDRAWN
63
$122,237
56
$142,195
291
$139,527
26
$66,136
4
$418,100
28
$106,322
4
$104,610
FILES CLOSED FOR INCOMPLETENESS
5
$115,880
4
$122,688
59
$131,881
9
$53,688
0
$0
1
$145,100
0
$0
Aggregated Statistics For Year 2008 (Based on 2 full and 16 partial tracts)
A) FHA, FSA/RHS & VA Home Purchase Loans
B) Conventional Home Purchase Loans
C) Refinancings
D) Home Improvement Loans
E) Loans on Dwellings For 5+ Families
F) Non-occupant Loans on < 5 Family Dwellings (A B C & D)
G) Loans On Manufactured Home Dwelling (A B C & D)
Number
Average Value
Number
Average Value
Number
Average Value
Number
Average Value
Number
Average Value
Number
Average Value
Number
Average Value
LOANS ORIGINATED
306
$133,869
387
$142,230
534
$127,558
90
$55,151
8
$2,477,856
110
$101,046
45
$99,329
APPLICATIONS APPROVED, NOT ACCEPTED
26
$104,605
52
$118,915
86
$112,666
9
$56,411
0
$0
15
$102,273
12
$73,648
APPLICATIONS DENIED
41
$118,630
69
$118,121
605
$117,523
119
$65,903
2
$474,875
40
$97,062
21
$80,374
APPLICATIONS WITHDRAWN
29
$128,573
62
$145,503
197
$145,127
26
$67,254
2
$159,175
19
$129,059
1
$226,080
FILES CLOSED FOR INCOMPLETENESS
6
$105,385
15
$170,113
27
$140,715
18
$70,343
2
$2,997,900
4
$176,040
3
$145,113
Aggregated Statistics For Year 2007 (Based on 2 full and 16 partial tracts)
A) FHA, FSA/RHS & VA Home Purchase Loans
B) Conventional Home Purchase Loans
C) Refinancings
D) Home Improvement Loans
E) Loans on Dwellings For 5+ Families
F) Non-occupant Loans on < 5 Family Dwellings (A B C & D)
G) Loans On Manufactured Home Dwelling (A B C & D)
Number
Average Value
Number
Average Value
Number
Average Value
Number
Average Value
Number
Average Value
Number
Average Value
Number
Average Value
LOANS ORIGINATED
134
$130,790
823
$126,138
650
$106,658
138
$50,752
7
$968,729
155
$111,896
53
$89,424
APPLICATIONS APPROVED, NOT ACCEPTED
22
$119,466
121
$104,342
162
$111,064
26
$60,552
0
$0
40
$101,037
13
$56,668
APPLICATIONS DENIED
20
$141,510
151
$96,089
718
$116,495
180
$72,112
2
$223,040
73
$116,678
36
$71,764
APPLICATIONS WITHDRAWN
15
$126,587
96
$124,624
331
$125,460
41
$60,320
4
$1,826,222
37
$132,114
6
$94,665
FILES CLOSED FOR INCOMPLETENESS
4
$161,645
14
$144,232
59
$117,759
8
$37,786
0
$0
6
$130,560
0
$0
Aggregated Statistics For Year 2006 (Based on 2 full and 16 partial tracts)
A) FHA, FSA/RHS & VA Home Purchase Loans
B) Conventional Home Purchase Loans
C) Refinancings
D) Home Improvement Loans
E) Loans on Dwellings For 5+ Families
F) Non-occupant Loans on < 5 Family Dwellings (A B C & D)
G) Loans On Manufactured Home Dwelling (A B C & D)
Number
Average Value
Number
Average Value
Number
Average Value
Number
Average Value
Number
Average Value
Number
Average Value
Number
Average Value
LOANS ORIGINATED
166
$123,410
1,238
$99,522
647
$103,808
207
$34,508
15
$1,456,731
272
$104,577
53
$103,668
APPLICATIONS APPROVED, NOT ACCEPTED
5
$93,654
167
$91,839
140
$100,183
41
$37,358
0
$0
37
$101,785
10
$124,965
APPLICATIONS DENIED
20
$128,856
311
$92,224
725
$118,238
247
$57,835
2
$192,490
88
$98,289
58
$107,495
APPLICATIONS WITHDRAWN
26
$119,729
178
$107,927
497
$118,196
60
$70,695
0
$0
45
$126,218
14
$70,508
FILES CLOSED FOR INCOMPLETENESS
2
$135,915
28
$95,512
125
$114,389
7
$119,060
0
$0
8
$128,375
0
$0
Aggregated Statistics For Year 2005 (Based on 2 full and 16 partial tracts)
A) FHA, FSA/RHS & VA Home Purchase Loans
B) Conventional Home Purchase Loans
C) Refinancings
D) Home Improvement Loans
E) Loans on Dwellings For 5+ Families
F) Non-occupant Loans on < 5 Family Dwellings (A B C & D)
G) Loans On Manufactured Home Dwelling (A B C & D)
Number
Average Value
Number
Average Value
Number
Average Value
Number
Average Value
Number
Average Value
Number
Average Value
Number
Average Value
LOANS ORIGINATED
206
$121,516
1,239
$99,902
890
$104,671
197
$47,217
10
$1,613,795
261
$102,739
44
$91,308
APPLICATIONS APPROVED, NOT ACCEPTED
10
$107,414
147
$94,278
204
$103,222
25
$69,918
0
$0
18
$91,794
10
$67,180
APPLICATIONS DENIED
17
$127,941
288
$89,816
655
$106,061
133
$54,358
0
$0
96
$104,214
43
$83,403
APPLICATIONS WITHDRAWN
16
$133,013
194
$100,952
546
$115,972
74
$120,006
0
$0
41
$126,538
21
$81,709
FILES CLOSED FOR INCOMPLETENESS
3
$119,197
43
$90,034
154
$115,756
3
$13,630
1
$222,490
7
$95,589
1
$91,820
Aggregated Statistics For Year 2004 (Based on 2 full and 16 partial tracts)
A) FHA, FSA/RHS & VA Home Purchase Loans
B) Conventional Home Purchase Loans
C) Refinancings
D) Home Improvement Loans
E) Loans on Dwellings For 5+ Families
F) Non-occupant Loans on < 5 Family Dwellings (A B C & D)
G) Loans On Manufactured Home Dwelling (A B C & D)
Number
Average Value
Number
Average Value
Number
Average Value
Number
Average Value
Number
Average Value
Number
Average Value
Number
Average Value
LOANS ORIGINATED
212
$118,850
1,012
$111,767
1,034
$99,347
173
$40,218
11
$1,114,189
267
$95,144
40
$98,956
APPLICATIONS APPROVED, NOT ACCEPTED
21
$115,367
129
$102,445
239
$100,429
19
$66,106
0
$0
18
$103,618
6
$115,850
APPLICATIONS DENIED
38
$113,778
197
$89,445
733
$97,722
128
$40,196
1
$257,550
69
$90,161
43
$91,606
APPLICATIONS WITHDRAWN
16
$122,563
103
$108,090
533
$111,531
31
$50,085
0
$0
39
$102,393
17
$68,419
FILES CLOSED FOR INCOMPLETENESS
2
$139,935
10
$136,625
131
$121,150
11
$32,694
0
$0
7
$115,811
4
$173,358
Aggregated Statistics For Year 2003 (Based on 2 full and 16 partial tracts)
A) FHA, FSA/RHS & VA Home Purchase Loans
B) Conventional Home Purchase Loans
C) Refinancings
D) Home Improvement Loans
E) Loans on Dwellings For 5+ Families
F) Non-occupant Loans on < 5 Family Dwellings (A B C & D)
Number
Average Value
Number
Average Value
Number
Average Value
Number
Average Value
Number
Average Value
Number
Average Value
LOANS ORIGINATED
288
$113,645
777
$115,720
2,530
$101,302
173
$42,595
21
$718,710
300
$95,359
APPLICATIONS APPROVED, NOT ACCEPTED
12
$114,518
71
$112,935
268
$98,287
27
$26,986
2
$212,230
18
$106,600
APPLICATIONS DENIED
30
$124,807
146
$96,278
679
$98,843
45
$27,042
0
$0
58
$94,564
APPLICATIONS WITHDRAWN
34
$115,849
79
$115,210
451
$107,600
7
$63,887
0
$0
23
$113,316
FILES CLOSED FOR INCOMPLETENESS
5
$93,816
21
$106,329
64
$96,109
6
$24,965
0
$0
2
$95,980
Aggregated Statistics For Year 2002 (Based on 2 full and 14 partial tracts)
A) FHA, FSA/RHS & VA Home Purchase Loans
B) Conventional Home Purchase Loans
C) Refinancings
D) Home Improvement Loans
E) Loans on Dwellings For 5+ Families
F) Non-occupant Loans on < 5 Family Dwellings (A B C & D)
Number
Average Value
Number
Average Value
Number
Average Value
Number
Average Value
Number
Average Value
Number
Average Value
LOANS ORIGINATED
348
$104,763
603
$91,897
1,201
$88,367
108
$31,894
13
$1,198,074
219
$83,676
APPLICATIONS APPROVED, NOT ACCEPTED
19
$97,952
55
$92,837
186
$90,238
6
$18,082
0
$0
20
$84,166
APPLICATIONS DENIED
21
$94,488
104
$89,639
463
$88,920
40
$24,274
0
$0
34
$73,247
APPLICATIONS WITHDRAWN
20
$94,724
60
$78,494
322
$91,719
11
$33,438
0
$0
17
$81,238
FILES CLOSED FOR INCOMPLETENESS
0
$0
8
$108,021
57
$77,221
3
$23,710
0
$0
2
$63,820
Aggregated Statistics For Year 2001 (Based on 2 full and 14 partial tracts)
A) FHA, FSA/RHS & VA Home Purchase Loans
B) Conventional Home Purchase Loans
C) Refinancings
D) Home Improvement Loans
E) Loans on Dwellings For 5+ Families
F) Non-occupant Loans on < 5 Family Dwellings (A B C & D)
Number
Average Value
Number
Average Value
Number
Average Value
Number
Average Value
Number
Average Value
Number
Average Value
LOANS ORIGINATED
300
$93,007
501
$80,692
783
$83,011
76
$21,066
13
$1,133,487
147
$81,484
APPLICATIONS APPROVED, NOT ACCEPTED
19
$91,408
53
$77,759
94
$73,828
15
$17,981
0
$0
10
$76,709
APPLICATIONS DENIED
12
$88,261
168
$69,361
465
$76,650
52
$20,142
0
$0
38
$88,460
APPLICATIONS WITHDRAWN
14
$82,168
63
$91,750
350
$86,853
25
$18,766
0
$0
20
$76,782
FILES CLOSED FOR INCOMPLETENESS
2
$79,635
9
$76,782
57
$85,551
4
$28,678
0
$0
6
$96,588
Aggregated Statistics For Year 2000 (Based on 2 full and 14 partial tracts)
A) FHA, FSA/RHS & VA Home Purchase Loans
B) Conventional Home Purchase Loans
C) Refinancings
D) Home Improvement Loans
E) Loans on Dwellings For 5+ Families
F) Non-occupant Loans on < 5 Family Dwellings (A B C & D)
Number
Average Value
Number
Average Value
Number
Average Value
Number
Average Value
Number
Average Value
Number
Average Value
LOANS ORIGINATED
278
$89,823
473
$77,806
218
$66,771
134
$19,186
3
$95,847
68
$74,766
APPLICATIONS APPROVED, NOT ACCEPTED
24
$64,768
71
$73,947
71
$79,689
36
$20,075
2
$430,700
11
$83,337
APPLICATIONS DENIED
55
$76,152
307
$76,572
258
$55,519
79
$20,009
0
$0
31
$74,045
APPLICATIONS WITHDRAWN
26
$84,111
57
$86,973
136
$52,887
19
$39,307
0
$0
7
$83,101
FILES CLOSED FOR INCOMPLETENESS
2
$59,960
4
$56,568
56
$70,153
4
$42,405
0
$0
0
$0
Aggregated Statistics For Year 1999 (Based on 1 full and 8 partial tracts)
A) FHA, FSA/RHS & VA Home Purchase Loans
B) Conventional Home Purchase Loans
C) Refinancings
D) Home Improvement Loans
E) Loans on Dwellings For 5+ Families
F) Non-occupant Loans on < 5 Family Dwellings (A B C & D)
2002 - 2018 National Fire Incident Reporting System (NFIRS) incidents
Based on the data from the years 2002 - 2018 the average number of fires per year is 250. The highest number of reported fires - 317 took place in 2015, and the least - 168 in 2017. The data has a declining trend.
When looking into fire subcategories, the most reports belonged to: Structure Fires (44.0%), and Outside Fires (38.2%).
Fire incident types reported to NFIRS in Zip Code 99336


 Nearest zip codes: 99338, 99352, 99337, 99354, 99353, 99346.


 Based on the data from the years 2002 - 2018 the average number of fires per year is 250. The highest number of reported fires - 317 took place in 2015, and the least - 168 in 2017. The data has a declining trend.
 When looking into fire subcategories, the most reports belonged to: Structure Fires (44.0%), and Outside Fires (38.2%).