Casper, Wyoming Submit your own pictures of this city and show them to the world
OSM Map
General Map
Google Map
MSN Map
OSM Map
General Map
Google Map
MSN Map
OSM Map
General Map
Google Map
MSN Map
OSM Map
General Map
Google Map
MSN Map
Please wait while loading the map...
Population in 2022: 58,543 (100% urban, 0% rural). Population change since 2000: +17.9%Males: 29,390 Females: 29,153
March 2022 cost of living index in Casper: 81.4 (low, U.S. average is 100) Percentage of residents living in poverty in 2022: 10.6%for White Non-Hispanic residents , 66.9% for Black residents , 15.6% for Hispanic or Latino residents , 18.6% for American Indian residents , 10.5% for other race residents , 9.3% for two or more races residents )
Profiles of local businesses
Business Search - 14 Million verified businesses
Data:
Median household income ($)
Median household income (% change since 2000)
Household income diversity
Ratio of average income to average house value (%)
Ratio of average income to average rent
Median household income ($) - White
Median household income ($) - Black or African American
Median household income ($) - Asian
Median household income ($) - Hispanic or Latino
Median household income ($) - American Indian and Alaska Native
Median household income ($) - Multirace
Median household income ($) - Other Race
Median household income for houses/condos with a mortgage ($)
Median household income for apartments without a mortgage ($)
Races - White alone (%)
Races - White alone (% change since 2000)
Races - Black alone (%)
Races - Black alone (% change since 2000)
Races - American Indian alone (%)
Races - American Indian alone (% change since 2000)
Races - Asian alone (%)
Races - Asian alone (% change since 2000)
Races - Hispanic (%)
Races - Hispanic (% change since 2000)
Races - Native Hawaiian and Other Pacific Islander alone (%)
Races - Native Hawaiian and Other Pacific Islander alone (% change since 2000)
Races - Two or more races (%)
Races - Two or more races (% change since 2000)
Races - Other race alone (%)
Races - Other race alone (% change since 2000)
Racial diversity
Unemployment (%)
Unemployment (% change since 2000)
Unemployment (%) - White
Unemployment (%) - Black or African American
Unemployment (%) - Asian
Unemployment (%) - Hispanic or Latino
Unemployment (%) - American Indian and Alaska Native
Unemployment (%) - Multirace
Unemployment (%) - Other Race
Population density (people per square mile)
Population - Males (%)
Population - Females (%)
Population - Males (%) - White
Population - Males (%) - Black or African American
Population - Males (%) - Asian
Population - Males (%) - Hispanic or Latino
Population - Males (%) - American Indian and Alaska Native
Population - Males (%) - Multirace
Population - Males (%) - Other Race
Population - Females (%) - White
Population - Females (%) - Black or African American
Population - Females (%) - Asian
Population - Females (%) - Hispanic or Latino
Population - Females (%) - American Indian and Alaska Native
Population - Females (%) - Multirace
Population - Females (%) - Other Race
Coronavirus confirmed cases (Jun 03, 2024)
Deaths caused by coronavirus (Jun 03, 2024)
Coronavirus confirmed cases (per 100k population) (Jun 03, 2024)
Deaths caused by coronavirus (per 100k population) (Jun 03, 2024)
Daily increase in number of cases (Jun 03, 2024)
Weekly increase in number of cases (Jun 03, 2024)
Cases doubled (in days) (Jun 03, 2024)
Hospitalized patients (Apr 18, 2022)
Negative test results (Apr 18, 2022)
Total test results (Apr 18, 2022)
COVID Vaccine doses distributed (per 100k population) (Sep 19, 2023)
COVID Vaccine doses administered (per 100k population) (Sep 19, 2023)
COVID Vaccine doses distributed (Sep 19, 2023)
COVID Vaccine doses administered (Sep 19, 2023)
Likely homosexual households (%)
Likely homosexual households (% change since 2000)
Likely homosexual households - Lesbian couples (%)
Likely homosexual households - Lesbian couples (% change since 2000)
Likely homosexual households - Gay men (%)
Likely homosexual households - Gay men (% change since 2000)
Cost of living index
Median gross rent ($)
Median contract rent ($)
Median monthly housing costs ($)
Median house or condo value ($)
Median house or condo value ($ change since 2000)
Mean house or condo value by units in structure - 1, detached ($)
Mean house or condo value by units in structure - 1, attached ($)
Mean house or condo value by units in structure - 2 ($)
Mean house or condo value by units in structure by units in structure - 3 or 4 ($)
Mean house or condo value by units in structure - 5 or more ($)
Mean house or condo value by units in structure - Boat, RV, van, etc. ($)
Mean house or condo value by units in structure - Mobile home ($)
Median house or condo value ($) - White
Median house or condo value ($) - Black or African American
Median house or condo value ($) - Asian
Median house or condo value ($) - Hispanic or Latino
Median house or condo value ($) - American Indian and Alaska Native
Median house or condo value ($) - Multirace
Median house or condo value ($) - Other Race
Median resident age
Resident age diversity
Median resident age - Males
Median resident age - Females
Median resident age - White
Median resident age - Black or African American
Median resident age - Asian
Median resident age - Hispanic or Latino
Median resident age - American Indian and Alaska Native
Median resident age - Multirace
Median resident age - Other Race
Median resident age - Males - White
Median resident age - Males - Black or African American
Median resident age - Males - Asian
Median resident age - Males - Hispanic or Latino
Median resident age - Males - American Indian and Alaska Native
Median resident age - Males - Multirace
Median resident age - Males - Other Race
Median resident age - Females - White
Median resident age - Females - Black or African American
Median resident age - Females - Asian
Median resident age - Females - Hispanic or Latino
Median resident age - Females - American Indian and Alaska Native
Median resident age - Females - Multirace
Median resident age - Females - Other Race
Commute - mean travel time to work (minutes)
Travel time to work - Less than 5 minutes (%)
Travel time to work - Less than 5 minutes (% change since 2000)
Travel time to work - 5 to 9 minutes (%)
Travel time to work - 5 to 9 minutes (% change since 2000)
Travel time to work - 10 to 19 minutes (%)
Travel time to work - 10 to 19 minutes (% change since 2000)
Travel time to work - 20 to 29 minutes (%)
Travel time to work - 20 to 29 minutes (% change since 2000)
Travel time to work - 30 to 39 minutes (%)
Travel time to work - 30 to 39 minutes (% change since 2000)
Travel time to work - 40 to 59 minutes (%)
Travel time to work - 40 to 59 minutes (% change since 2000)
Travel time to work - 60 to 89 minutes (%)
Travel time to work - 60 to 89 minutes (% change since 2000)
Travel time to work - 90 or more minutes (%)
Travel time to work - 90 or more minutes (% change since 2000)
Marital status - Never married (%)
Marital status - Now married (%)
Marital status - Separated (%)
Marital status - Widowed (%)
Marital status - Divorced (%)
Median family income ($)
Median family income (% change since 2000)
Median non-family income ($)
Median non-family income (% change since 2000)
Median per capita income ($)
Median per capita income (% change since 2000)
Median family income ($) - White
Median family income ($) - Black or African American
Median family income ($) - Asian
Median family income ($) - Hispanic or Latino
Median family income ($) - American Indian and Alaska Native
Median family income ($) - Multirace
Median family income ($) - Other Race
Median year house/condo built
Median year apartment built
Year house built - Built 2005 or later (%)
Year house built - Built 2000 to 2004 (%)
Year house built - Built 1990 to 1999 (%)
Year house built - Built 1980 to 1989 (%)
Year house built - Built 1970 to 1979 (%)
Year house built - Built 1960 to 1969 (%)
Year house built - Built 1950 to 1959 (%)
Year house built - Built 1940 to 1949 (%)
Year house built - Built 1939 or earlier (%)
Average household size
Household density (households per square mile)
Average household size - White
Average household size - Black or African American
Average household size - Asian
Average household size - Hispanic or Latino
Average household size - American Indian and Alaska Native
Average household size - Multirace
Average household size - Other Race
Occupied housing units (%)
Vacant housing units (%)
Owner occupied housing units (%)
Renter occupied housing units (%)
Vacancy status - For rent (%)
Vacancy status - For sale only (%)
Vacancy status - Rented or sold, not occupied (%)
Vacancy status - For seasonal, recreational, or occasional use (%)
Vacancy status - For migrant workers (%)
Vacancy status - Other vacant (%)
Residents with income below the poverty level (%)
Residents with income below 50% of the poverty level (%)
Children below poverty level (%)
Poor families by family type - Married-couple family (%)
Poor families by family type - Male, no wife present (%)
Poor families by family type - Female, no husband present (%)
Poverty status for native-born residents (%)
Poverty status for foreign-born residents (%)
Poverty among high school graduates not in families (%)
Poverty among people who did not graduate high school not in families (%)
Residents with income below the poverty level (%) - White
Residents with income below the poverty level (%) - Black or African American
Residents with income below the poverty level (%) - Asian
Residents with income below the poverty level (%) - Hispanic or Latino
Residents with income below the poverty level (%) - American Indian and Alaska Native
Residents with income below the poverty level (%) - Multirace
Residents with income below the poverty level (%) - Other Race
Air pollution - Air Quality Index (AQI)
Air pollution - CO
Air pollution - NO2
Air pollution - SO2
Air pollution - Ozone
Air pollution - PM10
Air pollution - PM25
Air pollution - Pb
Crime - Murders per 100,000 population
Crime - Rapes per 100,000 population
Crime - Robberies per 100,000 population
Crime - Assaults per 100,000 population
Crime - Burglaries per 100,000 population
Crime - Thefts per 100,000 population
Crime - Auto thefts per 100,000 population
Crime - Arson per 100,000 population
Crime - City-data.com crime index
Crime - Violent crime index
Crime - Property crime index
Crime - Murders per 100,000 population (5 year average)
Crime - Rapes per 100,000 population (5 year average)
Crime - Robberies per 100,000 population (5 year average)
Crime - Assaults per 100,000 population (5 year average)
Crime - Burglaries per 100,000 population (5 year average)
Crime - Thefts per 100,000 population (5 year average)
Crime - Auto thefts per 100,000 population (5 year average)
Crime - Arson per 100,000 population (5 year average)
Crime - City-data.com crime index (5 year average)
Crime - Violent crime index (5 year average)
Crime - Property crime index (5 year average)
1996 Presidential Elections Results (%) - Democratic Party (Clinton)
1996 Presidential Elections Results (%) - Republican Party (Dole)
1996 Presidential Elections Results (%) - Other
2000 Presidential Elections Results (%) - Democratic Party (Gore)
2000 Presidential Elections Results (%) - Republican Party (Bush)
2000 Presidential Elections Results (%) - Other
2004 Presidential Elections Results (%) - Democratic Party (Kerry)
2004 Presidential Elections Results (%) - Republican Party (Bush)
2004 Presidential Elections Results (%) - Other
2008 Presidential Elections Results (%) - Democratic Party (Obama)
2008 Presidential Elections Results (%) - Republican Party (McCain)
2008 Presidential Elections Results (%) - Other
2012 Presidential Elections Results (%) - Democratic Party (Obama)
2012 Presidential Elections Results (%) - Republican Party (Romney)
2012 Presidential Elections Results (%) - Other
2016 Presidential Elections Results (%) - Democratic Party (Clinton)
2016 Presidential Elections Results (%) - Republican Party (Trump)
2016 Presidential Elections Results (%) - Other
2020 Presidential Elections Results (%) - Democratic Party (Biden)
2020 Presidential Elections Results (%) - Republican Party (Trump)
2020 Presidential Elections Results (%) - Other
Ancestries Reported - Arab (%)
Ancestries Reported - Czech (%)
Ancestries Reported - Danish (%)
Ancestries Reported - Dutch (%)
Ancestries Reported - English (%)
Ancestries Reported - French (%)
Ancestries Reported - French Canadian (%)
Ancestries Reported - German (%)
Ancestries Reported - Greek (%)
Ancestries Reported - Hungarian (%)
Ancestries Reported - Irish (%)
Ancestries Reported - Italian (%)
Ancestries Reported - Lithuanian (%)
Ancestries Reported - Norwegian (%)
Ancestries Reported - Polish (%)
Ancestries Reported - Portuguese (%)
Ancestries Reported - Russian (%)
Ancestries Reported - Scotch-Irish (%)
Ancestries Reported - Scottish (%)
Ancestries Reported - Slovak (%)
Ancestries Reported - Subsaharan African (%)
Ancestries Reported - Swedish (%)
Ancestries Reported - Swiss (%)
Ancestries Reported - Ukrainian (%)
Ancestries Reported - United States (%)
Ancestries Reported - Welsh (%)
Ancestries Reported - West Indian (%)
Ancestries Reported - Other (%)
Educational Attainment - No schooling completed (%)
Educational Attainment - Less than high school (%)
Educational Attainment - High school or equivalent (%)
Educational Attainment - Less than 1 year of college (%)
Educational Attainment - 1 or more years of college (%)
Educational Attainment - Associate degree (%)
Educational Attainment - Bachelor's degree (%)
Educational Attainment - Master's degree (%)
Educational Attainment - Professional school degree (%)
Educational Attainment - Doctorate degree (%)
School Enrollment - Nursery, preschool (%)
School Enrollment - Kindergarten (%)
School Enrollment - Grade 1 to 4 (%)
School Enrollment - Grade 5 to 8 (%)
School Enrollment - Grade 9 to 12 (%)
School Enrollment - College undergrad (%)
School Enrollment - Graduate or professional (%)
School Enrollment - Not enrolled in school (%)
School enrollment - Public schools (%)
School enrollment - Private schools (%)
School enrollment - Not enrolled (%)
Median number of rooms in houses and condos
Median number of rooms in apartments
Housing units lacking complete plumbing facilities (%)
Housing units lacking complete kitchen facilities (%)
Density of houses
Urban houses (%)
Rural houses (%)
Households with people 60 years and over (%)
Households with people 65 years and over (%)
Households with people 75 years and over (%)
Households with one or more nonrelatives (%)
Households with no nonrelatives (%)
Population in households (%)
Family households (%)
Nonfamily households (%)
Population in families (%)
Family households with own children (%)
Median number of bedrooms in owner occupied houses
Mean number of bedrooms in owner occupied houses
Median number of bedrooms in renter occupied houses
Mean number of bedrooms in renter occupied houses
Median number of vehichles in owner occupied houses
Mean number of vehichles in owner occupied houses
Median number of vehichles in renter occupied houses
Mean number of vehichles in renter occupied houses
Mortgage status - with mortgage (%)
Mortgage status - with second mortgage (%)
Mortgage status - with home equity loan (%)
Mortgage status - with both second mortgage and home equity loan (%)
Mortgage status - without a mortgage (%)
Average family size
Average family size - White
Average family size - Black or African American
Average family size - Asian
Average family size - Hispanic or Latino
Average family size - American Indian and Alaska Native
Average family size - Multirace
Average family size - Other Race
Geographical mobility - Same house 1 year ago (%)
Geographical mobility - Moved within same county (%)
Geographical mobility - Moved from different county within same state (%)
Geographical mobility - Moved from different state (%)
Geographical mobility - Moved from abroad (%)
Place of birth - Born in state of residence (%)
Place of birth - Born in other state (%)
Place of birth - Native, outside of US (%)
Place of birth - Foreign born (%)
Housing units in structures - 1, detached (%)
Housing units in structures - 1, attached (%)
Housing units in structures - 2 (%)
Housing units in structures - 3 or 4 (%)
Housing units in structures - 5 to 9 (%)
Housing units in structures - 10 to 19 (%)
Housing units in structures - 20 to 49 (%)
Housing units in structures - 50 or more (%)
Housing units in structures - Mobile home (%)
Housing units in structures - Boat, RV, van, etc. (%)
House/condo owner moved in on average (years ago)
Renter moved in on average (years ago)
Year householder moved into unit - Moved in 1999 to March 2000 (%)
Year householder moved into unit - Moved in 1995 to 1998 (%)
Year householder moved into unit - Moved in 1990 to 1994 (%)
Year householder moved into unit - Moved in 1980 to 1989 (%)
Year householder moved into unit - Moved in 1970 to 1979 (%)
Year householder moved into unit - Moved in 1969 or earlier (%)
Means of transportation to work - Drove car alone (%)
Means of transportation to work - Carpooled (%)
Means of transportation to work - Public transportation (%)
Means of transportation to work - Bus or trolley bus (%)
Means of transportation to work - Streetcar or trolley car (%)
Means of transportation to work - Subway or elevated (%)
Means of transportation to work - Railroad (%)
Means of transportation to work - Ferryboat (%)
Means of transportation to work - Taxicab (%)
Means of transportation to work - Motorcycle (%)
Means of transportation to work - Bicycle (%)
Means of transportation to work - Walked (%)
Means of transportation to work - Other means (%)
Working at home (%)
Industry diversity
Most Common Industries - Agriculture, forestry, fishing and hunting, and mining (%)
Most Common Industries - Agriculture, forestry, fishing and hunting (%)
Most Common Industries - Mining, quarrying, and oil and gas extraction (%)
Most Common Industries - Construction (%)
Most Common Industries - Manufacturing (%)
Most Common Industries - Wholesale trade (%)
Most Common Industries - Retail trade (%)
Most Common Industries - Transportation and warehousing, and utilities (%)
Most Common Industries - Transportation and warehousing (%)
Most Common Industries - Utilities (%)
Most Common Industries - Information (%)
Most Common Industries - Finance and insurance, and real estate and rental and leasing (%)
Most Common Industries - Finance and insurance (%)
Most Common Industries - Real estate and rental and leasing (%)
Most Common Industries - Professional, scientific, and management, and administrative and waste management services (%)
Most Common Industries - Professional, scientific, and technical services (%)
Most Common Industries - Management of companies and enterprises (%)
Most Common Industries - Administrative and support and waste management services (%)
Most Common Industries - Educational services, and health care and social assistance (%)
Most Common Industries - Educational services (%)
Most Common Industries - Health care and social assistance (%)
Most Common Industries - Arts, entertainment, and recreation, and accommodation and food services (%)
Most Common Industries - Arts, entertainment, and recreation (%)
Most Common Industries - Accommodation and food services (%)
Most Common Industries - Other services, except public administration (%)
Most Common Industries - Public administration (%)
Occupation diversity
Most Common Occupations - Management, business, science, and arts occupations (%)
Most Common Occupations - Management, business, and financial occupations (%)
Most Common Occupations - Management occupations (%)
Most Common Occupations - Business and financial operations occupations (%)
Most Common Occupations - Computer, engineering, and science occupations (%)
Most Common Occupations - Computer and mathematical occupations (%)
Most Common Occupations - Architecture and engineering occupations (%)
Most Common Occupations - Life, physical, and social science occupations (%)
Most Common Occupations - Education, legal, community service, arts, and media occupations (%)
Most Common Occupations - Community and social service occupations (%)
Most Common Occupations - Legal occupations (%)
Most Common Occupations - Education, training, and library occupations (%)
Most Common Occupations - Arts, design, entertainment, sports, and media occupations (%)
Most Common Occupations - Healthcare practitioners and technical occupations (%)
Most Common Occupations - Health diagnosing and treating practitioners and other technical occupations (%)
Most Common Occupations - Health technologists and technicians (%)
Most Common Occupations - Service occupations (%)
Most Common Occupations - Healthcare support occupations (%)
Most Common Occupations - Protective service occupations (%)
Most Common Occupations - Fire fighting and prevention, and other protective service workers including supervisors (%)
Most Common Occupations - Law enforcement workers including supervisors (%)
Most Common Occupations - Food preparation and serving related occupations (%)
Most Common Occupations - Building and grounds cleaning and maintenance occupations (%)
Most Common Occupations - Personal care and service occupations (%)
Most Common Occupations - Sales and office occupations (%)
Most Common Occupations - Sales and related occupations (%)
Most Common Occupations - Office and administrative support occupations (%)
Most Common Occupations - Natural resources, construction, and maintenance occupations (%)
Most Common Occupations - Farming, fishing, and forestry occupations (%)
Most Common Occupations - Construction and extraction occupations (%)
Most Common Occupations - Installation, maintenance, and repair occupations (%)
Most Common Occupations - Production, transportation, and material moving occupations (%)
Most Common Occupations - Production occupations (%)
Most Common Occupations - Transportation occupations (%)
Most Common Occupations - Material moving occupations (%)
People in Group quarters - Institutionalized population (%)
People in Group quarters - Correctional institutions (%)
People in Group quarters - Federal prisons and detention centers (%)
People in Group quarters - Halfway houses (%)
People in Group quarters - Local jails and other confinement facilities (including police lockups) (%)
People in Group quarters - Military disciplinary barracks (%)
People in Group quarters - State prisons (%)
People in Group quarters - Other types of correctional institutions (%)
People in Group quarters - Nursing homes (%)
People in Group quarters - Hospitals/wards, hospices, and schools for the handicapped (%)
People in Group quarters - Hospitals/wards and hospices for chronically ill (%)
People in Group quarters - Hospices or homes for chronically ill (%)
People in Group quarters - Military hospitals or wards for chronically ill (%)
People in Group quarters - Other hospitals or wards for chronically ill (%)
People in Group quarters - Hospitals or wards for drug/alcohol abuse (%)
People in Group quarters - Mental (Psychiatric) hospitals or wards (%)
People in Group quarters - Schools, hospitals, or wards for the mentally retarded (%)
People in Group quarters - Schools, hospitals, or wards for the physically handicapped (%)
People in Group quarters - Institutions for the deaf (%)
People in Group quarters - Institutions for the blind (%)
People in Group quarters - Orthopedic wards and institutions for the physically handicapped (%)
People in Group quarters - Wards in general hospitals for patients who have no usual home elsewhere (%)
People in Group quarters - Wards in military hospitals for patients who have no usual home elsewhere (%)
People in Group quarters - Juvenile institutions (%)
People in Group quarters - Long-term care (%)
People in Group quarters - Homes for abused, dependent, and neglected children (%)
People in Group quarters - Residential treatment centers for emotionally disturbed children (%)
People in Group quarters - Training schools for juvenile delinquents (%)
People in Group quarters - Short-term care, detention or diagnostic centers for delinquent children (%)
People in Group quarters - Type of juvenile institution unknown (%)
People in Group quarters - Noninstitutionalized population (%)
People in Group quarters - College dormitories (includes college quarters off campus) (%)
People in Group quarters - Military quarters (%)
People in Group quarters - On base (%)
People in Group quarters - Barracks, unaccompanied personnel housing (UPH), (Enlisted/Officer), ;and similar group living quarters for military personnel (%)
People in Group quarters - Transient quarters for temporary residents (%)
People in Group quarters - Military ships (%)
People in Group quarters - Group homes (%)
People in Group quarters - Homes or halfway houses for drug/alcohol abuse (%)
People in Group quarters - Homes for the mentally ill (%)
People in Group quarters - Homes for the mentally retarded (%)
People in Group quarters - Homes for the physically handicapped (%)
People in Group quarters - Other group homes (%)
People in Group quarters - Religious group quarters (%)
People in Group quarters - Dormitories (%)
People in Group quarters - Agriculture workers' dormitories on farms (%)
People in Group quarters - Job Corps and vocational training facilities (%)
People in Group quarters - Other workers' dormitories (%)
People in Group quarters - Crews of maritime vessels (%)
People in Group quarters - Other nonhousehold living situations (%)
People in Group quarters - Other noninstitutional group quarters (%)
Residents speaking English at home (%)
Residents speaking English at home - Born in the United States (%)
Residents speaking English at home - Native, born elsewhere (%)
Residents speaking English at home - Foreign born (%)
Residents speaking Spanish at home (%)
Residents speaking Spanish at home - Born in the United States (%)
Residents speaking Spanish at home - Native, born elsewhere (%)
Residents speaking Spanish at home - Foreign born (%)
Residents speaking other language at home (%)
Residents speaking other language at home - Born in the United States (%)
Residents speaking other language at home - Native, born elsewhere (%)
Residents speaking other language at home - Foreign born (%)
Class of Workers - Employee of private company (%)
Class of Workers - Self-employed in own incorporated business (%)
Class of Workers - Private not-for-profit wage and salary workers (%)
Class of Workers - Local government workers (%)
Class of Workers - State government workers (%)
Class of Workers - Federal government workers (%)
Class of Workers - Self-employed workers in own not incorporated business and Unpaid family workers (%)
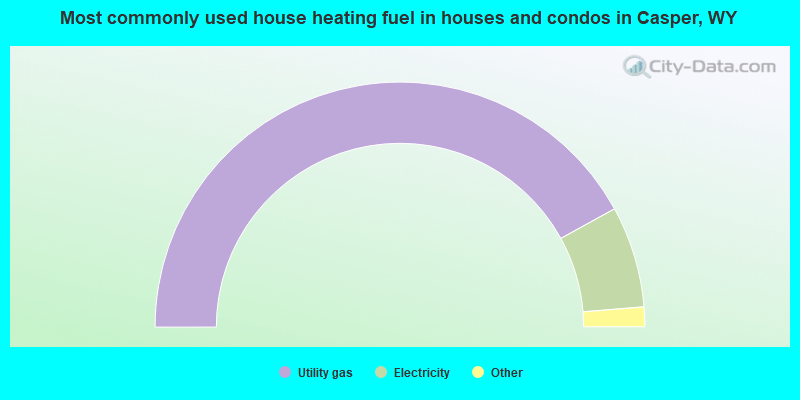
House heating fuel used in houses and condos - Utility gas (%)
House heating fuel used in houses and condos - Bottled, tank, or LP gas (%)
House heating fuel used in houses and condos - Electricity (%)
House heating fuel used in houses and condos - Fuel oil, kerosene, etc. (%)
House heating fuel used in houses and condos - Coal or coke (%)
House heating fuel used in houses and condos - Wood (%)
House heating fuel used in houses and condos - Solar energy (%)
House heating fuel used in houses and condos - Other fuel (%)
House heating fuel used in houses and condos - No fuel used (%)
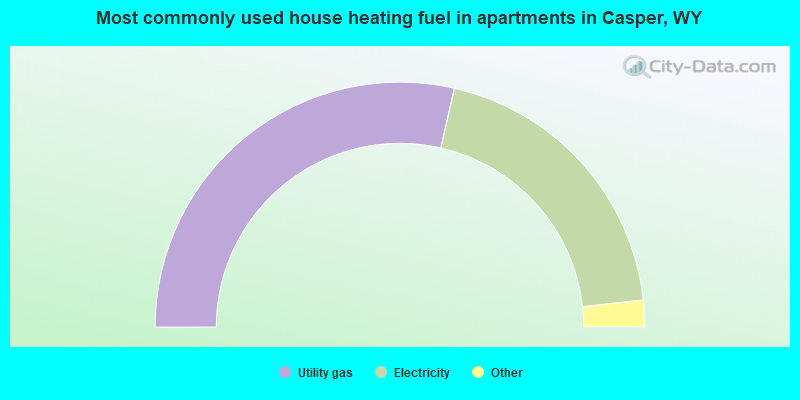
House heating fuel used in apartments - Utility gas (%)
House heating fuel used in apartments - Bottled, tank, or LP gas (%)
House heating fuel used in apartments - Electricity (%)
House heating fuel used in apartments - Fuel oil, kerosene, etc. (%)
House heating fuel used in apartments - Coal or coke (%)
House heating fuel used in apartments - Wood (%)
House heating fuel used in apartments - Solar energy (%)
House heating fuel used in apartments - Other fuel (%)
House heating fuel used in apartments - No fuel used (%)
Armed forces status - In Armed Forces (%)
Armed forces status - Civilian (%)
Armed forces status - Civilian - Veteran (%)
Armed forces status - Civilian - Nonveteran (%)
Fatal accidents locations in years 2005-2021
Fatal accidents locations in 2005
Fatal accidents locations in 2006
Fatal accidents locations in 2007
Fatal accidents locations in 2008
Fatal accidents locations in 2009
Fatal accidents locations in 2010
Fatal accidents locations in 2011
Fatal accidents locations in 2012
Fatal accidents locations in 2013
Fatal accidents locations in 2014
Fatal accidents locations in 2015
Fatal accidents locations in 2016
Fatal accidents locations in 2017
Fatal accidents locations in 2018
Fatal accidents locations in 2019
Fatal accidents locations in 2020
Fatal accidents locations in 2021
Alcohol use - People drinking some alcohol every month (%)
Alcohol use - People not drinking at all (%)
Alcohol use - Average days/month drinking alcohol
Alcohol use - Average drinks/week
Alcohol use - Average days/year people drink much
Audiometry - Average condition of hearing (%)
Audiometry - People that can hear a whisper from across a quiet room (%)
Audiometry - People that can hear normal voice from across a quiet room (%)
Audiometry - Ears ringing, roaring, buzzing (%)
Audiometry - Had a job exposure to loud noise (%)
Audiometry - Had off-work exposure to loud noise (%)
Blood Pressure & Cholesterol - Has high blood pressure (%)
Blood Pressure & Cholesterol - Checking blood pressure at home (%)
Blood Pressure & Cholesterol - Frequently checking blood cholesterol (%)
Blood Pressure & Cholesterol - Has high cholesterol level (%)
Consumer Behavior - Money monthly spent on food at supermarket/grocery store
Consumer Behavior - Money monthly spent on food at other stores
Consumer Behavior - Money monthly spent on eating out
Consumer Behavior - Money monthly spent on carryout/delivered foods
Consumer Behavior - Income spent on food at supermarket/grocery store (%)
Consumer Behavior - Income spent on food at other stores (%)
Consumer Behavior - Income spent on eating out (%)
Consumer Behavior - Income spent on carryout/delivered foods (%)
Current Health Status - General health condition (%)
Current Health Status - Blood donors (%)
Current Health Status - Has blood ever tested for HIV virus (%)
Current Health Status - Left-handed people (%)
Dermatology - People using sunscreen (%)
Diabetes - Diabetics (%)
Diabetes - Had a blood test for high blood sugar (%)
Diabetes - People taking insulin (%)
Diet Behavior & Nutrition - Diet health (%)
Diet Behavior & Nutrition - Milk product consumption (# of products/month)
Diet Behavior & Nutrition - Meals not home prepared (#/week)
Diet Behavior & Nutrition - Meals from fast food or pizza place (#/week)
Diet Behavior & Nutrition - Ready-to-eat foods (#/month)
Diet Behavior & Nutrition - Frozen meals/pizza (#/month)
Drug Use - People that ever used marijuana or hashish (%)
Drug Use - Ever used hard drugs (%)
Drug Use - Ever used any form of cocaine (%)
Drug Use - Ever used heroin (%)
Drug Use - Ever used methamphetamine (%)
Health Insurance - People covered by health insurance (%)
Kidney Conditions-Urology - Avg. # of times urinating at night
Medical Conditions - People with asthma (%)
Medical Conditions - People with anemia (%)
Medical Conditions - People with psoriasis (%)
Medical Conditions - People with overweight (%)
Medical Conditions - Elderly people having difficulties in thinking or remembering (%)
Medical Conditions - People who ever received blood transfusion (%)
Medical Conditions - People having trouble seeing even with glass/contacts (%)
Medical Conditions - People with arthritis (%)
Medical Conditions - People with gout (%)
Medical Conditions - People with congestive heart failure (%)
Medical Conditions - People with coronary heart disease (%)
Medical Conditions - People with angina pectoris (%)
Medical Conditions - People who ever had heart attack (%)
Medical Conditions - People who ever had stroke (%)
Medical Conditions - People with emphysema (%)
Medical Conditions - People with thyroid problem (%)
Medical Conditions - People with chronic bronchitis (%)
Medical Conditions - People with any liver condition (%)
Medical Conditions - People who ever had cancer or malignancy (%)
Mental Health - People who have little interest in doing things (%)
Mental Health - People feeling down, depressed, or hopeless (%)
Mental Health - People who have trouble sleeping or sleeping too much (%)
Mental Health - People feeling tired or having little energy (%)
Mental Health - People with poor appetite or overeating (%)
Mental Health - People feeling bad about themself (%)
Mental Health - People who have trouble concentrating on things (%)
Mental Health - People moving or speaking slowly or too fast (%)
Mental Health - People having thoughts they would be better off dead (%)
Oral Health - Average years since last visit a dentist
Oral Health - People embarrassed because of mouth (%)
Oral Health - People with gum disease (%)
Oral Health - General health of teeth and gums (%)
Oral Health - Average days a week using dental floss/device
Oral Health - Average days a week using mouthwash for dental problem
Oral Health - Average number of teeth
Pesticide Use - Households using pesticides to control insects (%)
Pesticide Use - Households using pesticides to kill weeds (%)
Physical Activity - People doing vigorous-intensity work activities (%)
Physical Activity - People doing moderate-intensity work activities (%)
Physical Activity - People walking or bicycling (%)
Physical Activity - People doing vigorous-intensity recreational activities (%)
Physical Activity - People doing moderate-intensity recreational activities (%)
Physical Activity - Average hours a day doing sedentary activities
Physical Activity - Average hours a day watching TV or videos
Physical Activity - Average hours a day using computer
Physical Functioning - People having limitations keeping them from working (%)
Physical Functioning - People limited in amount of work they can do (%)
Physical Functioning - People that need special equipment to walk (%)
Physical Functioning - People experiencing confusion/memory problems (%)
Physical Functioning - People requiring special healthcare equipment (%)
Prescription Medications - Average number of prescription medicines taking
Preventive Aspirin Use - Adults 40+ taking low-dose aspirin (%)
Reproductive Health - Vaginal deliveries (%)
Reproductive Health - Cesarean deliveries (%)
Reproductive Health - Deliveries resulted in a live birth (%)
Reproductive Health - Pregnancies resulted in a delivery (%)
Reproductive Health - Women breastfeeding newborns (%)
Reproductive Health - Women that had a hysterectomy (%)
Reproductive Health - Women that had both ovaries removed (%)
Reproductive Health - Women that have ever taken birth control pills (%)
Reproductive Health - Women taking birth control pills (%)
Reproductive Health - Women that have ever used Depo-Provera or injectables (%)
Reproductive Health - Women that have ever used female hormones (%)
Sexual Behavior - People 18+ that ever had sex (vaginal, anal, or oral) (%)
Sexual Behavior - Males 18+ that ever had vaginal sex with a woman (%)
Sexual Behavior - Males 18+ that ever performed oral sex on a woman (%)
Sexual Behavior - Males 18+ that ever had anal sex with a woman (%)
Sexual Behavior - Males 18+ that ever had any sex with a man (%)
Sexual Behavior - Females 18+ that ever had vaginal sex with a man (%)
Sexual Behavior - Females 18+ that ever performed oral sex on a man (%)
Sexual Behavior - Females 18+ that ever had anal sex with a man (%)
Sexual Behavior - Females 18+ that ever had any kind of sex with a woman (%)
Sexual Behavior - Average age people first had sex
Sexual Behavior - Average number of female sex partners in lifetime (males 18+)
Sexual Behavior - Average number of female vaginal sex partners in lifetime (males 18+)
Sexual Behavior - Average age people first performed oral sex on a woman (18+)
Sexual Behavior - Average number of woman performed oral sex on in lifetime (18+)
Sexual Behavior - Average number of male sex partners in lifetime (males 18+)
Sexual Behavior - Average number of male anal sex partners in lifetime (males 18+)
Sexual Behavior - Average age people first performed oral sex on a man (18+)
Sexual Behavior - Average number of male oral sex partners in lifetime (18+)
Sexual Behavior - People using protection when performing oral sex (%)
Sexual Behavior - Average number of times people have vaginal or anal sex a year
Sexual Behavior - People having sex without condom (%)
Sexual Behavior - Average number of male sex partners in lifetime (females 18+)
Sexual Behavior - Average number of male vaginal sex partners in lifetime (females 18+)
Sexual Behavior - Average number of female sex partners in lifetime (females 18+)
Sexual Behavior - Circumcised males 18+ (%)
Sleep Disorders - Average hours sleeping at night
Sleep Disorders - People that has trouble sleeping (%)
Smoking-Cigarette Use - People smoking cigarettes (%)
Taste & Smell - People 40+ having problems with smell (%)
Taste & Smell - People 40+ having problems with taste (%)
Taste & Smell - People 40+ that ever had wisdom teeth removed (%)
Taste & Smell - People 40+ that ever had tonsils teeth removed (%)
Taste & Smell - People 40+ that ever had a loss of consciousness because of a head injury (%)
Taste & Smell - People 40+ that ever had a broken nose or other serious injury to face or skull (%)
Taste & Smell - People 40+ that ever had two or more sinus infections (%)
Weight - Average height (inches)
Weight - Average weight (pounds)
Weight - Average BMI
Weight - People that are obese (%)
Weight - People that ever were obese (%)
Weight - People trying to lose weight (%)
The City-Data.com crime index weighs serious crimes and violent crimes more heavily. Higher means more crime, U.S. average is 246.1. It adjusts for the number of visitors and daily workers commuting into cities.
- means the value is smaller than the state average.
- means the value is about the same as the state average.
- means the value is bigger than the state average.
- means the value is much bigger than the state average.
Crime rate in Casper detailed stats: murders, rapes, robberies, assaults, burglaries, thefts, arson Officers per 1,000 residents here:
1.72Wyoming average:
2.78
Latest news from Casper, WY collected exclusively by city-data.com from local newspapers, TV, and radio stations
Ancestries: German (17.2%), English (7.0%), American (6.8%), Irish (6.2%), European (5.3%), Norwegian (3.3%).
Current Local Time:
Land area: 23.9 square miles.
Population density: 2,445 people per square mile (low).
1,215 residents are foreign born (0.9% Latin America , 0.5% Europe , 0.4% Asia , 0.2% North America ).
This city:
2.1%Wyoming:
3.4%
Median real estate property taxes paid for housing units with mortgages in 2022: $1,377 (0.6%)Median real estate property taxes paid for housing units with no mortgage in 2022: $1,515 (0.5%)
Nearest city with pop. 50,000+: Cheyenne, WY
Nearest city with pop. 200,000+: West Adams, CO (216.1 miles
Nearest city with pop. 1,000,000+: Phoenix, AZ
Nearest cities:
Brookhurst, WY (2.3 miles),
Latitude: 42.83 N, Longitude: 106.33 W
Daytime population change due to commuting: +446 (+0.8%)Workers who live and work in this city: 23,725 (80.6%)
Casper tourist attractions:
Single-family new house construction building permits:
2022: 52 buildings , average cost: $433,4002021: 65 buildings , average cost: $297,5002020: 60 buildings , average cost: $300,9002019: 62 buildings , average cost: $273,8002018: 60 buildings , average cost: $299,2002017: 66 buildings , average cost: $297,2002016: 63 buildings , average cost: $264,9002015: 77 buildings , average cost: $303,0002014: 146 buildings , average cost: $280,5002013: 211 buildings , average cost: $217,4002012: 197 buildings , average cost: $205,9002011: 171 buildings , average cost: $189,5002010: 121 buildings , average cost: $165,0002009: 106 buildings , average cost: $148,5002008: 260 buildings , average cost: $170,7002007: 315 buildings , average cost: $198,8002006: 292 buildings , average cost: $212,4002005: 293 buildings , average cost: $210,4002004: 191 buildings , average cost: $201,6002003: 139 buildings , average cost: $178,1002002: 110 buildings , average cost: $182,8002001: 75 buildings , average cost: $188,6002000: 72 buildings , average cost: $140,6001999: 64 buildings , average cost: $149,3001998: 49 buildings , average cost: $125,0001997: 53 buildings , average cost: $103,500Unemployment in December 2023:
Most common occupations in Casper, WY (%)
Both Males Females
Other sales and related occupations, including supervisors (5.8%)
Other management occupations, except farmers and farm managers (4.3%)
Building and grounds cleaning and maintenance occupations (4.3%)
Retail sales workers, except cashiers (4.0%)
Secretaries and administrative assistants (3.3%)
Electrical equipment mechanics and other installation, maintenance, and repair workers, including supervisors (3.3%)
Other office and administrative support workers, including supervisors (3.3%)
Electrical equipment mechanics and other installation, maintenance, and repair workers, including supervisors (6.2%)
Other sales and related occupations, including supervisors (6.0%)
Other management occupations, except farmers and farm managers (5.2%)
Driver/sales workers and truck drivers (5.2%)
Vehicle and mobile equipment mechanics, installers, and repairers (4.4%)
Building and grounds cleaning and maintenance occupations (4.1%)
Metal workers and plastic workers (3.8%)
Secretaries and administrative assistants (6.7%)
Other office and administrative support workers, including supervisors (5.8%)
Other sales and related occupations, including supervisors (5.4%)
Preschool, kindergarten, elementary, and middle school teachers (4.7%)
Information and record clerks, except customer service representatives (4.5%)
Building and grounds cleaning and maintenance occupations (4.5%)
Retail sales workers, except cashiers (4.4%)
Earthquake activity:
Casper-area historical earthquake activity is significantly above Wyoming state average. It is 750% greater than the overall U.S. average. On 8/18/1959 at 06:37:13, a magnitude 7.7 (7.7 UK, Class: Major, Intensity: VIII - XII) earthquake occurred 247.4 miles away from Casper center, causing $26,000,000 total damage On 10/28/1983 at 14:06:06, a magnitude 7.3 (6.2 MB, 7.3 MS, 7.0 MW) earthquake occurred 385.0 miles away from Casper center, causing 2 deaths ( 2 shaking deaths) and 3 injuries, causing $15,000,000 total damage On 10/18/1984 at 15:30:23, a magnitude 5.5 (5.4 MB, 5.1 MS, 5.5 ML, Class: Moderate, Intensity: VI - VII) earthquake occurred 49.1 miles away from Casper center On 6/30/1975 at 18:54:13, a magnitude 6.1 (5.6 MB, 5.9 MS, 6.1 UK, 6.1 ML, Class: Strong, Intensity: VII - IX) earthquake occurred 254.4 miles away from Casper center On 2/3/1994 at 09:05:04, a magnitude 5.8 (5.4 MB, 5.5 MS, 5.8 MW, 5.8 ML, Depth: 4.9 mi) earthquake occurred 235.5 miles away from the city center On 3/28/1975 at 02:31:05, a magnitude 6.2 (6.1 MB, 6.0 MS, 6.2 ML) earthquake occurred 319.0 miles away from the city center Magnitude types: body-wave magnitude (MB), local magnitude (ML), surface-wave magnitude (MS), moment magnitude (MW) Natural disasters: The number of natural disasters in Natrona County (4) is a lot smaller than the US average (15).Major Disasters (Presidential) Declared: 1Fires: 2, Flood: 1, Mudslide: 1, Storm: 1, Other: 1 (Note: some incidents may be assigned to more than one category). Main business address for: DOUBLE EAGLE PETROLEUM CO CRUDE PETROLEUM & NATURAL GAS ), AMERICAN NUCLEAR CORP [9995] ).
Hospitals in Casper: CENTRAL WYOMING HOSPICE PROGRAM (319 SOUTH WILSON STREET) CENTRAL WYOMING OUTPATIENT SURGERY CENTER (1201 EAST 3RD STREET) MOUNTAIN VIEW REGIONAL HOSPITAL (Proprietary, 6550 EAST 2ND STREET) WYOMING BEHAVIORAL INSTITUTE (2521 EAST 15TH STREET) WYOMING MEDICAL CENTER (Government - Hospital District or Authority, provides emergency services, 1233 EAST 2ND ST) Nursing Homes in Casper: LIFE CARE CENTER OF CASPER (4041 SOUTH POPLAR STREET) POPLAR LIVING CENTER (4305 S POPLAR) SHEPHERD OF THE VALLEY HEALTHCARE CENTER (60 MAGNOLIA) WYOMING MEDICAL CENTER TRANSITIONAL CARE UNIT (1233 E 2ND STREET) Dialysis Facilities in Casper: WYOMING KIDNEY CENTER (1141 WILKINS CIR) Home Health Centers in Casper: AMEDISYS HOME HEALTH OF CASPER (907 N POPLAR STREET, SUITE 153) INTERIM HEALTHCARE OF WYOMING INC (1010 EAST 1ST STREET, SUITE A) SHARON'S HOME HEALTH CASPER (800 WERNER COURT SUITE 200) WYMEDCARE HOME HEALTH DEPARTMENT (1255 EAST C STREET) Airports and heliports located in Casper: Casper/Natrona County International Airport (CPR) Runways: , Commercial Ops: 1,316, Air Taxi Ops: 12,820, Itinerant Ops: 18,071, Local Ops: 8,910, Military Ops: 595)Harford Field Airport (HAD) Runways: , Local Ops: 100)American Falconry Airport (45WY) Runways: Mc Murry Heliport (50WY) True Heliport (WY47) Wyoming Medical Center Heliport (WY57) See details about Airports and heliports located in Casper, WY
College/University in Casper: Casper College Full-time enrollment: 2,770; Location: 125 College Dr; Public; Website: www.caspercollege.edu)
Other colleges/universities with over 2000 students near Casper:
Wyotech-Laramie (about 111 miles; Laramie, WY ; Full-time enrollment: 2,765)
University of Wyoming (about 113 miles; Laramie, WY ; FT enrollment: 10,810)
Sheridan College (about 137 miles; Sheridan, WY ; FT enrollment: 2,070)
Laramie County Community College (about 144 miles; Cheyenne, WY ; FT enrollment: 3,288)
Black Hills State University (about 169 miles; Spearfish, SD ; FT enrollment: 3,166)
Chadron State College (about 169 miles; Chadron, NE ; FT enrollment: 2,374)
Colorado State University-Fort Collins (about 169 miles; Fort Collins, CO ; FT enrollment: 25,099)
Public high schools in Casper: NATRONA COUNTY HIGH SCHOOL Students: 1,361, Location: 930 SOUTH ELM, Grades: 9-12)KELLY WALSH HIGH SCHOOL Students: 1,342, Location: 3500 EAST 12TH ST, Grades: 9-12)DEAN MORGAN JUNIOR HIGH SCHOOL Students: 865, Location: 1440 SOUTH ELM, Grades: 6-9)CENTENNIAL JUNIOR HIGH SCHOOL Students: 738, Location: 1421 WATERFORD, Grades: 6-9)C Y JUNIOR HIGH SCHOOL Students: 629, Location: 2900 CYCLONE DR, Grades: 6-9)ROOSEVELT HIGH SCHOOL Students: 188, Location: 140 EAST K ST, Grades: 7-12)CASPER CLASSICAL ACADEMY Students: 94, Location: 900 SOUTH BEVERLY, Grades: 6-9)WYOMING BEHAVIORAL INSTITUTE Students: 18, Location: 2521 EAST 15TH ST, Grades: 6-12)Private high schools in Casper: ST ANTHONY TRI-PARISH CATHOLIC SCHOOL Students: 301, Location: 1145 W 20TH ST, Grades: PK-9)
WYOMING BEHAVIORAL INSTITUTE Students: 42, Location: 2521 E 15TH ST, Grades: 2-12)Biggest public elementary/middle schools in Casper: VERDA JAMES ELEMENTARY Students: 450, Location: 701 CARRIAGE LANE, Grades: KG-5)PARADISE VALLEY ELEMENTARY Students: 410, Location: 22 MAGNOLIA, Grades: PK-6)FRONTIER MIDDLE SCHOOL Students: 396, Location: 900 SOUTH BEVERLY, Grades: 6-8)FT. CASPAR ACADEMY Students: 388, Location: 4100 W. 38TH ST, Grades: KG-6)CREST HILL ELEMENTARY Students: 327, Location: 4445 SOUTH POPLAR, Grades: KG-5)PARK ELEMENTARY Students: 302, Location: 140 WEST 9TH ST, Grades: KG-6)WILLARD ELEMENTARY Students: 300, Location: 129 NORTH ELK ST, Grades: PK-5)OREGON TRAIL ELEMENTARY Students: 299, Location: 6332 BUCKBOARD RD, Grades: KG-5)SAGEWOOD ELEMENTARY Students: 283, Location: 2451 SHATTUCK AVE, Grades: KG-5)SOUTHRIDGE ELEMENTARY Students: 279, Location: 1600 WEST 29TH ST, Grades: KG-5)Private elementary/middle schools in Casper:
See full list of schools located in Casper Library in Casper: NATRONA COUNTY LIBRARY SYSTEM Operating income: $2,103,975; Location: 307 EAST 2ND; 134,408 books ; 13,658 audio materials ; 12,387 video materials ; 5 local licensed databases ; 39 state licensed databases ; 1 other licensed databases ; 276 print serial subscriptions )
User-submitted facts and corrections:
2/3s of the world's pronghorn antelope live within a 200 mile radius of Casper,Wy.
2/3s of the world\'s pronghorn antelope live within a 200 mile radius of Casper,Wy.
Correction : K214DI (90.7 FM; CASPER, WY; Owner: EDUCATIONAL MEDIA FOUNDATION) is now part of the KLOVE radio network... a contemporay commercial-free Christan music station.
KCWY (Channel 13; CASPER, WY; Owner: SUNBELT COMMUNICATIONS 1500 Foremaster Lane Las Vegas, NV 89101, (702) 642-3333, (702) 657-3423 FAX
Notable locations in Casper: (A) , Casper Lions Camp (B) , Mountain Plaza (C) , Beverly Plaza (D) , Casper Mountain Fire Department (E) , Casper Fire - Emergency Medical Services Station 1 (F) , Natrona County Fire Protection District West Station (G) , Casper Fire - Emergency Medical Services Station 5 (H) , Casper Fire - Emergency Medical Services Station 3 (I) , Casper Fire - Emergency Medical Services Station 2 (J) , Casper Fire - Emergency Medical Services Station 6 (K) , Wyoming Medical Center Ambulance Service (L) . Display/hide their locations on the map
Shopping Centers: (1) , Sunrise Shopping Center (2) , Riverside Shopping Center (3) , North Casper Shopping Center (4) , Hilltop Shopping Center (5) , Eastridge Mall (6) . Display/hide their locations on the map
Main business address in Casper: (A) . Display/hide its location on the map
Cemetery: (1) . Display/hide its location on the map
Reservoirs: (A) , Soda Lake (B) , Katy Reservoir (C) , Carroll Number 1 Reservoir (D) . Display/hide their locations on the map
Creeks: (A) , Garden Creek (B) , Wolf Creek (C) . Display/hide their locations on the map
Parks in Casper include: (1) , Washington Park (2) , Westwood Park (3) , North Casper Park (4) , Eastdale Park (5) , Hospital Park (6) , Huber Park (7) . Display/hide their locations on the map
Tourist attractions: (1) , National Historic Trails Interpretive Center (Museums; 500 North Center Street) (2) , Veterns Memorial Museum (3740 Jourgensen Avenue) (3) , Tate Geological Museum (125 College Drive) (4) , Werner Wildlife Museum (405 East 15th Street) (5) , Best Spas (Recreation Areas; 2035 E Yellowstone Hwy) (6) , Old Town (Amusement & Theme Parks; 123 West E Street) (7) , Kids Works (Amusement & Theme Parks; 300 Landmark Drive Suite B) (8) , Hilltop Bingo (Amusement & Theme Parks; 2655 East 3rd Street) (9) . Display/hide their approximate locations on the map
Hotels: (1) , The Royal Inn (440 East A Street) (2) , Timberline Hospitalities (800 Werner Court Suite 220) (3) , Bel Air Motel (5400 West Yellowstone Highway Ofc) (4) , Sage & Sand Motel (901 West Yellowstone Highway) (5) , Yellowstone Motel (1610 East Yellowstone Highway) (6) , Econo Lodge (I-25 & N Poplar) (7) , Parkway Plaza Hotel & Convention Centre (123 West E Street) (8) , Virginian Hotel (830 East A Street) (9) . Display/hide their approximate locations on the map
Courts: (1) , Natrona County Government - M Huber- County Court Judge's- S Brown- County C (201 North David) (2) , Natrona County Government - Clerk Of District Court- Juror Assistance (200 North Center) (3) , Wyoming State Government - Judicial District- Fax (200 North Center) (4) , Natrona County Government - Clerk Of District Court (200 North Center) (5) , Natrona County Drug Court (254 North Center Street Suite 103) (6) , Wyoming State - Judicial District- District Court Judge David B Park 7 (200 North Center Street) (7) , United States Government - Courts- Bankruptcy Court (111 South Wolcott) (8) . Display/hide their approximate locations on the map
Birthplace of: Tom Coburn - Medical doctor, Casey Bramlet - 2005 NFL player (Cincinnati Bengals, born : Apr 2, 1981), Douglas M. Fraser - General, Jim J. Bullock - Actor, Kristen Heiss - Swimmer, Lynne Cheney - Novelist, M. Margaret McKeown - Judge, Marlan Scully - Physicist, Spencer Bohren - Blues guitarist, Tom Browning - Baseball player.
Natrona County has a predicted average indoor radon screening level greater than 4 pCi/L (pico curies per liter) - Highest Potential Drinking water stations with addresses in Casper and their reported violations in the past:
NORTH PLATTE WATER & SEWER DIS (Population served: 2,000, Purch surface water):
Past monitoring violations:
Monitoring and Reporting (DBP) - Between JAN-2010 and MAR-2010, Contaminant: Chlorine. Follow-up actions: St Compliance achieved (3 times from JUL-23-2010 to JUN-10-2011)
Population served: 750, Groundwater):
Past health violations:
MCL, Monthly (TCR) - In MAR-2009, Contaminant: Coliform. Follow-up actions: St Compliance achieved (APR-13-2009)
MCL, Monthly (TCR) - Between JUL-2006 and SEP-2006, Contaminant: Coliform
Population served: 300, Groundwater):
Past monitoring violations:
3 routine major monitoring violations
One minor monitoring violation
One regular monitoring violation
Population served: 300, Groundwater):
Past monitoring violations:
Monitoring, Source Water (GWR) - In JAN-01-2011, Contaminant: E. COLI. Follow-up actions: St Violation/Reminder Notice (JUN-10-2011)
Monitoring, Repeat Major (TCR) - Between OCT-2010 and DEC-2010, Contaminant: Coliform (TCR). Follow-up actions: St Compliance achieved (JAN-10-2011), St Violation/Reminder Notice (FEB-07-2011), St Public Notif received (FEB-15-2011)
One minor monitoring violation
Population served: 275, Groundwater):
Past monitoring violations:
4 routine major monitoring violations
One regular monitoring violation
Population served: 200, Purch surface water):
Past monitoring violations:
One routine major monitoring violation
Population served: 200, Groundwater):
Past monitoring violations:
2 routine major monitoring violations
One regular monitoring violation
Population served: 150, Purch surface water):
Past health violations:
MCL, Monthly (TCR) - In OCT-2012, Contaminant: Coliform. Follow-up actions: St Compliance achieved (NOV-30-2012)
MCL, Monthly (TCR) - In NOV-2009, Contaminant: Coliform. Follow-up actions: St Compliance achieved (JAN-20-2010)
Past monitoring violations:
Monitoring and Reporting (DBP) - Between JAN-2012 and MAR-2012, Contaminant: Chlorine. Follow-up actions: St Compliance achieved (JUL-26-2012)
Monitoring and Reporting (DBP) - Between JUL-2009 and SEP-2009, Contaminant: Chlorine. Follow-up actions: St Compliance achieved (JUL-23-2010)
Drinking water stations with addresses in Casper that have no violations reported:
CASPER, CITY OF (Population served: 55,500, Primary Water Source Type: Purch surface water)
VISTA WEST WATER COMPANY (Population served: 1,600, Primary Water Source Type: Purch surface water)
PIONEER WATER AND SEWER DISTRICT (Population served: 1,500, Primary Water Source Type: Purch surface water)
WY DOT - ORIN JUNCTION REST AREA (Population served: 750, Primary Water Source Type: Groundwater)
WY TRANS DEPT DWYER JCT. REST AREA (Population served: 650, Primary Water Source Type: Groundwater)
WY TRANS DEPT INDEPENDENCE RA (Population served: 350, Primary Water Source Type: Groundwater)
NATRONA COUNTY INT'L AIRPORT (Population served: 332, Primary Water Source Type: Purch surface water)
MHVC VISITORS CENTER (Population served: 277, Primary Water Source Type: Groundwater)
MHVC SIXTH CROSSING RANCH RV PARK (Population served: 200, Primary Water Source Type: Groundwater)
WY TRANS DEPT SHIRLEY RIM RA (Population served: 100, Primary Water Source Type: Groundwater)
Average household size: This city:
2.4 peopleWyoming:
2.4 people
Percentage of family households: This city:
62.5%Whole state:
64.6%
Percentage of households with unmarried partners: This city:
7.9%Whole state:
7.1%
Likely homosexual households (counted as self-reported same-sex unmarried-partner households)
Lesbian couples: 0.3% of all households Gay men: 0.2% of all households
People in group quarters in Casper in 2010:
483 people in nursing facilities/skilled-nursing facilities
320 people in college/university student housing
150 people in emergency and transitional shelters (with sleeping facilities) for people experiencing homelessness
53 people in residential treatment centers for adults
37 people in correctional facilities intended for juveniles
29 people in group homes intended for adults
25 people in other noninstitutional facilities
16 people in in-patient hospice facilities
12 people in group homes for juveniles (non-correctional)
People in group quarters in Casper in 2000:
470 people in nursing homes
331 people in college dormitories (includes college quarters off campus)
175 people in other noninstitutional group quarters
72 people in homes for the mentally retarded
66 people in other group homes
28 people in short-term care, detention or diagnostic centers for delinquent children
26 people in hospitals or wards for drug/alcohol abuse
26 people in homes or halfway houses for drug/alcohol abuse
10 people in homes for abused, dependent, and neglected children
8 people in other types of correctional institutions
8 people in hospitals/wards and hospices for chronically ill
8 people in hospices or homes for chronically ill
4 people in unknown juvenile institutions
2 people in religious group quarters
Arena or stadium:
Casper Events Center. Capacity: 9,700.
Banks with branches in Casper (2011 data):
Hilltop National Bank: Mountain Plaza Branch, Downtown Motorbank Branch, at 300 Country Club, Downtown Branch, Safeway Sales Branch. Info updated 2006/11/03: Bank assets: $572.2 mil, Deposits: $513.6 mil, local headquarters , positive income , 6 total offices , Holding Company: Midland Financial Corporation
Wells Fargo Bank, National Association: Casper East Branch, Casper Downtown Mb Branch, Casper West Branch, Casper Downtown Branch. Info updated 2011/04/05: Bank assets: $1,161,490.0 mil, Deposits: $905,653.0 mil, headquarters in Sioux Falls, SD, positive income , 6395 total offices , Holding Company: Wells Fargo & Company
First Interstate Bank: Casper Downtown Branch, Casper Albertson's Branch, Casper East Branch. Info updated 2009/10/09: Bank assets: $7,294.7 mil, Deposits: $5,827.2 mil, headquarters in Billings, MT, positive income , Commercial Lending Specialization, 76 total offices , Holding Company: First Interstate Bancsystem, Inc.
Jonah Bank of Wyoming: Jonah Bank Of Wyoming at 777 West First Street, branch established on 2006/07/31; Casper East Branch at 3730 Esat Second Street, branch established on 2009/10/19. Info updated 2006/08/14: Bank assets: $199.1 mil, Deposits: $180.5 mil, local headquarters , positive income , Commercial Lending Specialization, 3 total offices , Holding Company: Jonah Bankshares
Bank of the West: Casper Branch at 300 South Wolcott, branch established on 1960/10/15; Casper East Branch at 410 Se Wyoming Blvd, branch established on 1922/01/01. Info updated 2009/11/16: Bank assets: $62,408.3 mil, Deposits: $43,995.2 mil, headquarters in San Francisco, CA, positive income , 647 total offices , Holding Company: Bnp Paribas
ANB Bank: Casper Branch at 400 E 1st Street, branch established on 1999/07/15. Info updated 2012/01/03: Bank assets: $1,746.7 mil, Deposits: $1,394.3 mil, headquarters in Denver, CO, positive income , Mortgage Lending Specialization, 35 total offices , Holding Company: Sturm Financial Group, Inc.
U.S. Bank National Association: Casper Branch at 435 West First Street, branch established on 1960/09/26. Info updated 2012/01/30: Bank assets: $330,470.8 mil, Deposits: $236,091.5 mil, headquarters in Cincinnati, OH, positive income , 3121 total offices , Holding Company: U.S. Bancorp
Platte Valley Bank: Casper Branch at 3131 Sw Wyoming Blvd, branch established on 2009/03/31. Info updated 2008/04/09: Bank assets: $201.3 mil, Deposits: $163.8 mil, headquarters in Torrington, WY, positive income , Commercial Lending Specialization, 3 total offices , Holding Company: Platte Valley Financial Service Companies, Inc.
For population 15 years and over in Casper:
Never married: 29.7%Now married: 47.3%Separated: 0.7%Widowed: 5.7%Divorced: 16.7% For population 25 years and over in Casper:
High school or higher: 95.0%Bachelor's degree or higher: 29.6%Graduate or professional degree: 11.5%Unemployed: 4.9%Mean travel time to work (commute): 13.2 minutes
Education Gini index (Inequality in education) Here:
9.8Wyoming average:
10.2
Religion statistics for Casper, WY (based on Natrona County data)
Religion Adherents Congregations Evangelical Protestant 9,306 46 Catholic 7,824 3 Mainline Protestant 5,266 16 Other 5,026 13 Orthodox 235 1 Black Protestant 123 1 None 47,670 -
Source: Clifford Grammich, Kirk Hadaway, Richard Houseal, Dale E.Jones, Alexei Krindatch, Richie Stanley and Richard H.Taylor. 2012. 2010 U.S.Religion Census: Religious Congregations & Membership Study. Association of Statisticians of American Religious Bodies. Jones, Dale E., et al. 2002. Congregations and Membership in the United States 2000. Nashville, TN: Glenmary Research Center. Graphs represent county-level data
Food Environment Statistics: Number of grocery stores : 9Natrona County :
1.25 / 10,000 pop.Wyoming :
2.10 / 10,000 pop.
Number of supercenters and club stores : 2Natrona County :
0.28 / 10,000 pop.Wyoming :
0.27 / 10,000 pop.
Number of convenience stores (no gas) : 2Here :
0.28 / 10,000 pop.State :
0.65 / 10,000 pop.
Number of convenience stores (with gas) : 31Here :
4.32 / 10,000 pop.Wyoming :
5.36 / 10,000 pop.
Number of full-service restaurants : 55Natrona County :
7.66 / 10,000 pop.State :
10.08 / 10,000 pop.
Adult diabetes rate : Natrona County :
7.6%State :
7.1%
Adult obesity rate : Natrona County :
25.0%Wyoming :
24.4%
Health and Nutrition:
Average overall health of teeth and gums : This city:
47.3%Wyoming:
46.6%
People feeling badly about themselves : People not drinking alcohol at all : Average hours sleeping at night : Overweight people : Casper:
35.1%Wyoming:
34.7%
General health condition : Average condition of hearing : This city:
78.5%Wyoming:
78.4%
More about Health and Nutrition of Casper, WY Residents
Local government employment and payroll (March 2022)
Function
Full-time employees
Monthly full-time payroll
Average yearly full-time wage
Part-time employees
Monthly part-time payroll
Police Protection - Officers
106 $662,523 $75,003 0 $0 Firefighters
72 $408,929 $68,155 0 $0 Solid Waste Management
49 $228,336 $55,919 11 $15,197 Police - Other
38 $170,562 $53,862 1 $3,132 Water Supply
38 $194,604 $61,454 1 $1,544 Parks and Recreation
34 $165,221 $58,313 94 $66,775 Streets and Highways
25 $147,456 $70,779 0 $0 Financial Administration
25 $132,249 $63,480 1 $1,499 Sewerage
22 $125,227 $68,306 0 $0 Other Government Administration
22 $136,445 $74,425 10 $7,603 Other and Unallocable
21 $102,860 $58,777 1 $1,294 Judicial and Legal
10 $61,696 $74,035 2 $3,546 Health
8 $32,917 $49,376 0 $0 Fire - Other
3 $9,774 $39,096 0 $0
Totals for Government
473 $2,578,798 $65,424 121 $100,591
Casper government finances - Expenditure in 2021 (per resident):
Construction - General - Other: $10,919,000 ($186.51)
Sewerage: $3,321,000 ($56.73)Water Utilities: $2,754,000 ($47.04)Solid Waste Management: $926,000 ($15.82)Parks and Recreation: $153,000 ($2.61)Current Operations - Sewerage: $14,027,000 ($239.60)
Police Protection: $13,855,000 ($236.66)Water Utilities: $13,758,000 ($235.01)Solid Waste Management: $10,572,000 ($180.59)Parks and Recreation: $10,421,000 ($178.01)Local Fire Protection: $9,462,000 ($161.62)General - Other: $8,563,000 ($146.27)Central Staff Services: $3,457,000 ($59.05)Regular Highways: $3,275,000 ($55.94)General Public Buildings: $2,377,000 ($40.60)Public Welfare - Other: $2,188,000 ($37.37)Financial Administration: $2,123,000 ($36.26)Health - Other: $1,540,000 ($26.31)Judicial and Legal Services: $1,290,000 ($22.04)Protective Inspection and Regulation - Other: $953,000 ($16.28)Housing and Community Development: $467,000 ($7.98)Miscellaneous Commercial Activities - Other: $361,000 ($6.17)Parking Facilities: $84,000 ($1.43)General - Interest on Debt: $277,000 ($4.73)
Other Capital Outlay - General - Other: $3,302,000 ($56.40)
Solid Waste Management: $1,440,000 ($24.60)Sewerage: $528,000 ($9.02)Water Utilities: $448,000 ($7.65)Central Staff Services: $359,000 ($6.13)Parks and Recreation: $260,000 ($4.44)Public Welfare - Other: $172,000 ($2.94)Health - Other: $137,000 ($2.34)Housing and Community Development: $104,000 ($1.78)Police Protection: $67,000 ($1.14)Regular Highways: $64,000 ($1.09)Local Fire Protection: $20,000 ($0.34)Financial Administration: $11,000 ($0.19)Protective Inspection and Regulation - Other: $8,000 ($0.14)Judicial and Legal Services: $4,000 ($0.07)Water Utilities - Interest on Debt: $483,000 ($8.25)
Casper government finances - Revenue in 2021 (per resident):
Charges - Solid Waste Management: $14,659,000 ($250.40)
Sewerage: $7,243,000 ($123.72)Parks and Recreation: $5,815,000 ($99.33)Housing and Community Development: $554,000 ($9.46)Other: $378,000 ($6.46)Miscellaneous Commercial Activities: $205,000 ($3.50)Federal Intergovernmental - Health and Hospitals: $14,775,000 ($252.38)
Other: $1,156,000 ($19.75)Housing and Community Development: $760,000 ($12.98)Local Intergovernmental - General Local Government Support: $15,314,000 ($261.59)
Other: $459,000 ($7.84)Miscellaneous - General Revenue - Other: $23,071,000 ($394.09)
Interest Earnings: $1,739,000 ($29.70)Fines and Forfeits: $1,246,000 ($21.28)Sale of Property: $88,000 ($1.50)Revenue - Water Utilities: $14,239,000 ($243.22)
State Intergovernmental - General Local Government Support: $22,712,000 ($387.95)
Other: $5,585,000 ($95.40)Highways: $1,120,000 ($19.13)Water Utilities: $712,000 ($12.16)Sewerage: $101,000 ($1.73)Tax - Property: $6,170,000 ($105.39)
Public Utilities Sales: $3,919,000 ($66.94)Occupation and Business License - Other: $1,026,000 ($17.53)Other License: $436,000 ($7.45)Other: $181,000 ($3.09)
Casper government finances - Debt in 2021 (per resident):
Long Term Debt - Beginning Outstanding - Unspecified Public Purpose: $18,989,000 ($324.36)
Outstanding Unspecified Public Purpose: $18,656,000 ($318.67)Retired Unspecified Public Purpose: $2,155,000 ($36.81)Issue, Unspecified Public Purpose: $1,821,000 ($31.11)
Casper government finances - Cash and Securities in 2021 (per resident):
Other Funds - Cash and Securities: $176,689,000 ($3018.11)
Businesses in Casper, WY
Name Count Name Count
Ace Hardware 1 Little Caesars Pizza 1 Aeropostale 1 Long John Silver's 1 Albertsons 2 Macy's 1 American Eagle Outfitters 1 Marriott 1 Arby's 2 MasterBrand Cabinets 14 AutoZone 2 Maurices 1 Bath & Body Works 1 McDonald's 2 Bed Bath & Beyond 1 Menards 1 Best Western 1 Motel 6 1 Big O Tires 1 Motherhood Maternity 1 Blockbuster 1 New Balance 1 Budget Car Rental 1 Nike 6 Burger King 3 OfficeMax 1 Chevrolet 1 On The Border 1 Cold Stone Creamery 1 Payless 1 Curves 1 Pizza Hut 3 Dairy Queen 2 Quality 1 Days Inn 1 Quiznos 1 Deb 1 RadioShack 2 Decora Cabinetry 1 Ramada 1 Dressbarn 1 Red Lobster 1 Famous Footwear 1 Safeway 2 FedEx 18 Sam's Club 1 Foot Locker 1 Sears 3 Ford 1 Staples 1 GameStop 3 Starbucks 3 H&R Block 2 Subaru 1 Hardee's 2 Super 8 1 Haworth 1 Taco Bell 2 Hobby Lobby 1 Target 1 Holiday Inn 2 The Room Place 1 Home Depot 1 Toyota 1 Honda 1 U-Haul 5 Hot Topic 1 UPS 19 JCPenney 1 Vans 3 Jones New York 2 Verizon Wireless 2 Journeys 1 Village Inn 1 KFC 1 Volkswagen 1 Kmart 1 Vons 2 Kroger 12 Walmart 2 La Quinta 1 Wendy's 2 La-Z-Boy 2 YMCA 1 Lane Furniture 2
Strongest AM radio stations in Casper:
KTWO (1030 AM; 50 kW; CASPER, WY; Owner: CITICASTERS LICENSES, L.P.)
KUYO (830 AM; daytime; 25 kW; EVANSVILLE, WY; Owner: WYOMING CHRISTIAN BROADCASTING COMPANY)
KVOC (1230 AM; 1 kW; CASPER, WY; Owner: MOUNT RUSHMORE BROADCASTING, INC.)
KKTL (1400 AM; 1 kW; CASPER, WY; Owner: CITICASTERS LICENSES, L.P.)
KLTT (670 AM; 50 kW; COMMERCE CITY, CO; Owner: KLZ RADIO, INC.)
KKZN (760 AM; 50 kW; THORNTON, CO; Owner: JACOR BROADCASTING OF COLORADO, INC.)
KIMB (1260 AM; 50 kW; KIMBALL, NE; Owner: G & L INVESTMENTS, LLC)
KOA (850 AM; 50 kW; DENVER, CO; Owner: JACOR BROADCASTING OF COLORADO, INC.)
KBHB (810 AM; 25 kW; STURGIS, SD; Owner: MONTEREY LICENSES, LLC)
KMXA (1090 AM; 50 kW; AURORA, CO; Owner: ENTRAVISION HOLDINGS, LLC)
KLMO (1060 AM; 30 kW; LONGMONT, CO; Owner: PILGRIM COMMUNICATIONS, INC.)
KALL (700 AM; 50 kW; NORTH SALT LAKE CITY, UT; Owner: CITICASTERS LICENSES, L.P.)
KKHI (1210 AM; 10 kW; LARAMIE, WY; Owner: LARAMIE MOUNTAIN BROADCASTING, L.L.C.)
Strongest FM radio stations in Casper:
KMGW (96.7 FM; CASPER, WY; Owner: CLEAR CHANNEL BROADCASTING LICENSES, INC.)
KRVK (107.9 FM; MIDWEST, WY; Owner: CITICASTERS LICENSES, INC.)
K219CA (91.7 FM; CASPER, WY; Owner: FAMILY STATIONS, INC.)
KWYY (95.5 FM; CASPER, WY; Owner: CLEAR CHANNEL BROADCASTING LICENSES, INC.)
KASS (106.9 FM; CASPER, WY; Owner: MOUNT RUSHMORE BROADCASTING, INC)
KQLT (103.7 FM; CASPER, WY; Owner: MOUNT RUSHMORE BROADCASTING INC.)
KCSP-FM (90.3 FM; CASPER, WY; Owner: WESTERN INSPIRATIONAL B/CTERS, INC.)
KTRS-FM (104.7 FM; CASPER, WY; Owner: CLEAR CHANNEL BROADCASTING LICENSES, INC.)
KHOC (102.5 FM; CASPER, WY; Owner: MOUNT RUSHMORE BROADCASTING, INC)
KMLD (94.5 FM; CASPER, WY; Owner: MT. RUSHMORE BROADCASTING, INC.)
KUWC (91.3 FM; CASPER, WY; Owner: UNIVERSITY OF WYOMING)
K209CS (89.7 FM; CASPER, WY; Owner: PENSACOLA CHRISTIAN COLLEGE, INC.)
K204AD (88.7 FM; CASPER, ETC., WY; Owner: CASPER COMMUNITY COLLEGE DISTRICT)
K214DI (90.7 FM; CASPER, WY; Owner: EDUCATIONAL MEDIA FOUNDATION)
TV broadcast stations around Casper:
K47HQ (Channel 47; CASPER, WY; Owner: MANNA MEDIA CORPORATION)
KTWO-TV (Channel 2; CASPER, WY; Owner: WYOMING CHANNEL 2, INC.)
KFNB (Channel 20; CASPER, WY; Owner: WYOMEDIA CORPORATION)
K26ES (Channel 26; CASPER, WY; Owner: WYOMEDIA CORP.)
K06KH (Channel 6; CASPER, WY; Owner: CASPER COMMUNITY COLLEGE DISTRICT)
KGWC-TV (Channel 14; CASPER, WY; Owner: CHELSEY BROADCASTING COMPANY OF CASPER, LLC)
KCWY (Channel 13; CASPER, WY; Owner: SWEETWATER BROADCASTING COMPANY)
Medal of Honor Recipients
Medal of Honor Recipient born in Casper: William E. Adams.
National Bridge Inventory (NBI) Statistics 62 Number of bridges860ft / 262m Total length $1,018,000 Total costs535,678 Total average daily traffic55,537 Total average daily truck traffic
New bridges - historical statistics
2 1940-1949 18 1950-1959 17 1960-1969 5 1970-1979 5 1980-1989 1 1990-1999 8 2000-2009 6 2010-2019
See full National Bridge Inventory statistics for Casper, WY
Home Mortgage Disclosure Act Aggregated Statistics For Year 2009(Based on 5 full and 11 partial tracts) A) FHA, FSA/RHS & VA B) Conventional C) Refinancings D) Home Improvement Loans E) Loans on Dwellings For 5+ Families F) Non-occupant Loans on G) Loans On Manufactured Number Average Value Number Average Value Number Average Value Number Average Value Number Average Value Number Average Value Number Average Value
LOANS ORIGINATED 372 $164,911 286 $143,414 1,059 $155,005 121 $96,992 6 $458,943 118 $109,888 15 $43,447 APPLICATIONS APPROVED, NOT ACCEPTED 13 $159,069 14 $144,029 89 $176,019 10 $66,784 0 $0 3 $99,740 4 $52,030 APPLICATIONS DENIED 18 $170,491 30 $104,303 318 $166,625 42 $57,415 0 $0 14 $113,208 17 $61,458 APPLICATIONS WITHDRAWN 22 $143,804 13 $155,709 216 $165,921 20 $107,912 0 $0 13 $118,222 2 $131,390 FILES CLOSED FOR INCOMPLETENESS 2 $150,820 1 $48,490 33 $157,247 1 $190,000 0 $0 0 $0 2 $107,790
Aggregated Statistics For Year 2008(Based on 5 full and 11 partial tracts) A) FHA, FSA/RHS & VA B) Conventional C) Refinancings D) Home Improvement Loans E) Loans on Dwellings For 5+ Families F) Non-occupant Loans on G) Loans On Manufactured Number Average Value Number Average Value Number Average Value Number Average Value Number Average Value Number Average Value Number Average Value
LOANS ORIGINATED 293 $164,529 536 $137,121 680 $149,207 151 $71,583 3 $3,282,573 133 $116,395 24 $44,880 APPLICATIONS APPROVED, NOT ACCEPTED 9 $147,222 53 $182,981 101 $155,199 18 $62,799 0 $0 12 $126,328 8 $43,840 APPLICATIONS DENIED 36 $160,825 101 $116,428 363 $148,171 140 $67,635 0 $0 30 $108,845 40 $46,062 APPLICATIONS WITHDRAWN 20 $148,100 39 $173,763 145 $160,496 33 $109,652 1 $490,940 10 $84,009 2 $48,185 FILES CLOSED FOR INCOMPLETENESS 2 $155,565 0 $0 27 $168,784 4 $136,320 0 $0 1 $55,030 0 $0
Aggregated Statistics For Year 2007(Based on 5 full and 11 partial tracts) A) FHA, FSA/RHS & VA B) Conventional C) Refinancings D) Home Improvement Loans E) Loans on Dwellings For 5+ Families F) Non-occupant Loans on G) Loans On Manufactured Number Average Value Number Average Value Number Average Value Number Average Value Number Average Value Number Average Value Number Average Value
LOANS ORIGINATED 103 $145,483 1,063 $138,036 723 $126,129 233 $57,241 8 $1,512,755 150 $105,654 42 $34,568 APPLICATIONS APPROVED, NOT ACCEPTED 4 $142,388 98 $127,348 124 $136,476 43 $45,853 0 $0 20 $101,351 12 $56,629 APPLICATIONS DENIED 12 $144,152 204 $117,063 386 $136,296 179 $69,375 0 $0 38 $124,790 59 $42,709 APPLICATIONS WITHDRAWN 4 $95,685 100 $129,287 221 $146,014 46 $78,800 0 $0 18 $108,807 5 $69,400 FILES CLOSED FOR INCOMPLETENESS 0 $0 20 $136,557 71 $131,039 6 $88,450 0 $0 2 $122,135 0 $0
Aggregated Statistics For Year 2006(Based on 5 full and 11 partial tracts) A) FHA, FSA/RHS & VA B) Conventional C) Refinancings D) Home Improvement Loans E) Loans on Dwellings For 5+ Families F) Non-occupant Loans on G) Loans On Manufactured Number Average Value Number Average Value Number Average Value Number Average Value Number Average Value Number Average Value Number Average Value
LOANS ORIGINATED 89 $140,996 1,239 $108,608 687 $111,249 179 $55,146 1 $44,350 157 $91,778 12 $38,099 APPLICATIONS APPROVED, NOT ACCEPTED 4 $111,570 92 $103,120 87 $108,725 40 $42,857 1 $742,130 13 $76,616 6 $79,862 APPLICATIONS DENIED 8 $118,459 195 $95,330 366 $103,782 156 $45,834 0 $0 27 $83,234 25 $46,332 APPLICATIONS WITHDRAWN 6 $114,237 110 $108,252 232 $110,954 41 $78,319 0 $0 13 $102,148 3 $108,623 FILES CLOSED FOR INCOMPLETENESS 0 $0 8 $141,675 64 $128,950 4 $45,240 0 $0 1 $110,900 0 $0
Aggregated Statistics For Year 2005(Based on 5 full and 11 partial tracts) A) FHA, FSA/RHS & VA B) Conventional C) Refinancings D) Home Improvement Loans E) Loans on Dwellings For 5+ Families F) Non-occupant Loans on G) Loans On Manufactured Number Average Value Number Average Value Number Average Value Number Average Value Number Average Value Number Average Value Number Average Value
LOANS ORIGINATED 77 $122,467 1,113 $98,358 795 $103,545 139 $45,444 1 $571,800 161 $87,568 22 $44,089 APPLICATIONS APPROVED, NOT ACCEPTED 10 $125,468 117 $96,760 107 $90,342 48 $32,598 0 $0 21 $83,397 6 $37,927 APPLICATIONS DENIED 5 $103,674 215 $76,247 507 $101,462 97 $33,227 1 $608,710 45 $83,112 37 $35,489 APPLICATIONS WITHDRAWN 6 $138,648 112 $99,988 287 $109,945 29 $92,267 0 $0 24 $98,194 4 $76,528 FILES CLOSED FOR INCOMPLETENESS 0 $0 10 $90,297 54 $111,591 1 $85,180 0 $0 6 $96,843 0 $0
Aggregated Statistics For Year 2004(Based on 5 full and 11 partial tracts) A) FHA, FSA/RHS & VA B) Conventional C) Refinancings D) Home Improvement Loans E) Loans on Dwellings For 5+ Families F) Non-occupant Loans on G) Loans On Manufactured Number Average Value Number Average Value Number Average Value Number Average Value Number Average Value Number Average Value Number Average Value
LOANS ORIGINATED 96 $102,756 995 $91,214 874 $94,470 140 $35,438 2 $448,500 166 $73,527 20 $41,454 APPLICATIONS APPROVED, NOT ACCEPTED 1 $110,710 82 $90,897 154 $96,634 25 $26,861 0 $0 16 $65,352 5 $40,718 APPLICATIONS DENIED 8 $111,240 153 $78,896 474 $87,742 86 $32,967 0 $0 26 $73,655 35 $53,020 APPLICATIONS WITHDRAWN 6 $112,972 71 $99,080 314 $100,848 13 $49,030 0 $0 17 $96,762 6 $88,775 FILES CLOSED FOR INCOMPLETENESS 1 $77,730 11 $113,168 60 $101,582 3 $55,097 0 $0 1 $149,240 0 $0
Aggregated Statistics For Year 2003(Based on 5 full and 11 partial tracts) A) FHA, FSA/RHS & VA B) Conventional C) Refinancings D) Home Improvement Loans E) Loans on Dwellings For 5+ Families F) Non-occupant Loans on Number Average Value Number Average Value Number Average Value Number Average Value Number Average Value Number Average Value
LOANS ORIGINATED 123 $94,383 727 $89,696 1,575 $88,537 91 $30,028 4 $370,795 177 $68,642 APPLICATIONS APPROVED, NOT ACCEPTED 9 $103,563 49 $90,991 147 $83,243 20 $38,314 0 $0 11 $68,981 APPLICATIONS DENIED 7 $117,437 84 $64,797 428 $78,173 61 $21,456 2 $508,515 32 $64,342 APPLICATIONS WITHDRAWN 8 $92,879 44 $100,204 408 $87,844 3 $28,073 1 $564,000 14 $68,451 FILES CLOSED FOR INCOMPLETENESS 1 $79,640 6 $129,857 35 $75,588 0 $0 0 $0 6 $67,903
Aggregated Statistics For Year 2002(Based on 3 full and 6 partial tracts) A) FHA, FSA/RHS & VA B) Conventional C) Refinancings D) Home Improvement Loans E) Loans on Dwellings For 5+ Families F) Non-occupant Loans on Number Average Value Number Average Value Number Average Value Number Average Value Number Average Value Number Average Value
LOANS ORIGINATED 116 $80,591 339 $69,165 560 $75,917 56 $17,929 1 $94,000 97 $58,728 APPLICATIONS APPROVED, NOT ACCEPTED 2 $61,295 37 $66,170 64 $60,944 12 $31,525 0 $0 3 $44,333 APPLICATIONS DENIED 2 $94,460 71 $50,410 250 $63,127 35 $14,937 0 $0 11 $44,557 APPLICATIONS WITHDRAWN 4 $82,302 16 $84,449 232 $75,415 9 $22,056 0 $0 3 $49,943 FILES CLOSED FOR INCOMPLETENESS 0 $0 1 $102,340 24 $82,493 3 $15,317 0 $0 1 $50,710
Aggregated Statistics For Year 2001(Based on 3 full and 6 partial tracts) A) FHA, FSA/RHS & VA B) Conventional C) Refinancings D) Home Improvement Loans E) Loans on Dwellings For 5+ Families F) Non-occupant Loans on Number Average Value Number Average Value Number Average Value Number Average Value Number Average Value Number Average Value
LOANS ORIGINATED 169 $76,589 322 $60,334 465 $67,115 39 $19,759 3 $89,403 102 $56,239 APPLICATIONS APPROVED, NOT ACCEPTED 7 $76,956 41 $58,619 43 $52,693 11 $26,926 0 $0 6 $41,180 APPLICATIONS DENIED 5 $75,922 84 $52,376 259 $55,544 36 $14,059 0 $0 11 $51,515 APPLICATIONS WITHDRAWN 4 $64,018 25 $89,772 212 $70,052 10 $17,796 0 $0 5 $49,432 FILES CLOSED FOR INCOMPLETENESS 1 $113,750 2 $36,280 34 $77,562 2 $16,500 0 $0 1 $39,730
Aggregated Statistics For Year 2000(Based on 3 full and 6 partial tracts) A) FHA, FSA/RHS & VA B) Conventional C) Refinancings D) Home Improvement Loans E) Loans on Dwellings For 5+ Families F) Non-occupant Loans on Number Average Value Number Average Value Number Average Value Number Average Value Number Average Value Number Average Value
LOANS ORIGINATED 139 $67,052 301 $55,700 173 $54,359 56 $13,115 2 $268,000 50 $56,467 APPLICATIONS APPROVED, NOT ACCEPTED 9 $66,674 64 $65,309 43 $50,986 20 $17,202 0 $0 5 $48,792 APPLICATIONS DENIED 23 $54,713 247 $45,805 222 $44,484 55 $14,930 0 $0 14 $45,344 APPLICATIONS WITHDRAWN 7 $65,279 26 $58,454 95 $50,366 7 $22,394 0 $0 7 $52,884 FILES CLOSED FOR INCOMPLETENESS 0 $0 3 $73,037 50 $62,840 1 $11,840 0 $0 7 $45,470
Aggregated Statistics For Year 1999(Based on 4 full and 11 partial tracts) A) FHA, FSA/RHS & VA B) Conventional C) Refinancings D) Home Improvement Loans E) Loans on Dwellings For 5+ Families F) Non-occupant Loans on Number Average Value Number Average Value Number Average Value Number Average Value Number Average Value Number Average Value
LOANS ORIGINATED 281 $69,827 506 $66,796 541 $58,288 139 $14,976 5 $181,784 95 $48,511 APPLICATIONS APPROVED, NOT ACCEPTED 6 $54,457 122 $60,648 82 $50,725 50 $17,114 0 $0 8 $49,934 APPLICATIONS DENIED 16 $73,482 519 $49,482 234 $52,199 84 $14,460 0 $0 29 $50,682 APPLICATIONS WITHDRAWN 19 $59,646 82 $61,910 161 $53,165 14 $21,331 0 $0 12 $44,637 FILES CLOSED FOR INCOMPLETENESS 1 $44,820 6 $59,767 94 $62,481 1 $60,180 0 $0 7 $82,213
Detailed mortgage data for all 14 tracts in Casper, WY
Private Mortgage Insurance Companies Aggregated Statistics For Year 2009(Based on 5 full and 11 partial tracts) A) Conventional B) Refinancings C) Non-occupant Loans on Number Average Value Number Average Value Number Average Value
LOANS ORIGINATED 34 $192,191 47 $203,954 1 $253,100 APPLICATIONS APPROVED, NOT ACCEPTED 5 $185,334 9 $190,279 1 $158,870 APPLICATIONS DENIED 4 $178,792 7 $166,377 0 $0 APPLICATIONS WITHDRAWN 1 $97,140 2 $209,530 0 $0 FILES CLOSED FOR INCOMPLETENESS 2 $195,175 1 $98,880 0 $0
Aggregated Statistics For Year 2008(Based on 5 full and 11 partial tracts) A) Conventional B) Refinancings C) Non-occupant Loans on Number Average Value Number Average Value Number Average Value
LOANS ORIGINATED 215 $179,422 91 $184,378 21 $145,016 APPLICATIONS APPROVED, NOT ACCEPTED 49 $183,182 26 $181,130 7 $104,941 APPLICATIONS DENIED 8 $150,081 6 $235,200 2 $155,580 APPLICATIONS WITHDRAWN 7 $189,050 1 $89,160 0 $0 FILES CLOSED FOR INCOMPLETENESS 7 $152,956 1 $149,000 1 $213,170
Aggregated Statistics For Year 2007(Based on 5 full and 11 partial tracts) A) Conventional B) Refinancings C) Non-occupant Loans on D) Loans On Manufactured Number Average Value Number Average Value Number Average Value Number Average Value
LOANS ORIGINATED 463 $165,646 109 $172,194 25 $130,753 1 $79,800 APPLICATIONS APPROVED, NOT ACCEPTED 41 $137,530 13 $158,396 0 $0 0 $0 APPLICATIONS DENIED 5 $130,246 0 $0 0 $0 0 $0 APPLICATIONS WITHDRAWN 10 $167,954 1 $120,000 1 $165,410 0 $0 FILES CLOSED FOR INCOMPLETENESS 2 $170,940 1 $121,600 0 $0 0 $0
Aggregated Statistics For Year 2006(Based on 5 full and 11 partial tracts) A) Conventional B) Refinancings C) Non-occupant Loans on D) Loans On Manufactured Number Average Value Number Average Value Number Average Value Number Average Value
LOANS ORIGINATED 301 $140,792 68 $156,242 16 $98,326 0 $0 APPLICATIONS APPROVED, NOT ACCEPTED 19 $141,071 10 $146,173 0 $0 0 $0 APPLICATIONS DENIED 3 $125,043 1 $101,760 0 $0 0 $0 APPLICATIONS WITHDRAWN 5 $136,632 7 $116,560 0 $0 1 $120,000 FILES CLOSED FOR INCOMPLETENESS 0 $0 0 $0 0 $0 0 $0
Aggregated Statistics For Year 2005(Based on 5 full and 11 partial tracts) A) Conventional B) Refinancings C) Non-occupant Loans on Number Average Value Number Average Value Number Average Value
LOANS ORIGINATED 294 $123,736 80 $123,516 18 $91,589 APPLICATIONS APPROVED, NOT ACCEPTED 12 $136,261 19 $118,579 2 $125,790 APPLICATIONS DENIED 3 $133,680 0 $0 0 $0 APPLICATIONS WITHDRAWN 2 $131,240 4 $145,278 1 $87,210 FILES CLOSED FOR INCOMPLETENESS 1 $224,000 0 $0 0 $0
Aggregated Statistics For Year 2004(Based on 5 full and 11 partial tracts) A) Conventional B) Refinancings C) Non-occupant Loans on Number Average Value Number Average Value Number Average Value
LOANS ORIGINATED 332 $111,802 87 $104,591 32 $83,575 APPLICATIONS APPROVED, NOT ACCEPTED 18 $99,221 16 $106,933 4 $56,558 APPLICATIONS DENIED 2 $73,690 1 $86,340 1 $47,460 APPLICATIONS WITHDRAWN 3 $90,393 4 $95,652 1 $41,000 FILES CLOSED FOR INCOMPLETENESS 1 $113,470 0 $0 0 $0
Aggregated Statistics For Year 2003(Based on 5 full and 11 partial tracts) A) Conventional B) Refinancings C) Non-occupant Loans on Number Average Value Number Average Value Number Average Value
LOANS ORIGINATED 298 $99,418 225 $104,788 17 $72,862 APPLICATIONS APPROVED, NOT ACCEPTED 13 $119,173 21 $108,009 1 $110,630 APPLICATIONS DENIED 2 $78,640 1 $113,000 0 $0 APPLICATIONS WITHDRAWN 4 $104,195 6 $107,455 1 $79,430 FILES CLOSED FOR INCOMPLETENESS 0 $0 1 $83,660 0 $0
Aggregated Statistics For Year 2002(Based on 3 full and 6 partial tracts) A) Conventional B) Refinancings C) Non-occupant Loans on Number Average Value Number Average Value Number Average Value
LOANS ORIGINATED 144 $83,038 89 $90,649 15 $65,265 APPLICATIONS APPROVED, NOT ACCEPTED 14 $79,409 9 $88,468 1 $32,010 APPLICATIONS DENIED 1 $80,000 2 $143,975 0 $0 APPLICATIONS WITHDRAWN 0 $0 4 $68,082 1 $51,870 FILES CLOSED FOR INCOMPLETENESS 0 $0 0 $0 0 $0
Aggregated Statistics For Year 2001(Based on 3 full and 6 partial tracts) A) Conventional B) Refinancings C) Non-occupant Loans on Number Average Value Number Average Value Number Average Value
LOANS ORIGINATED 140 $77,815 70 $84,983 18 $69,836 APPLICATIONS APPROVED, NOT ACCEPTED 12 $91,572 11 $75,796 6 $65,045 APPLICATIONS DENIED 3 $60,540 2 $84,680 1 $27,510 APPLICATIONS WITHDRAWN 1 $74,150 0 $0 1 $61,600 FILES CLOSED FOR INCOMPLETENESS 0 $0 0 $0 0 $0
Aggregated Statistics For Year 2000(Based on 3 full and 6 partial tracts) A) Conventional B) Refinancings C) Non-occupant Loans on Number Average Value Number Average Value Number Average Value
LOANS ORIGINATED 111 $77,587 17 $63,362 11 $59,511 APPLICATIONS APPROVED, NOT ACCEPTED 7 $72,104 1 $76,760 1 $83,200 APPLICATIONS DENIED 1 $83,540 0 $0 1 $54,000 APPLICATIONS WITHDRAWN 1 $84,970 0 $0 0 $0 FILES CLOSED FOR INCOMPLETENESS 0 $0 0 $0 0 $0
Aggregated Statistics For Year 1999(Based on 4 full and 11 partial tracts) A) Conventional B) Refinancings C) Non-occupant Loans on Number Average Value Number Average Value Number Average Value
LOANS ORIGINATED 145 $83,224 48 $73,817 12 $46,923 APPLICATIONS APPROVED, NOT ACCEPTED 2 $54,500 6 $80,735 1 $34,000 APPLICATIONS DENIED 2 $60,580 1 $63,030 0 $0 APPLICATIONS WITHDRAWN 3 $51,077 2 $99,770 2 $42,825 FILES CLOSED FOR INCOMPLETENESS 0 $0 0 $0 0 $0
Fire-safe hotels and motels in Casper, Wyoming:
Quality Inn & Suites, 821 N Poplar, Casper, Wyoming 82601 Phone: (307) 266-2400, Fax: (307) 266-1146
Days Inn, 301 East ""e"" St, Casper, Wyoming 82601 Phone: (307) 234-1159, Fax: (307) 265-0829
Hampton Inn, 400 W F St, Casper, Wyoming 82601 Phone: (307) 235-6668, Fax: (307) 235-2027
Ramada Plaza Hotel Casper, 300 W F St, Casper, Wyoming 82601 Phone: (307) 235-2531, Fax: (307) 266-0160
Hearthside Of Casper, 111 South Wilson St, Casper, Wyoming 82602 Phone: (307) 232-1110
Holiday Inn Express, 4250 Legion Ln, Casper, Wyoming 82601 Phone: (307) 237-4200, Fax: (307) 237-4202
Best Western Ramkota Casper, 800 N Poplar St, Casper, Wyoming 82601 Phone: (307) 266-6000, Fax: (307) 473-1010
Courtyard By Marriott Casper, 4260 Hospitality Ln, Casper, Wyoming 82609 Phone: (307) 473-2600, Fax: (307) 473-2601
6 other hotels and motels
All 14 fire-safe hotels and motels in Casper, Wyoming
Most common first names in Casper, WY among deceased individuals Name Count Lived (average)
John 337 73.6 years William 314 74.4 years Mary 284 79.8 years Robert 254 70.7 years James 251 71.9 years Charles 192 73.2 years George 174 76.6 years Helen 143 80.1 years Margaret 141 79.8 years Donald 121 69.5 years
Most common last names in Casper, WY among deceased individuals Last name Count Lived (average)
Smith 137 74.1 years Johnson 108 72.8 years Miller 82 76.9 years Jones 68 77.1 years Brown 60 74.0 years Anderson 60 75.5 years Wilson 59 76.5 years Williams 58 74.2 years Davis 56 77.2 years Moore 51 77.4 years
Casper compared to Wyoming state average:
Unemployed percentage significantly below state average. Black race population percentage below state average. Median age below state average. Length of stay since moving in significantly above state average.
#1 on the list of "Top 101 cities with the largest wind speed differences during a year (population 50,000+)"
#2 on the list of "Top 101 cities with the smallest percentage of high school students in private schools (3,000+ students)"
#7 on the list of "Top 101 cities with largest percentage of males in industries: mining, quarrying, and oil and gas extraction (population 50,000+)"
#9 on the list of "Top 101 cities with the highest average wind speeds (population 50,000+)"
#11 on the list of "Top 101 cities with the lowest average temperatures (population 50,000+)"
#12 on the list of "Top 101 larger cities with the highest increase in household income from 2000 (population 50,000+)"
#13 on the list of "Top 101 cities with largest percentage of females in industries: mining, quarrying, and oil and gas extraction (population 50,000+)"
#17 on the list of "Top 101 cities with largest percentage of males in industries: utilities (population 50,000+)"
#18 on the list of "Top 101 larger cities with the highest increase in house/condo value from 2000 (population 50,000+)"
#18 on the list of "Top 100 highest located cities (pop. 50,000+)"
#21 on the list of "Top 101 cities with the smallest percentage of elementary and middle school students in private schools (5,000+ students)"
#24 on the list of "Top 101 cities with the lowest number of rapes per 100,000 residents (population 50,000+)"
#31 on the list of "Top 101 cities with largest percentage of males in industries: other services, except public administration (population 50,000+)"
#35 on the list of "Top 101 cities with the most users submitting photos to our site per 10,000 residents (population 50,000+)"
#37 on the list of "Top 101 cities with the highest percentage of English-only speaking households, population 50,000+"
#46 on the list of "Top 101 cities with the lowest daily low temperatures (population 50,000+)"
#47 on the list of "Top 101 cities with largest percentage of males in occupations: installation, maintenance, and repair occupations (population 50,000+)"
#50 on the list of "Top 101 cities with the most people born in other U.S. states (population 50,000+)"
#56 on the list of "Top 101 cities with the lowest number of robberies per 100,000 residents (population 50,000+)"
#57 on the list of "Top 101 cities with largest percentage of males in occupations: construction and extraction occupations (population 50,000+)"
#4 on the list of "Top 101 counties with the highest percentage of residents that keep firearms around their homes"
#28 on the list of "Top 101 counties with the highest percentage of residents that smoked 100+ cigarettes in their lives"
#31 on the list of "Top 101 counties with the lowest Particulate Matter (PM2.5 ) Annual air pollution readings in 2012 (µg/m3 )"
#34 on the list of "Top 101 counties with highest percentage of residents voting for 3rd party candidates in the 2012 Presidential Election (pop. 50,000+)"
#67 on the list of "Top 101 counties with the highest Sulfur Oxides Annual air pollution readings in 2012 (µg/m3 )"
Top Patent Applicants
Joseph C. Mcginley (12)
John A. Kapeles (8)
John A. Hultman (7)
Frederick J. Reynolds (5)
Eric Coates (4)
John Hultman (4)
Christopher Jason Songe (4)
Sean Michael Lovelace (4)
Stephen M. Bergman (4)
Larry Bench (3)
Total of 105 patent applications in 2008-2024.
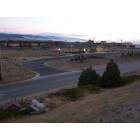

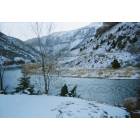
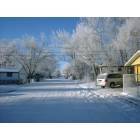
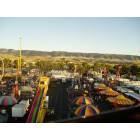

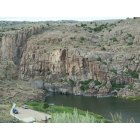


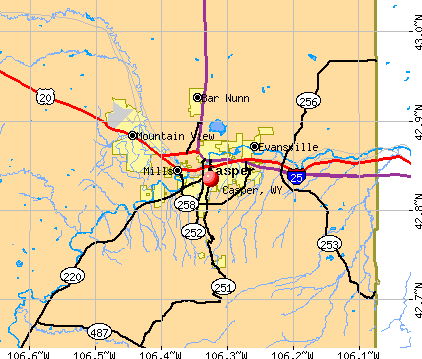


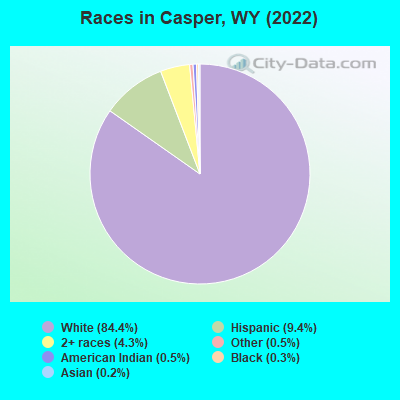
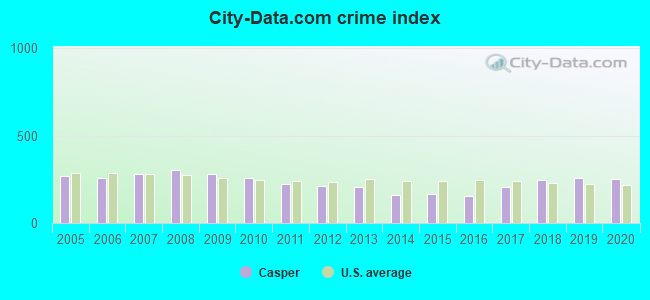
 Recent articles from our blog. Our writers, many of them Ph.D. graduates or candidates, create easy-to-read articles on a wide variety of topics.

 (140.6 miles
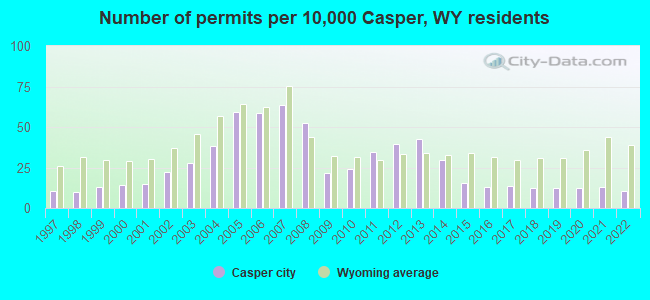
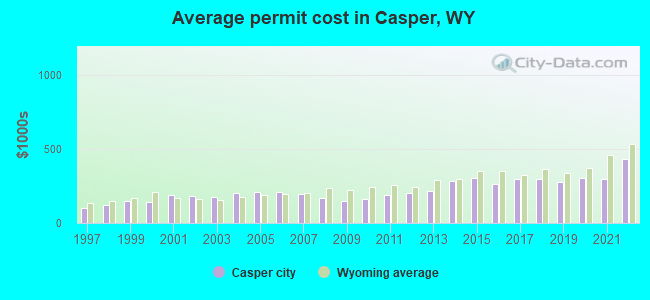
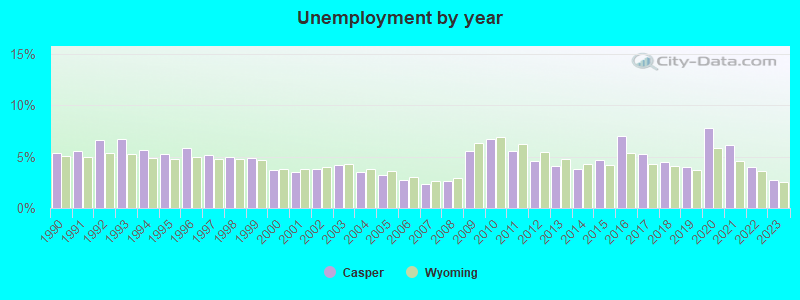
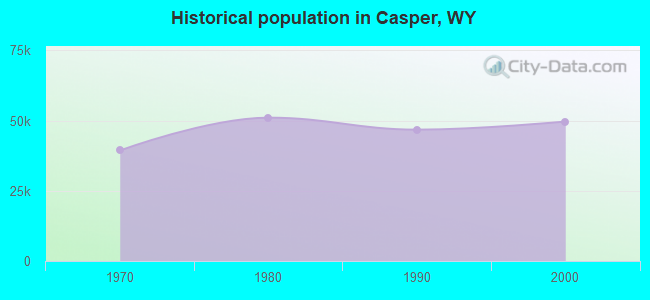
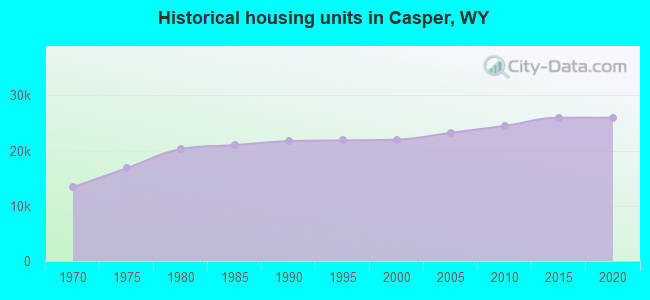
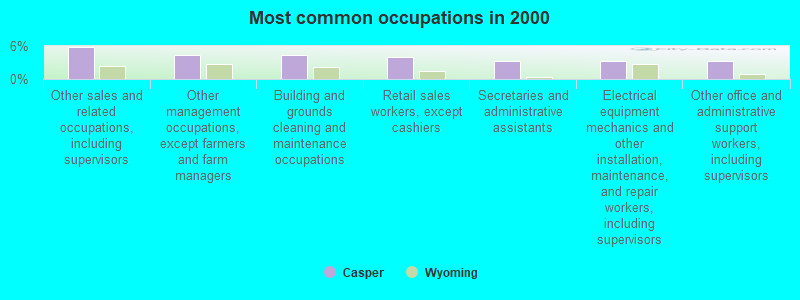
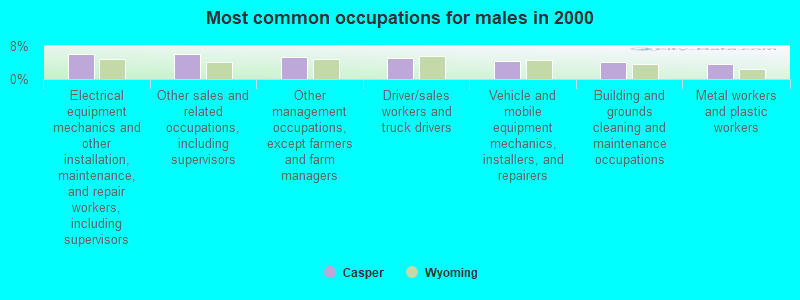
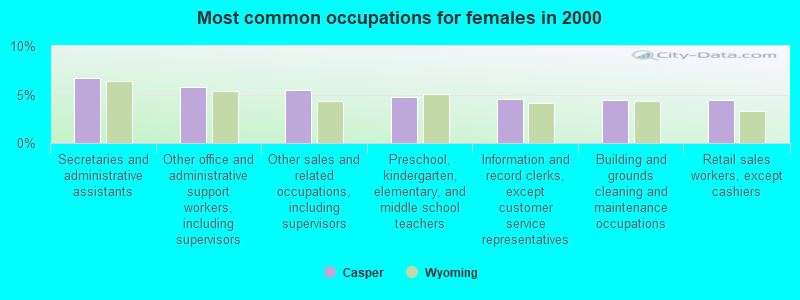

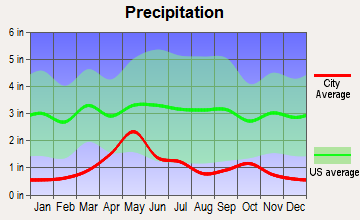
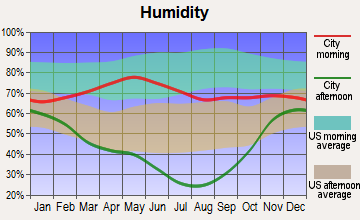
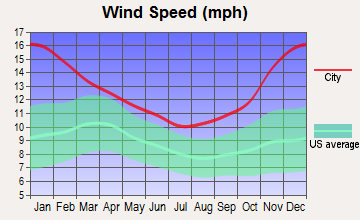
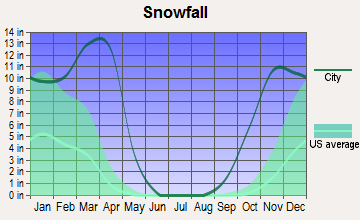
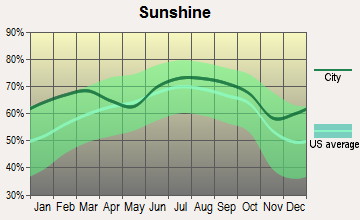
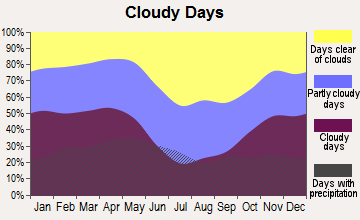
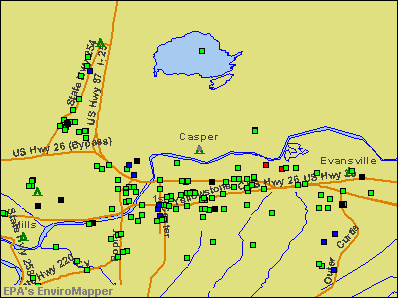

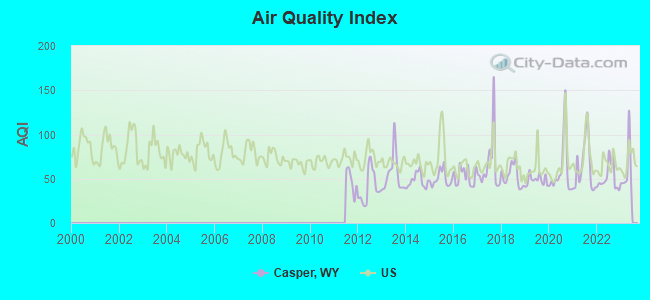
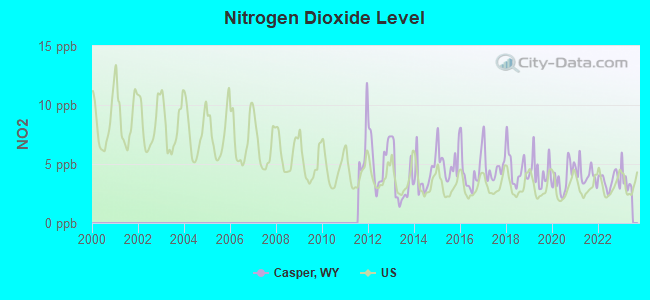
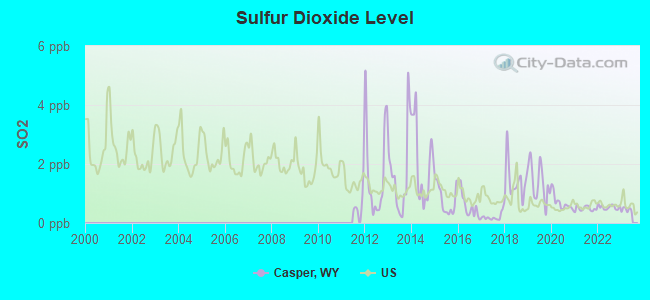
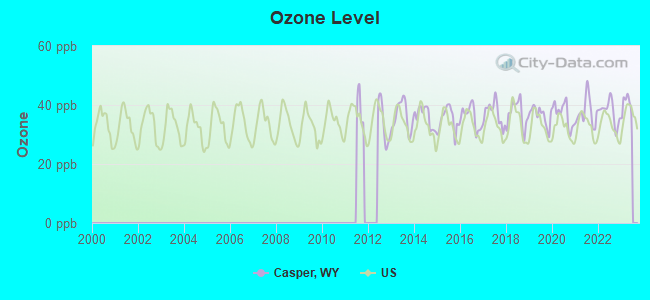
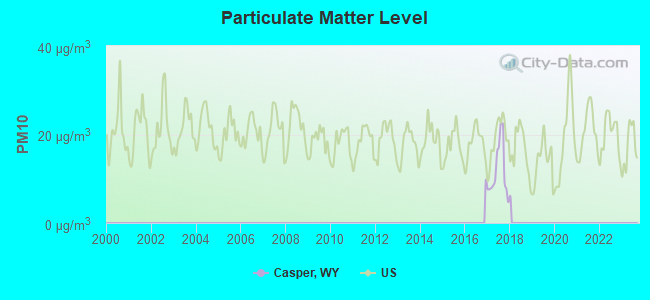


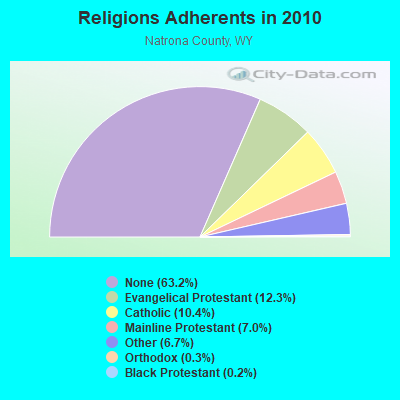
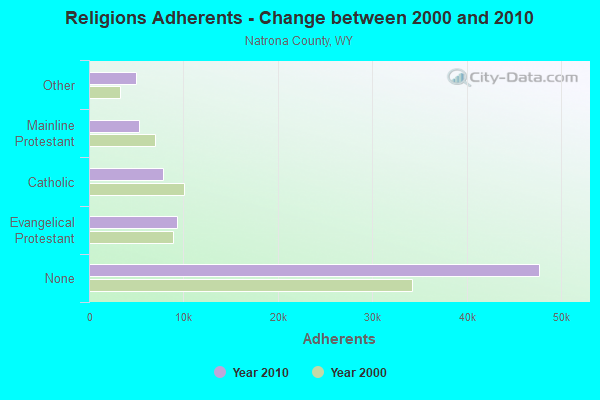
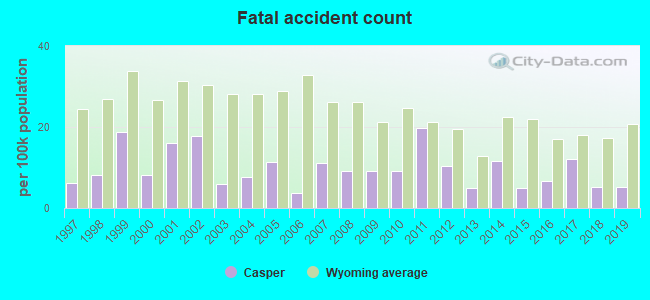
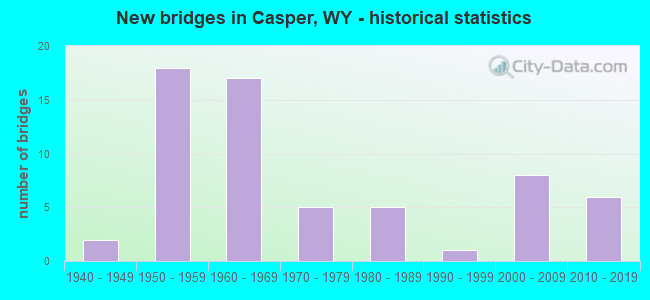
 Based on the data from the years 2002 - 2018 the average number of fires per year is 133. The highest number of fire incidents - 244 took place in 2011, and the least - 0 in 2013. The data has a rising trend.
 When looking into fire subcategories, the most incidents belonged to: Outside Fires (38.7%), and Structure Fires (36.5%).