| Fire incidents reported |
|---|
| Sreet name | Count |
|---|
| PUMPKIN RIDGE RD | 44 | | DAIRY CREEK RD | 38 | | JACKSON SCHOOL RD | 34 | | GLENCOE RD | 28 | | MORELAND RD | 26 | | PACIFIC ST | 22 | | COMMERCIAL ST | 20 | | OLD PUMPKIN RIDGE RD | 18 | | KELLER RD | 16 | | VADIS RD | 16 | | 307TH AVE | 14 | | DIXIE MOUNTAIN RD | 14 | | MOUNTAINDALE RD | 14 | | BEACH RD | 12 | | HILLCREST ST | 12 | | JACKSON QUARRY RD | 12 | | MAIN ST | 12 | | MURPHY RD | 12 | | WEST UNION RD | 12 | | CLAXTAR ST | 10 | | COLLINS RD | 10 | | PUMPKIN RIDGE DR | 10 | | GORDON RD | 8 | | HELVETIA RD | 8 | | HWY 26 | 8 |
| | | Fire incidents reported |
|---|
| Sreet name | Count |
|---|
| NORTH AVE | 8 | | SUNSET HWY | 8 | | 313TH AVE | 6 | | COTTAGE ST | 6 | | DERSHAM RD | 6 | | DIXIE MT RD | 6 | | ECHO GLEN LN | 6 | | GERRISH RD | 6 | | GLENCO RD | 6 | | HELVATIA RD | 6 | | MASON HILL RD | 6 | | PUMPKIN RIDGE | 6 | | 313TH ST | 4 | | COMMERCIAL | 4 | | CORNELIUS PASS RD | 4 | | DAIRY CREEK | 4 | | DERSHAM RD | 4 | | DICK RD | 4 | | DIXIE MTN RD | 4 | | ESSNER DR | 4 | | GLENCOE | 4 | | GREENER RD | 4 | | GROVELAND DR | 4 | | GROVELAND RD | 4 | | HARRINGTON RD | 4 |
|
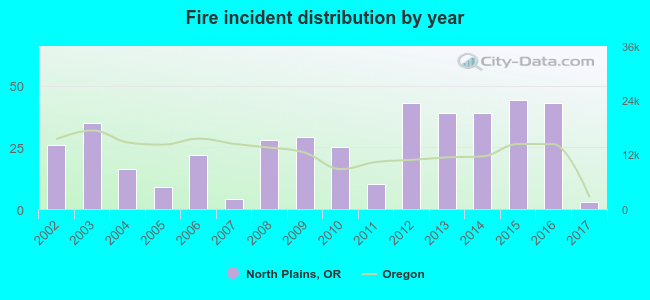 According to the data from the years 2002 - 2017 the average number of fires per year is 26. The highest number of reported fire incidents - 44 took place in 2015, and the least - 3 in 2017. The data has a dropping trend.
 25.0% incidents where reported in the morning and 75.0% in the evening. The most fires (17.1%) took place on Tuesday, and the least (11.8%) on Sunday.
 Based on the 416 reports from years 2002 - 2017 most fires (17.5%) took place during August, and the least (3.6%) in March.
 Out of all 2,088 cases reported during the years 2002 - 2017, the most belonged to the categories: Rescue & EMS (32.6%), Hazardous Condition (21.1%), and Fire (19.9%).
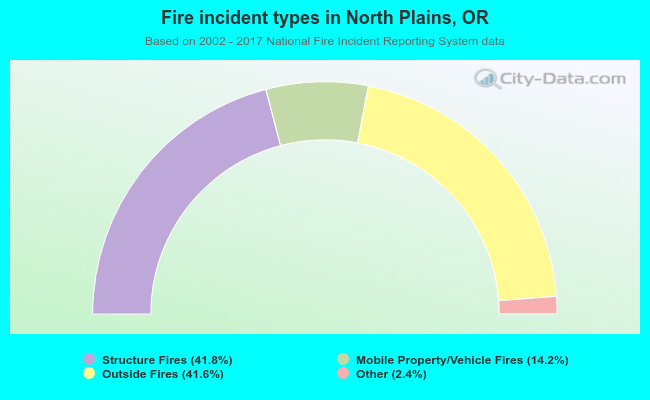 When looking into fire subcategories, the most reports belonged to: Structure Fires (41.8%), and Outside Fires (41.6%).