Lemoore, CA (California) Houses and Residents
Estimated median house or condo value in 2022: $319,722 (it was $109,200 in 2000 )
Lemoore:
$319,722California:
$715,900
Lower value quartile - upper value quartile: $236,412 - $387,116Mean price in 2022: Detached houses: $351,538 Here:
$351,538State:
$988,808
Townhouses or other attached units: $358,480 Here:
$358,480State:
$838,546
In 3-to-4-unit structures: $174,727 Here:
$174,727State:
$824,253
Mobile homes: $528,428 Here:
$528,428State:
$184,506
Total population: 25,186 (Urban population: 19,507 (all inside urban clusters), Rural population: 17 (all nonfarm) )
Houses: 9,461 (8,943 occupied: 4,730 owner occupied, 4,080 renter occupied )
% of renters here:
46%State:
44%
Housing density: 1,119 houses/condos per square mile
Median price asked for vacant for-sale houses and condos in 2022: $266,470.
Median contract rent in 2022: $1,256 (lower quartile is $952, upper quartile is $1,785)
Median rent asked for vacant for-rent units in 2022: $1,941
Median gross rent in Lemoore, CA in 2022: $1,571
Housing units in Lemoore with a mortgage: 3,196 (124 second mortgage, 0 home equity loan, 100 both second mortgage and home equity loan )Houses without a mortgage: 195
Median household income for houses/condos with a mortgage: $82,488
Median household income for apartments without a mortgage: $83,418
Median monthly housing costs: $1,442
Data:
Median house or condo value ($)
Median house or condo value ($ change since 2000)
Median house or condo value ($) - White
Median house or condo value ($) - Black or African American
Median house or condo value ($) - Asian
Median house or condo value ($) - Hispanic or Latino
Median house or condo value ($) - American Indian and Alaska Native
Median house or condo value ($) - Multirace
Median house or condo value ($) - Other Race
Median price asked for mobile homes ($)
Household density (households per square mile)
Mean house or condo value by units in structure - 1, detached ($)
Mean house or condo value by units in structure - 1, attached ($)
Mean house or condo value by units in structure - 2 ($)
Mean house or condo value by units in structure by units in structure - 3 or 4 ($)
Mean house or condo value by units in structure - 5 or more ($)
Mean house or condo value by units in structure - Boat, RV, van, etc. ($)
Mean house or condo value by units in structure - Mobile home ($)
Median contract rent ($)
Median contract rent - Lower quartile ($)
Median contract rent - Upper quartile ($)
Median gross rent ($)
Urban houses (%)
Rural houses (%)
Houses occupied (%)
Houses occupied (% change since 2000)
Houses owner occupied (%)
Houses owner occupied (% change since 2000)
Houses renter occupied (%)
Houses renter occupied (% change since 2000)
Vacant housing units - For rent (%)
Vacant housing units - For rent (% change since 2000)
Vacant housing units - For sale only (%)
Vacant housing units - For sale only (% change since 2000)
Vacant housing units - Rented or sold, not occupied (%)
Vacant housing units - Rented or sold, not occupied (% change since 2000)
Vacant housing units - For seasonal, recreational, or occasional use (%)
Vacant housing units - For seasonal, recreational, or occasional use (% change since 2000)
Vacant housing units - For migrant workers (%)
Vacant housing units - For migrant workers (% change since 2000)
Vacant housing units - Other vacant (%)
Vacant housing units - Other vacant (% change since 2000)
Median monthly housing costs ($)
Median household income for houses/condos with a mortgage ($)
Median household income for houses/condos without a mortgage ($)
Median household income ($)
Median household income ($) - White
Median household income ($) - Black or African American
Median household income ($) - Asian
Median household income ($) - Hispanic or Latino
Median household income ($) - American Indian and Alaska Native
Median household income ($) - Multirace
Median household income ($) - Other Race
Mortgage status - with mortgage (%)
Mortgage status - with second mortgage (%)
Mortgage status - with home equity loan (%)
Mortgage status - with both second mortgage and home equity loan (%)
Mortgage status - without a mortgage (%)
Median year house/condo built
Median year apartment built
Household type by relationship - Male householder living alone (%)
Household type by relationship - Male householder not living alone (%)
Household type by relationship - Female householder living alone (%)
Household type by relationship - Female householder not living alone (%)
Household type by relationship - Opposite-Sex spouse (%)
Household type by relationship - Same-Sex spouse (%)
Household type by relationship - Opposite-Sex unmarried partner (%)
Household type by relationship - Same-Sex unmarried partner (%)
Household type by relationship - In group quarters (%)
Size of family households - 2-person household (%)
Size of family households - 3-person household (%)
Size of family households - 4-person household (%)
Size of family households - 5-person household (%)
Size of family households - 6-person household (%)
Size of family households - 7-or-more-person household (%)
Size of nonfamily households - 1-person household (%)
Size of nonfamily households - 2-person household (%)
Size of nonfamily households - 3-person household (%)
Size of nonfamily households - 4-person household (%)
Size of nonfamily households - 5-person household (%)
Size of nonfamily households - 6-person household (%)
Size of nonfamily households - 7-or-moreperson household (%)
Year house built - Built 2010 or later (%)
Year house built - Built 2000 to 2009 (%)
Year house built - Built 1990 to 1999 (%)
Year house built - Built 1980 to 1989 (%)
Year house built - Built 1970 to 1979 (%)
Year house built - Built 1960 to 1969 (%)
Year house built - Built 1950 to 1959 (%)
Year house built - Built 1940 to 1949 (%)
Year house built - Built 1939 or earlier (%)
Median number of rooms in houses and condos
Median number of rooms in apartments
Median number of bedrooms in owner occupied houses
Mean number of bedrooms in owner occupied houses
Median number of bedrooms in renter occupied houses
Mean number of bedrooms in renter occupied houses
Median number of vehichles in owner occupied houses
Mean number of vehichles in owner occupied houses
Median number of vehichles in renter occupied houses
Mean number of vehichles in renter occupied houses
Rooms in owner-occupied houses - 1 room (%)
Rooms in owner-occupied houses - 2 rooms (%)
Rooms in owner-occupied houses - 3 rooms (%)
Rooms in owner-occupied houses - 4 rooms (%)
Rooms in owner-occupied houses - 5 rooms (%)
Rooms in owner-occupied houses - 6 rooms (%)
Rooms in owner-occupied houses - 7 rooms (%)
Rooms in owner-occupied houses - 8 rooms (%)
Rooms in owner-occupied houses - 9+ rooms (%)
Rooms in renter-occupied houses - 1 room (%)
Rooms in renter-occupied houses - 2 rooms (%)
Rooms in renter-occupied houses - 3 rooms (%)
Rooms in renter-occupied houses - 4 rooms (%)
Rooms in renter-occupied houses - 5 rooms (%)
Rooms in renter-occupied houses - 6 rooms (%)
Rooms in renter-occupied houses - 7 rooms (%)
Rooms in renter-occupied houses - 8 rooms (%)
Rooms in renter-occupied houses - 9+ rooms (%)
Bedrooms in owner-occupied houses - no bedrooms (%)
Bedrooms in owner-occupied houses - 1 bedroom (%)
Bedrooms in owner-occupied houses - 2 bedrooms (%)
Bedrooms in owner-occupied houses - 3 bedrooms (%)
Bedrooms in owner-occupied houses - 4 bedrooms (%)
Bedrooms in owner-occupied houses - 5+ bedrooms (%)
Bedrooms in renter-occupied houses - no bedrooms (%)
Bedrooms in renter-occupied houses - 1 bedroom (%)
Bedrooms in renter-occupied houses - 2 bedrooms (%)
Bedrooms in renter-occupied houses - 3 bedrooms (%)
Bedrooms in renter-occupied houses - 4 bedrooms (%)
Bedrooms in renter-occupied houses - 5+ bedrooms (%)
Vehicles available in owner-occupied houses - no vehicle available (%)
Vehicles available in owner-occupied houses - 1 vehicle available(%)
Vehicles available in owner-occupied houses - 2 Vehicles available (%)
Vehicles available in owner-occupied houses - 3 Vehicles available (%)
Vehicles available in owner-occupied houses - 4 Vehicles available (%)
Vehicles available in owner-occupied houses - 5+ Vehicles available (%)
Vehicles available in renter-occupied houses - no vehicle available (%)
Vehicles available in renter-occupied houses - 1 vehicle available (%)
Vehicles available in renter-occupied houses - 2 Vehicles available (%)
Vehicles available in renter-occupied houses - 3 Vehicles available (%)
Vehicles available in renter-occupied houses - 4 Vehicles available (%)
Vehicles available in renter-occupied houses - 5+ Vehicles available (%)
Housing units in structures - 1, detached (%)
Housing units in structures - 1, attached (%)
Housing units in structures - 2 (%)
Housing units in structures - 3 or 4 (%)
Housing units in structures - 5 to 9 (%)
Housing units in structures - 10 to 19 (%)
Housing units in structures - 20 to 49 (%)
Housing units in structures - 50 or more (%)
Housing units in structures - Mobile home (%)
Housing units in structures - Boat, RV, van, etc. (%)
Housing units in structures - Owners - 1, detached (%)
Housing units in structures - Owners - 1, attached (%)
Housing units in structures - Owners - 2 (%)
Housing units in structures - Owners - 3 or 4 (%)
Housing units in structures - Owners - 5 to 9 (%)
Housing units in structures - Owners - 10 to 19 (%)
Housing units in structures - Owners - 20 to 49 (%)
Housing units in structures - Owners - 50 or more (%)
Housing units in structures - Owners - Mobile home (%)
Housing units in structures - Owners - Boat, RV, van, etc. (%)
Housing units in structures - Renters - 1, detached (%)
Housing units in structures - Renters - 1, attached (%)
Housing units in structures - Renters - 2 (%)
Housing units in structures - Renters - 3 or 4 (%)
Housing units in structures - Renters - 5 to 9 (%)
Housing units in structures - Renters - 10 to 19 (%)
Housing units in structures - Renters - 20 to 49 (%)
Housing units in structures - Renters - 50 or more (%)
Housing units in structures - Renters - Mobile home (%)
Housing units in structures - Renters - Boat, RV, van, etc. (%)
House/condo owner moved in on average (years ago)
Renter moved in on average (years ago)
Year householder moved into unit - Moved in 1999 to March 2000 (%)
Year householder moved into unit - Moved in 1999 to March 2000 (%) - White
Year householder moved into unit - Moved in 1999 to March 2000 (%) - Black or African American
Year householder moved into unit - Moved in 1999 to March 2000 (%) - Asian
Year householder moved into unit - Moved in 1999 to March 2000 (%) - Hispanic or Latino
Year householder moved into unit - Moved in 1999 to March 2000 (%) - American Indian and Alaska Native
Year householder moved into unit - Moved in 1999 to March 2000 (%) - Multirace
Year householder moved into unit - Moved in 1999 to March 2000 (%) - Other Race
Year householder moved into unit - Moved in 1995 to 1998 (%)
Year householder moved into unit - Moved in 1995 to 1998 (%) - White
Year householder moved into unit - Moved in 1995 to 1998 (%) - Black or African American
Year householder moved into unit - Moved in 1995 to 1998 (%) - Asian
Year householder moved into unit - Moved in 1995 to 1998 (%) - Hispanic or Latino
Year householder moved into unit - Moved in 1995 to 1998 (%) - American Indian and Alaska Native
Year householder moved into unit - Moved in 1995 to 1998 (%) - Multirace
Year householder moved into unit - Moved in 1995 to 1998 (%) - Other Race
Year householder moved into unit - Moved in 1990 to 1994 (%)
Year householder moved into unit - Moved in 1990 to 1994 (%) - White
Year householder moved into unit - Moved in 1990 to 1994 (%) - Black or African American
Year householder moved into unit - Moved in 1990 to 1994 (%) - Asian
Year householder moved into unit - Moved in 1990 to 1994 (%) - Hispanic or Latino
Year householder moved into unit - Moved in 1990 to 1994 (%) - American Indian and Alaska Native
Year householder moved into unit - Moved in 1990 to 1994 (%) - Multirace
Year householder moved into unit - Moved in 1990 to 1994 (%) - Other Race
Year householder moved into unit - Moved in 1980 to 1989 (%)
Year householder moved into unit - Moved in 1980 to 1989 (%) - White
Year householder moved into unit - Moved in 1980 to 1989 (%) - Black or African American
Year householder moved into unit - Moved in 1980 to 1989 (%) - Asian
Year householder moved into unit - Moved in 1980 to 1989 (%) - Hispanic or Latino
Year householder moved into unit - Moved in 1980 to 1989 (%) - American Indian and Alaska Native
Year householder moved into unit - Moved in 1980 to 1989 (%) - Multirace
Year householder moved into unit - Moved in 1980 to 1989 (%) - Other Race
Year householder moved into unit - Moved in 1970 to 1979 (%)
Year householder moved into unit - Moved in 1970 to 1979 (%) - White
Year householder moved into unit - Moved in 1970 to 1979 (%) - Black or African American
Year householder moved into unit - Moved in 1970 to 1979 (%) - Asian
Year householder moved into unit - Moved in 1970 to 1979 (%) - Hispanic or Latino
Year householder moved into unit - Moved in 1970 to 1979 (%) - American Indian and Alaska Native
Year householder moved into unit - Moved in 1970 to 1979 (%) - Multirace
Year householder moved into unit - Moved in 1970 to 1979 (%) - Other Race
Year householder moved into unit - Moved in 1969 or earlier (%)
Year householder moved into unit - Moved in 1969 or earlier (%) - White
Year householder moved into unit - Moved in 1969 or earlier (%) - Black or African American
Year householder moved into unit - Moved in 1969 or earlier (%) - Asian
Year householder moved into unit - Moved in 1969 or earlier (%) - Hispanic or Latino
Year householder moved into unit - Moved in 1969 or earlier (%) - American Indian and Alaska Native
Year householder moved into unit - Moved in 1969 or earlier (%) - Multirace
Year householder moved into unit - Moved in 1969 or earlier (%) - Other Race
Housing units lacking complete plumbing facilities (%)
Housing units lacking complete kitchen facilities (%)
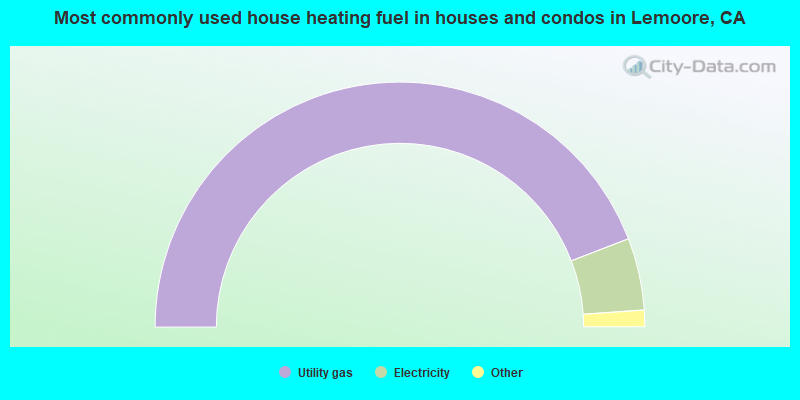
House heating fuel used in houses and condos - Utility gas (%)
House heating fuel used in houses and condos - Bottled, tank, or LP gas (%)
House heating fuel used in houses and condos - Electricity (%)
House heating fuel used in houses and condos - Fuel oil, kerosene, etc. (%)
House heating fuel used in houses and condos - Coal or coke (%)
House heating fuel used in houses and condos - Wood (%)
House heating fuel used in houses and condos - Solar energy (%)
House heating fuel used in houses and condos - Other fuel (%)
House heating fuel used in houses and condos - No fuel used (%)
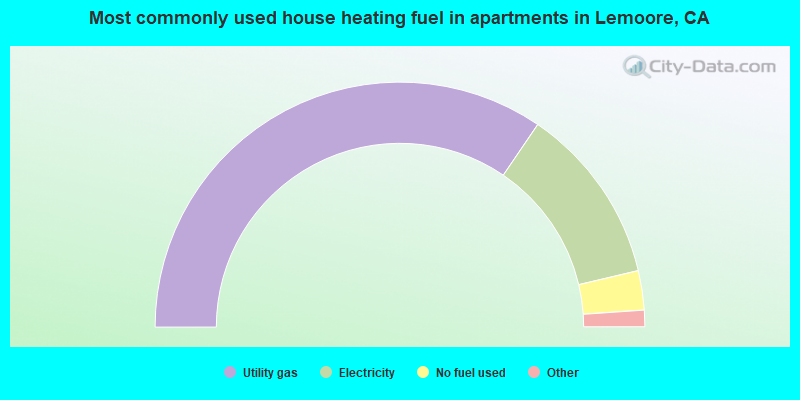
House heating fuel used in apartments - Utility gas (%)
House heating fuel used in apartments - Bottled, tank, or LP gas (%)
House heating fuel used in apartments - Electricity (%)
House heating fuel used in apartments - Fuel oil, kerosene, etc. (%)
House heating fuel used in apartments - Coal or coke (%)
House heating fuel used in apartments - Wood (%)
House heating fuel used in apartments - Solar energy (%)
House heating fuel used in apartments - Other fuel (%)
House heating fuel used in apartments - No fuel used (%)
Latest news about housing in Lemoore, CA collected exclusively by city-data.com from local newspapers, TV, and radio stations
Median year house/condo built: 1990Median year apartment built: 1985Household type by relationship:
Households: 27,037
Male householders: 5,079 (1,158 living alone ), Female householders: 3,748 (612 living alone )4,199 spouses (4,184 opposite-sex spouses ), 772 unmarried partners , (736 opposite-sex unmarried partners ), 9,320 children (8,755 natural , 79 adopted , 485 stepchildren ), 588 grandchildren , 971 brothers or sisters , 546 parents , 15 foster children , 743 other relatives , 1,041 non-relatives In group quarters: 10
Size of family households: 2,596 2-persons , 1,168 3-persons , 1,435 4-persons , 672 5-persons , 507 6-persons , 57 7-or-more-persons .
Size of nonfamily households: 1,740 1-person , 723 2-persons , 57 3-persons , 15 5-persons .
4,493 married couples with children. single-parent households (1,022 men , 1,012 women ).
67.8% of residents of Lemoore speak English at home. of residents speak Spanish at home (56% speak English very well , 22% speak English well , 18% speak English not well , 5% don't speak English at all ).of residents speak other Indo-European language at home (71% speak English very well , 17% speak English well , 12% speak English not well ).of residents speak Asian or Pacific Island language at home (53% speak English very well , 39% speak English well , 6% speak English not well , 2% don't speak English at all ).of residents speak other language at home (100% speak English very well ).
Foreign born population: 3,569 (13.2%)of them are naturalized citizens )
Median number of rooms in houses and condos:
Median number of rooms in apartments
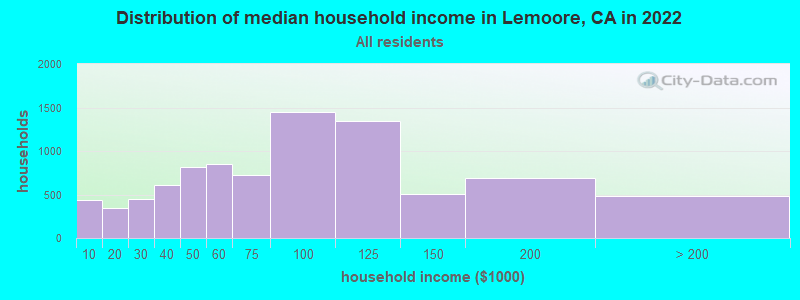
Lemoore, CA household income distribution 438 Less than $10,000345 $10,000 to $19,999447 $20,000 to $29,999609 $30,000 to $39,999812 $40,000 to $49,999855 $50,000 to $59,999720 $60,000 to $74,9991,451 $75,000 to $99,9991,345 $100,000 to $124,999510 $125,000 to $149,999694 $150,000 to $199,999478 $200,000 or more
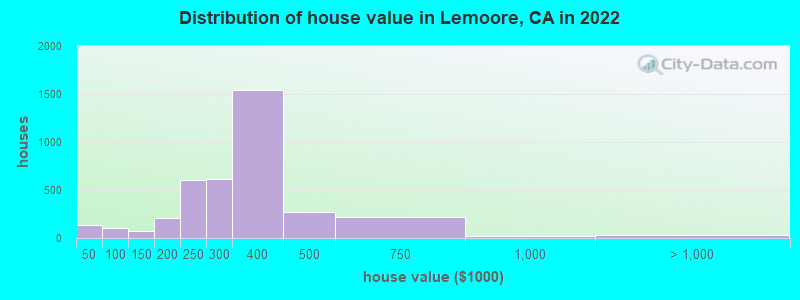
Home value of owner - occupied houses in 2022 in Lemoore, CA 35 Less than $10,00035 $10,000 to $14,99910 $20,000 to $24,9996 $25,000 to $29,99919 $30,000 to $34,9994 $35,000 to $39,99927 $40,000 to $49,99932 $50,000 to $59,99940 $90,000 to $99,99970 $100,000 to $124,9994 $125,000 to $149,99954 $150,000 to $174,999149 $175,000 to $199,999599 $200,000 to $249,999616 $250,000 to $299,9991,544 $300,000 to $399,999270 $400,000 to $499,999218 $500,000 to $749,99918 $750,000 to $999,99933 $2,000,000 or moreRent paid by renters in 2022 in Lemoore, CA 37 Less than $100119 $150 to $19910 $200 to $24916 $300 to $34994 $400 to $44918 $450 to $49917 $500 to $54978 $550 to $599263 $600 to $64919 $650 to $6999 $700 to $74966 $750 to $799325 $800 to $899283 $900 to $999838 $1,000 to $1,249468 $1,250 to $1,4991,116 $1,500 to $1,999203 $2,000 to $2,49921 $2,500 to $2,99919 No cash rent
Percentage of workers working in this county: 83.5%Number of people working at home: 305 (2.5% of all workers )
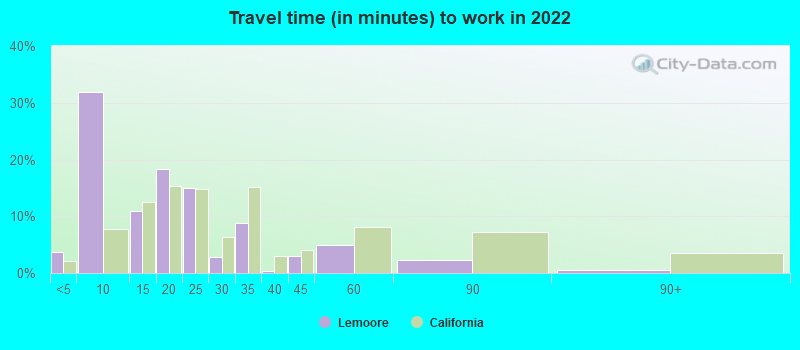
Travel time to work (commute)
Less than 5 minutes: 2375 to 9 minutes: 2,43510 to 14 minutes: 1,31115 to 19 minutes: 2,83220 to 24 minutes: 2,36325 to 29 minutes: 33430 to 34 minutes: 70635 to 39 minutes: 17140 to 44 minutes: 67545 to 59 minutes: 80860 to 89 minutes: 9890 or more minutes: 92
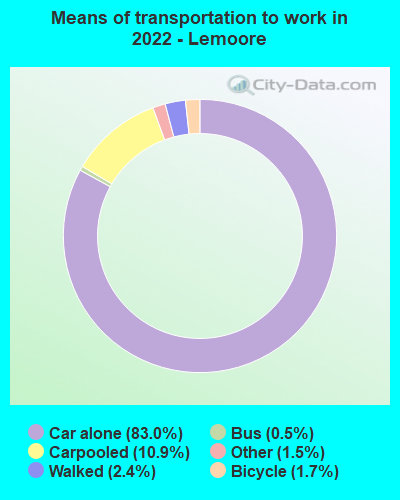
Means of transportation to work:
Drove a car alone: 5,171 (76.9%)Carpooled: 697 (10.4%)Bus : 22 (0.3%)Taxi: 114 (1.7%)Bicycle: 229 (3.4%)Walked: 326 (4.8%)Worked at home: 305 (4.5%)
Unemployment by race in 2022
Unemployment rate for White non-Hispanic residents 5.0% Males14.0% FemalesUnemployment rate for Black residents 12.9% Males12.9% FemalesUnemployment rate for Asian residents 32.1% Males5.9% FemalesUnemployment rate for other race residents 4.5% Males13.9% FemalesUnemployment rate for two or more race residents 12.4% Males12.2% FemalesUnemployment rate for Hispanic or Latino residents 8.9% Males7.7% Females
Year of entry for the foreign-born population in Lemoore, California
677 2010 or later 842 2000 to 2009 867 1990 to 1999 772 1980 to 1989 797 1970 to 1979 389 Before 1970
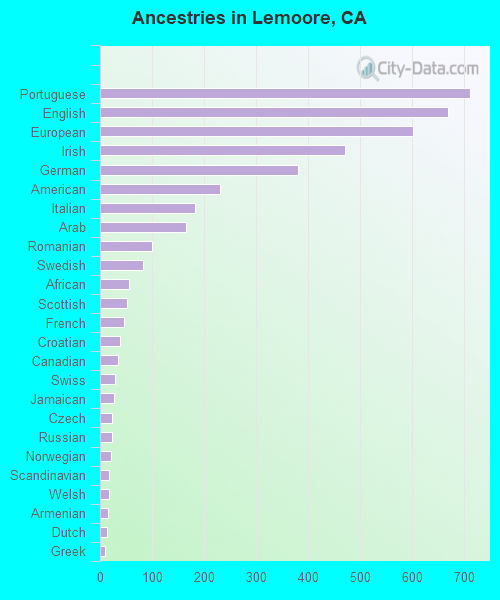
First ancestries reported:
Portuguese: 712 (4.2%)
English: 669 (3.9%)
European: 601 (3.5%)
Irish: 471 (2.8%)
German: 380 (2.2%)
American: 230 (1.3%)
Italian: 182 (1.1%)
Arab: 166 (1.0%)
Romanian: 100 (0.6%)
Swedish: 82 (0.5%)
African: 56 (0.3%)
Scottish: 51 (0.3%)
French: 46 (0.3%)
Croatian: 38 (0.2%)
Canadian: 35 (0.2%)
Swiss: 28 (0.2%)
Jamaican: 26 (0.2%)
Czech: 23 (0.1%)
Russian: 23 (0.1%)
Norwegian: 21 (0.1%)
Scandinavian: 18 (0.1%)
Welsh: 18 (0.1%)
Armenian: 16 (0.09%)
Dutch: 13 (0.08%)
Greek: 9 (0.05%)
Finnish: 8 (0.05%)
Scotch-Irish: 8 (0.05%)
Lithuanian: 3 (0.02%) Most common places of birth for foreign-born residents (%): Mexico Lemoore:
47.2% (1,824)California:
37.2% (3,881,193)
Philippines Lemoore:
27.8% (1,073)California:
7.8% (818,297)
Yemen Lemoore:
3.9% (151)California:
0.1% (10,349)
Vietnam Lemoore:
3.0% (116)California:
4.9% (512,335)
Portugal Lemoore:
2.7% (104)California:
0.2% (25,462)
Guatemala Lemoore:
2.6% (100)California:
2.8% (290,436)
Romania Lemoore:
2.5% (97)California:
0.2% (23,058)
Azores Islands Lemoore:
2.5% (95)California:
0.1% (8,659)
Place of birth for U.S.-born residents:
This state: 17,570Other state: 5,359Northeast: 728Midwest: 860South: 2,664West: 926 85.4% of Lemoore residents lived in the same house 1 years ago.
Out of people who lived in different houses, 34.0% lived in this county.
Out of people who lived in different counties, 72.1% lived in California.
Lemoore:
85.4%State average:
88.9%
Education attainment for males 25 years and older:
No schooling: 485Nursery to 4th grade: 1425th and 6th grade: 1637th and 8th grade: 1509th grade: 4310th grade: 14911th grade: 19912th grade, no diploma: 343High school graduate (or equivalency): 2,416Less than 1 year of college: 464Some college more than 1 year, no degree: 1,383Associate degree: 1,193Bachelor's degree: 1,542Master's degree: 541Professional school degree: 88Doctorate degree: 192
Education attainment for females 25 years and older:
No schooling: 180Nursery to 4th grade: 675th and 6th grade: 1357th and 8th grade: 739th grade: 4410th grade: 3311th grade: 7112th grade, no diploma: 81High school graduate (or equivalency): 2,651Less than 1 year of college: 802Some college more than 1 year, no degree: 1,291Associate degree: 1,010Bachelor's degree: 1,274Master's degree: 248Professional school degree: 108Doctorate degree: 101
Housing units in structures:
One, detached: 7,028One, attached: 98Two: 1153 or 4: 8035 to 9: 44710 to 19: 26220 to 49: 11450 or more: 464Mobile homes: 126Housing units lacking complete plumbing facilities in 2022: 0.2%Housing units lacking complete kitchen facilities in 2022: 2.2%House/condo owner moved in on average 10 years ago
Renter moved in on average 2 years ago
Private vs. public school enrollment:
Students in private schools in grades 1 to 8 (elementary and middle school): 262 Here:
9.0%California:
10.5%
Students in private schools in grades 9 to 12 (high school): 146 Here:
10.5%California:
8.5%
Students in private undergraduate colleges: 527 Here:
31.6%California:
15.9%