Camden Woods neighborhood in Tampa, Florida (FL), 33619 detailed profile
Settings
X


Business Search - 14 Million verified businesses
Area: 0.053 square miles
Population: 498
Population density:
| Camden Woods: | 9,398 people per square mile |
| Tampa: | 3,553 people per square mile |

- 35769.3%Black
- 7113.8%Hispanic or Latino
- 5210.1%White
- 173.3%Asian
- 112.1%Two or more races
- 71.4%Some other race

Distribution of median household income
![Distribution of median household income]()
- 17Less than $10,000
- 6$10,000 to $19,999
- 42$20,000 to $29,999
- 33$30,000 to $39,999
- 17$40,000 to $49,999
- 21$50,000 to $59,999
- 27$60,000 to $74,999
- 20$75,000 to $99,999
- 4$100,000 to $124,999
- 8$125,000 to $149,999
- 15$150,000 to $199,999
- 59$200,000 or more

Distribution of owner-occupied house/condo value
![Distribution of owner-occupied house/condo value]()
- 4Less than $50,000
- 2$50,000 to $99,999
- 39$100,000 to $149,999
- 19$150,000 to $199,999
- 6$200,000 to $249,999
- 15$250,000 to $299,999
- 70$300,000 to $399,999
- 4$400,000 to $499,999
- 8$500,000 to $749,999
- 1$750,000 to $999,999
- 4$1,000,000 or more

Distribution of rent paid by renters
![Distribution of rent paid by renters]()
- 6$400 to $499
- 15$900 to $999
- 6$1,000 to $1,249
- 28$1,250 to $1,499
- 2$1,500 to $1,999
- 7$2,000 or more

Median rent in 2022:
| Camden Woods: | $1,316 |
| Tampa: | $1,444 |
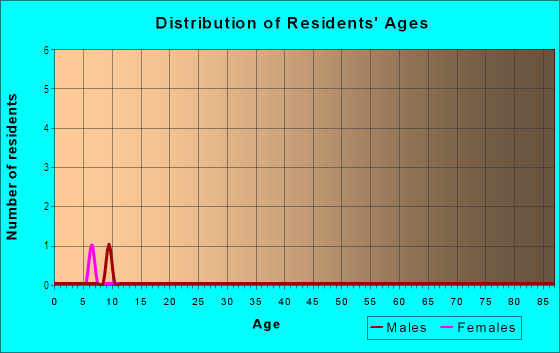
| Males: | 202 |
| Females: | 296 |
Males:
| This neighborhood: | 31.5 years |
| Whole city: | 35.5 years |
| This neighborhood: | 37.1 years |
| Whole city: | 35.1 years |
Average household size:
| Camden Woods: | 2.6 people |
| Tampa: | 2.3 people |
Percentage of family households:
| Camden Woods: | 63.2% |
| Tampa: | 39.9% |
| Here: | 35.0% |
| Tampa: | 35.4% |
Percentage of married-couple families with children (among all households):
| Camden Woods: | 38.2% |
| Tampa: | 25.1% |
Percentage of single-mother households (among all households):
| Camden Woods: | 23.5% |
| Tampa: | 12.2% |
Percentage of never married males 15 years old and over:
Percentage of never married females 15 years old and over:
| Camden Woods: | 13.7% |
| Tampa: | 23.6% |
Percentage of never married females 15 years old and over:
| Camden Woods: | 22.6% |
| city: | 20.9% |
Percentage of people that speak English not well or not at all:
| Camden Woods: | 1.0% |
| Tampa: | 6.4% |
Percentage of people born in this state:
Percentage of people born in another U.S. state:
Percentage of native residents but born outside the U.S.:
Percentage of foreign born residents:
| Here: | 41.8% |
| Tampa: | 39.7% |
Percentage of people born in another U.S. state:
| Camden Woods: | 36.0% |
| Tampa: | 35.7% |
Percentage of native residents but born outside the U.S.:
| Here: | 4.9% |
| city: | 4.6% |
Percentage of foreign born residents:
| Here: | 17.3% |
| Tampa: | 20.0% |

Owner-occupied
Renter-occupied


- Rooms in owner-occupied houses and condos in Camden Woods
- 11 room
- 02 rooms
- 63 rooms
- 34 rooms
- 215 rooms
- 756 rooms
- 57 rooms
- 418 rooms
- 109+ rooms

- Rooms in renter-occupied apartments in Camden Woods
- 01 room
- 22 rooms
- 93 rooms
- 24 rooms
- 235 rooms
- 186 rooms
- 117 rooms
- 18 rooms
- 69+ rooms
Owner-occupied
Renter-occupied

- Bedrooms in owner-occupied houses and condos in Camden Woods
- 1no bedroom
- 01 bedroom
- 162 bedrooms
- 673 bedrooms
- 624 bedrooms
- 35+ bedrooms

- Bedrooms in renter-occupied apartments in Camden Woods
- 0no bedroom
- 81 bedroom
- 82 bedrooms
- 423 bedrooms
- 14 bedrooms
- 35+ bedrooms
Average number of cars or other vehicles available in houses/condos:
Average number of cars or other vehicles available in apartments:
| This neighborhood: | 1.6 |
| Tampa: | 1.9 |
Average number of cars or other vehicles available in apartments:
| Here: | 1.7 |
| city: | 1.3 |
Percentage of units with a mortgage:
| Camden Woods: | 67.5% |
| Tampa: | 65.8% |
Average estimated value of detached houses in 2022 (100.0% of all units):
| Camden Woods: | $259,718 |
| Tampa: | $505,567 |

- Year house built in Camden Woods
- 32020 or later
- 672010 to 2019
- 272000 to 2009
- 121990 to 1999
- 41980 to 1989
- 51970 to 1979
- 751960 to 1969
- 191950 to 1959
- 01940 to 1949
- 171939 or earlier

City-data.com crime index for city in 2020 (higher means more crime):
| City: | 212.7 |
| U.S. average: | 219.5 |
Travel time to work (commute)
![Travel time to work (commute)]()
- 6Less than 5 minutes
- 255 to 9 minutes
- 2210 to 14 minutes
- 1315 to 19 minutes
- 3920 to 24 minutes
- 1525 to 29 minutes
- 6030 to 34 minutes
- 2235 to 39 minutes
- 2340 to 44 minutes
- 1445 to 59 minutes
- 2460 to 89 minutes
- 490 or more minutes

Means of transportation to work
![Means of transportation to work]()
- 67.8%184Drove a car alone
- 7.0%19Carpooled
- 2.2%6Bus
- 0.4%1Taxi
- 24.7%67Worked at home

Time leaving home to go to work
![Time leaving home to go to work]()
- 512:00 a.m. to 4:59 a.m.
- 215:00 a.m. to 5:29 a.m.
- 105:30 a.m. to 5:59 a.m.
- 396:00 a.m. to 6:29 a.m.
- 376:30 a.m. to 6:59 a.m.
- 617:00 a.m. to 7:29 a.m.
- 187:30 a.m. to 7:59 a.m.
- 528:00 a.m. to 8:29 a.m.
- 58:30 a.m. to 8:59 a.m.
- 199:00 a.m. to 9:59 a.m.
- 211:00 a.m. to 11:59 a.m.
- 1412:00 p.m. to 3:59 p.m.
- 214:00 p.m. to 11:59 p.m.

Occupations of males:
- Percentage of males in management occupations (except farmers):
Here: 22.8% city: 14.3%
- Percentage of males in business and financial operations occupations:
Here: 8.6% city: 7.8%
- Percentage of males in computer and mathematical occupations:
Here: 5.3% city: 6.0%
- Percentage of males in architecture and engineering occupations:
Here: 5.0% city: 2.6%
- Percentage of males in community and social services occupations:
Here: 1.8% city: 0.5%
- Percentage of males in education, training, and library occupations:
Here: 3.9% city: 2.2%
- Percentage of males in healthcare practitioners and technical occupations:
Here: 7.6% city: 4.9%
- Percentage of males in service occupations:
Here: 9.1% city: 13.7%
- Percentage of males in sales and office occupations:
Here: 6.1% city: 16.3%
- Percentage of males in construction, extraction, and maintenance occupations:
Here: 8.5% city: 8.2%
- Percentage of males in production occupations:
Here: 5.1% city: 3.7%
- Percentage of males in transportation occupations:
Here: 51.3% city: 5.8%
- Percentage of males in material moving occupations:
Here: 3.6% city: 3.8%
Occupations of females:
- Percentage of females in management occupations (except farmers):
Here: 11.9% city: 10.9%
- Percentage of females in business and financial operations occupations:
Here: 9.6% city: 8.5%
- Percentage of females in computer and mathematical occupations:
Here: 10.6% city: 2.4%
- Percentage of females in architecture and engineering occupations:
Here: 1.7% city: 0.6%
- Percentage of females in community and social services occupations:
Here: 28.5% city: 2.1%
- Percentage of females in legal occupations:
Here: 4.7% city: 2.7%
- Percentage of females in education, training, and library occupations:
Here: 7.4% city: 7.2%
- Percentage of females in healthcare practitioners and technical occupations:
Here: 2.0% city: 10.3%
- Percentage of females in service occupations:
Here: 38.0% city: 19.1%
- Percentage of females in sales and office occupations:
Here: 31.4% city: 27.1%
- Percentage of females in material moving occupations:
Here: 4.8% city: 1.4%
Percentage of people 16-64 in Armed Forces:
| Camden Woods: | 1.6% |
| Tampa: | 1.1% |
Education in this neighborhood (subdivision or community):
- Percentage of people 3 years and older in K-12 schools:
Camden Woods: 17.6% Tampa: 14.3%
- Percentage of people 3 years and older in undergraduate colleges:
Camden Woods: 5.9% Tampa: 7.8%
- Percentage of people 3 years and older in grad. or professional schools:
Camden Woods: 11.3% Tampa: 2.0%
- Percentage of students K-12 enrolled in private schools:
Camden Woods: 29.6% Tampa: 12.5%
Percentage of population below poverty level:
| Camden Woods: | 12.9% |
| Tampa: | 16.3% |
Median year owner moved in (as recorded in 2022):
Median year renter moved in (as recorded in 2022):
| Camden Woods: | 2011 |
| Tampa: | 2013 |
Median year renter moved in (as recorded in 2022):
| Camden Woods: | 2007 |
| Tampa: | 2020 |
Percentage of married-couple families with both working:
| Camden Woods: | 104.6% |
| Tampa: | 70.4% |

- 90.4%Electricity
- 4.8%Solar energy
- 2.7%Fuel oil, kerosene, etc.
- 2.2%Utility gas