Historic Hyde Park North neighborhood in Tampa, Florida (FL), 33606 detailed profile
Settings
X


Business Search - 14 Million verified businesses
Area: 0.396 square miles
Population: 2,680
Population density:
| Historic Hyde Park North: | 6,761 people per square mile |
| Tampa: | 3,553 people per square mile |

- 2,06977.3%White
- 40515.1%Hispanic or Latino
- 1023.8%Two or more races
- 552.1%Asian
- 461.7%Black

Distribution of median household income
![Distribution of median household income]()
- 52Less than $10,000
- 22$10,000 to $19,999
- 176$20,000 to $29,999
- 25$30,000 to $39,999
- 48$40,000 to $49,999
- 52$50,000 to $59,999
- 103$60,000 to $74,999
- 34$75,000 to $99,999
- 184$100,000 to $124,999
- 242$125,000 to $149,999
- 332$150,000 to $199,999
- 406$200,000 or more

Distribution of owner-occupied house/condo value
![Distribution of owner-occupied house/condo value]()
- 23Less than $50,000
- 46$150,000 to $199,999
- 12$200,000 to $249,999
- 106$300,000 to $399,999
- 55$400,000 to $499,999
- 370$500,000 to $749,999
- 90$750,000 to $999,999
- 118$1,000,000 or more

Distribution of rent paid by renters
![Distribution of rent paid by renters]()
- 56$800 to $899
- 38$900 to $999
- 83$1,000 to $1,249
- 43$1,250 to $1,499
- 218$1,500 to $1,999
- 732$2,000 or more

Median rent in 2022:
| Historic Hyde Park North: | $2,277 |
| Tampa: | $1,444 |
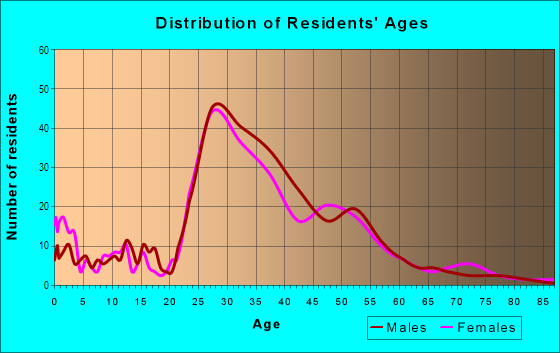
| Males: | 1,402 |
| Females: | 1,277 |
Males:
| This neighborhood: | 36.6 years |
| Whole city: | 35.5 years |
| This neighborhood: | 40.9 years |
| Whole city: | 35.1 years |
Average household size:
| Historic Hyde Park North: | 1.6 people |
| Tampa: | 2.3 people |
Percentage of family households:
| Historic Hyde Park North: | 33.0% |
| Tampa: | 39.9% |
| Here: | 34.5% |
| Tampa: | 35.4% |
Percentage of married-couple families with children (among all households):
| Historic Hyde Park North: | 46.7% |
| Tampa: | 25.1% |
Percentage of single-mother households (among all households):
| Historic Hyde Park North: | 8.2% |
| Tampa: | 12.2% |
Percentage of never married males 15 years old and over:
Percentage of never married females 15 years old and over:
| Historic Hyde Park North: | 18.4% |
| Tampa: | 23.6% |
Percentage of never married females 15 years old and over:
| Historic Hyde Park North: | 22.5% |
| city: | 20.9% |
Percentage of people that speak English not well or not at all:
| Historic Hyde Park North: | 4.0% |
| Tampa: | 6.4% |
Percentage of people born in this state:
Percentage of people born in another U.S. state:
Percentage of native residents but born outside the U.S.:
Percentage of foreign born residents:
| Here: | 32.6% |
| Tampa: | 39.7% |
Percentage of people born in another U.S. state:
| Historic Hyde Park North: | 44.0% |
| Tampa: | 35.7% |
Percentage of native residents but born outside the U.S.:
| Here: | 9.1% |
| city: | 4.6% |
Percentage of foreign born residents:
| Here: | 14.2% |
| Tampa: | 20.0% |

Owner-occupied
Renter-occupied


- Rooms in owner-occupied houses and condos in Historic Hyde Park North
- 01 room
- 02 rooms
- 2463 rooms
- 1434 rooms
- 405 rooms
- 646 rooms
- 697 rooms
- 458 rooms
- 839+ rooms

- Rooms in renter-occupied apartments in Historic Hyde Park North
- 1091 room
- 802 rooms
- 3423 rooms
- 2254 rooms
- 965 rooms
- 246 rooms
- 297 rooms
- 138 rooms
- 09+ rooms
Owner-occupied
Renter-occupied

- Bedrooms in owner-occupied houses and condos in Historic Hyde Park North
- 0no bedroom
- 241 bedroom
- 5392 bedrooms
- 543 bedrooms
- 574 bedrooms
- 455+ bedrooms

- Bedrooms in renter-occupied apartments in Historic Hyde Park North
- 109no bedroom
- 3371 bedroom
- 3982 bedrooms
- 623 bedrooms
- 04 bedrooms
- 05+ bedrooms
Average number of cars or other vehicles available in houses/condos:
Average number of cars or other vehicles available in apartments:
| This neighborhood: | 1.7 |
| Tampa: | 1.9 |
Average number of cars or other vehicles available in apartments:
| Here: | 1.4 |
| city: | 1.3 |
Percentage of units with a mortgage:
| Historic Hyde Park North: | 67.9% |
| Tampa: | 65.8% |
Average estimated '22 value of housing units in 5-or-more-unit structures (91.3% of all units):
| Historic Hyde Park North: | $528,828 |
| Tampa: | $373,207 |

- Year house built in Historic Hyde Park North
- 02020 or later
- 5902010 to 2019
- 4542000 to 2009
- 3891990 to 1999
- 491980 to 1989
- 111970 to 1979
- 01960 to 1969
- 311950 to 1959
- 1251940 to 1949
- 291939 or earlier

City-data.com crime index for city in 2020 (higher means more crime):
| City: | 212.7 |
| U.S. average: | 219.5 |
Travel time to work (commute)
![Travel time to work (commute)]()
- 75Less than 5 minutes
- 3545 to 9 minutes
- 16110 to 14 minutes
- 47715 to 19 minutes
- 43120 to 24 minutes
- 28725 to 29 minutes
- 32330 to 34 minutes
- 10735 to 39 minutes
- 3940 to 44 minutes
- 2445 to 59 minutes
- 6590 or more minutes

Means of transportation to work
![Means of transportation to work]()
- 68.8%1,255Drove a car alone
- 0.6%11Carpooled
- 15.6%284Walked
- 1.1%20Other means
- 14.5%264Worked at home

Time leaving home to go to work
![Time leaving home to go to work]()
- 575:00 a.m. to 5:29 a.m.
- 815:30 a.m. to 5:59 a.m.
- 1426:00 a.m. to 6:29 a.m.
- 2436:30 a.m. to 6:59 a.m.
- 3107:00 a.m. to 7:29 a.m.
- 3357:30 a.m. to 7:59 a.m.
- 4568:00 a.m. to 8:29 a.m.
- 3828:30 a.m. to 8:59 a.m.
- 2049:00 a.m. to 9:59 a.m.
- 1711:00 a.m. to 11:59 a.m.
- 9912:00 p.m. to 3:59 p.m.
- 584:00 p.m. to 11:59 p.m.

Occupations of males:
- Percentage of males in management occupations (except farmers):
Here: 20.4% city: 14.3%
- Percentage of males in business and financial operations occupations:
Here: 7.8% city: 7.8%
- Percentage of males in computer and mathematical occupations:
Here: 12.8% city: 6.0%
- Percentage of males in life, physical, and social science occupations:
Here: 5.4% city: 0.8%
- Percentage of males in community and social services occupations:
Here: 2.5% city: 0.5%
- Percentage of males in legal occupations:
Here: 4.9% city: 2.8%
- Percentage of males in education, training, and library occupations:
Here: 5.4% city: 2.2%
- Percentage of males in healthcare practitioners and technical occupations:
Here: 17.7% city: 4.9%
- Percentage of males in service occupations:
Here: 5.6% city: 13.7%
- Percentage of males in sales and office occupations:
Here: 17.5% city: 16.3%
- Percentage of males in production occupations:
Here: 1.6% city: 3.7%
Occupations of females:
- Percentage of females in management occupations (except farmers):
Here: 22.3% city: 10.9%
- Percentage of females in business and financial operations occupations:
Here: 11.4% city: 8.5%
- Percentage of females in computer and mathematical occupations:
Here: 6.5% city: 2.4%
- Percentage of females in community and social services occupations:
Here: 9.0% city: 2.1%
- Percentage of females in legal occupations:
Here: 5.4% city: 2.7%
- Percentage of females in education, training, and library occupations:
Here: 5.2% city: 7.2%
- Percentage of females in healthcare practitioners and technical occupations:
Here: 20.1% city: 10.3%
- Percentage of females in service occupations:
Here: 2.4% city: 19.1%
- Percentage of females in sales and office occupations:
Here: 14.9% city: 27.1%
- Percentage of females in production occupations:
Here: 2.6% city: 2.0%
- Percentage of females in material moving occupations:
Here: 2.7% city: 1.4%
Percentage of people 16-64 in Armed Forces:
| Historic Hyde Park North: | 0.6% |
| Tampa: | 1.1% |
Education in this neighborhood (subdivision or community):
- Percentage of people 3 years and older in K-12 schools:
Historic Hyde Park North: 11.5% Tampa: 14.3%
- Percentage of people 3 years and older in undergraduate colleges:
Historic Hyde Park North: 4.0% Tampa: 7.8%
- Percentage of people 3 years and older in grad. or professional schools:
Historic Hyde Park North: 2.9% Tampa: 2.0%
- Percentage of students K-12 enrolled in private schools:
Historic Hyde Park North: 19.3% Tampa: 12.5%
Percentage of population below poverty level:
| Historic Hyde Park North: | 5.7% |
| Tampa: | 16.3% |
Median year owner moved in (as recorded in 2022):
Median year renter moved in (as recorded in 2022):
| Historic Hyde Park North: | 2014 |
| Tampa: | 2013 |
Median year renter moved in (as recorded in 2022):
| Historic Hyde Park North: | 2017 |
| Tampa: | 2020 |
Percentage of married-couple families with both working:
| Historic Hyde Park North: | 31.3% |
| Tampa: | 70.4% |

- 85.9%Electricity
- 7.9%Utility gas
- 6.2%No fuel used
Highways in this neighborhood:
State Hwy 618 (Crosstown Expy)
Length: 0.08 miles
Direction: E-W
Direction: E-W
Roads and streets:
S Rome Ave
Length: 0.67 miles
Directions: N-S, SE-NW, SW-NE
Address range: 600 to 1199
Directions: N-S, SE-NW, SW-NE
Address range: 600 to 1199
W Swann Ave
Length: 0.64 miles
Direction: E-W
Address range: 900 to 1799
Direction: E-W
Address range: 900 to 1799
W de Leon St
Length: 0.57 miles
Direction: E-W
Address range: 900 to 1699
Direction: E-W
Address range: 900 to 1699
W Horatio St
Length: 0.52 miles
Direction: E-W
Address range: 900 to 1905
Direction: E-W
Address range: 900 to 1905
S Albany Ave
Length: 0.48 miles
Directions: N-S, SE-NW
Address range: 1000 to 1599
Directions: N-S, SE-NW
Address range: 1000 to 1599
W Hills Ave
Length: 0.47 miles
Direction: SW-NE
Address range: 1700 to 2198
Direction: SW-NE
Address range: 1700 to 2198
South Blvd
Length: 0.37 miles
Direction: N-S
Address range: 224 to 699
Direction: N-S
Address range: 224 to 699
S Edison Ave
Length: 0.35 miles
Directions: N-S, SE-NW
Address range: 200 to 699
Directions: N-S, SE-NW
Address range: 200 to 699
S Delaware Ave
Length: 0.34 miles
Direction: N-S
Address range: 200 to 699
Direction: N-S
Address range: 200 to 699
S Willow Ave
Length: 0.31 miles
Direction: N-S
Address range: 300 to 699
Direction: N-S
Address range: 300 to 699
S Newport Ave
Length: 0.31 miles
Direction: N-S
Address range: 300 to 699
Direction: N-S
Address range: 300 to 699
Richardson Pl
Length: 0.29 miles
Directions: SE-NW, SW-NE
Address range: 1700 to 1899
Directions: SE-NW, SW-NE
Address range: 1700 to 1899
W Platt St
Length: 0.28 miles
Direction: E-W
Address range: 900 to 1299
Direction: E-W
Address range: 900 to 1299
W Watrous Ave
Length: 0.28 miles
Direction: E-W
Address range: 1700 to 1998
Direction: E-W
Address range: 1700 to 1998
S Fremont Ave
Length: 0.28 miles
Direction: N-S
Address range: 800 to 1199
Direction: N-S
Address range: 800 to 1199
Jetton Ave
Length: 0.28 miles
Direction: E-W
Address range: 1700 to 1899
Direction: E-W
Address range: 1700 to 1899
W Morrison Ave
Length: 0.28 miles
Direction: E-W
Address range: 1700 to 2009
Direction: E-W
Address range: 1700 to 2009
S Orleans Ave
Length: 0.27 miles
Direction: N-S
Address range: 300 to 699
Direction: N-S
Address range: 300 to 699
W Dekle Ave
Length: 0.26 miles
Direction: SW-NE
Address range: 1900 to 2099
Direction: SW-NE
Address range: 1900 to 2099
S Oregon Ave
Length: 0.25 miles
Direction: N-S
Address range: 400 to 699
Direction: N-S
Address range: 400 to 699
S Packwood Ave
Length: 0.25 miles
Direction: N-S
Address range: 700 to 999
Direction: N-S
Address range: 700 to 999
W Bristol Ave
Length: 0.24 miles
Direction: E-W
Address range: 1700 to 2099
Direction: E-W
Address range: 1700 to 2099
Bayshore Blvd
Length: 0.17 miles
Direction: SW-NE
Direction: SW-NE
South Dakota Ave
Length: 0.17 miles
Direction: N-S
Address range: 500 to 699
Direction: N-S
Address range: 500 to 699
de Soto Ave
Length: 0.17 miles
Direction: SE-NW
Address range: 1400 to 1599
Direction: SE-NW
Address range: 1400 to 1599
Nance Ave
Length: 0.17 miles
Direction: SE-NW
Address range: 1400 to 1599
Direction: SE-NW
Address range: 1400 to 1599
W Inman Ave
Length: 0.16 miles
Direction: E-W
Address range: 1700 to 1999
Direction: E-W
Address range: 1700 to 1999
W Azeele St
Length: 0.14 miles
Direction: E-W
Address range: 1300 to 1499
Direction: E-W
Address range: 1300 to 1499
Gunby Ave
Length: 0.12 miles
Direction: SE-NW
Address range: 1300 to 1499
Direction: SE-NW
Address range: 1300 to 1499
W Richardson Pl
Length: 0.09 miles
Direction: SW-NE
Address range: 1900 to 1999
Direction: SW-NE
Address range: 1900 to 1999
S Bruce St
Length: 0.08 miles
Direction: N-S
Address range: 900 to 999
Direction: N-S
Address range: 900 to 999
S Bungalow Ter
Length: 0.08 miles
Direction: N-S
Address range: 700 to 799
Direction: N-S
Address range: 700 to 799
S Gunby Ave
Length: 0.07 miles
Direction: SE-NW
Address range: 1200 to 1299
Direction: SE-NW
Address range: 1200 to 1299