Middle East neighborhood in Baltimore, Maryland (MD), 21231, 21205, 21213 detailed profile
Settings
X


Business Search - 14 Million verified businesses
Area: 0.280 square miles
Population: 7,155
Population density:
| Middle East: | 25,543 people per square mile |
| Baltimore: | 7,053 people per square mile |

- 5,12263.3%Black
- 98712.2%White
- 7108.8%Hispanic or Latino
- 4545.6%Asian
- 3364.1%Two or more races
- 3153.9%Some other race
- 1742.1%American Indian

Distribution of median household income
![Distribution of median household income]()
- 514Less than $10,000
- 519$10,000 to $19,999
- 231$20,000 to $29,999
- 289$30,000 to $39,999
- 293$40,000 to $49,999
- 105$50,000 to $59,999
- 367$60,000 to $74,999
- 202$75,000 to $99,999
- 218$100,000 to $124,999
- 210$125,000 to $149,999
- 282$150,000 to $199,999
- 250$200,000 or more

Distribution of owner-occupied house/condo value
![Distribution of owner-occupied house/condo value]()
- 935Less than $50,000
- 775$50,000 to $99,999
- 304$100,000 to $149,999
- 344$150,000 to $199,999
- 401$200,000 to $249,999
- 156$250,000 to $299,999
- 202$300,000 to $399,999
- 87$400,000 to $499,999
- 151$500,000 to $749,999
- 114$750,000 to $999,999

Distribution of rent paid by renters
![Distribution of rent paid by renters]()
- 154Less than $100
- 135$100 to $199
- 393$200 to $299
- 152$300 to $399
- 1,297$400 to $499
- 306$500 to $599
- 436$600 to $699
- 266$700 to $799
- 200$800 to $899
- 63$900 to $999
- 252$1,000 to $1,249
- 361$1,250 to $1,499
- 374$1,500 to $1,999
- 587$2,000 or more

Median rent in 2022:
| Middle East: | $791 |
| Baltimore: | $1,043 |
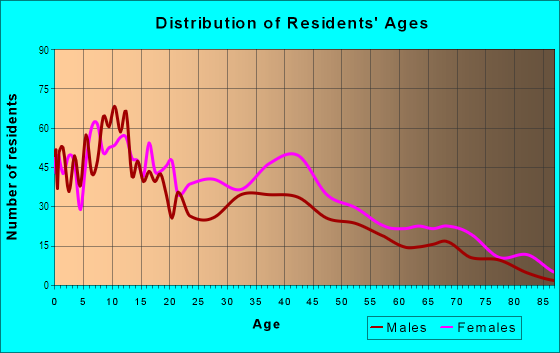
| Males: | 3,183 |
| Females: | 3,972 |
Males:
| This neighborhood: | 29.3 years |
| Whole city: | 35.0 years |
| This neighborhood: | 31.1 years |
| Whole city: | 38.2 years |
Average household size:
| Middle East: | 5.9 people |
| Baltimore: | 2.2 people |
Percentage of family households:
| Middle East: | 44.8% |
| Baltimore: | 34.2% |
| Here: | 16.7% |
| Baltimore: | 23.3% |
Percentage of married-couple families with children (among all households):
| Middle East: | 15.2% |
| Baltimore: | 22.4% |
Percentage of single-mother households (among all households):
| Middle East: | 38.1% |
| Baltimore: | 18.7% |
Percentage of never married males 15 years old and over:
Percentage of never married females 15 years old and over:
| Middle East: | 28.5% |
| Baltimore: | 25.1% |
Percentage of never married females 15 years old and over:
| Middle East: | 34.7% |
| city: | 27.5% |
Percentage of people that speak English not well or not at all:
| Middle East: | 2.1% |
| Baltimore: | 2.3% |
Percentage of people born in this state:
Percentage of people born in another U.S. state:
Percentage of native residents but born outside the U.S.:
Percentage of foreign born residents:
| Here: | 64.2% |
| Baltimore: | 64.4% |
Percentage of people born in another U.S. state:
| Middle East: | 25.7% |
| Baltimore: | 25.0% |
Percentage of native residents but born outside the U.S.:
| Here: | 1.6% |
| city: | 0.9% |
Percentage of foreign born residents:
| Here: | 9.1% |
| Baltimore: | 9.7% |

Owner-occupied
Renter-occupied


- Rooms in owner-occupied houses and condos in Middle East
- 01 room
- 02 rooms
- 513 rooms
- 2354 rooms
- 3325 rooms
- 3016 rooms
- 1607 rooms
- 878 rooms
- 1389+ rooms

- Rooms in renter-occupied apartments in Middle East
- 2471 room
- 6932 rooms
- 2743 rooms
- 4464 rooms
- 2525 rooms
- 7506 rooms
- 477 rooms
- 1108 rooms
- 1179+ rooms
Owner-occupied
Renter-occupied

- Bedrooms in owner-occupied houses and condos in Middle East
- 53no bedroom
- 501 bedroom
- 3742 bedrooms
- 3913 bedrooms
- 2544 bedrooms
- 1365+ bedrooms

- Bedrooms in renter-occupied apartments in Middle East
- 247no bedroom
- 5361 bedroom
- 7262 bedrooms
- 8833 bedrooms
- 1214 bedrooms
- 585+ bedrooms
Average number of cars or other vehicles available in houses/condos:
Average number of cars or other vehicles available in apartments:
| This neighborhood: | 2.4 |
| Baltimore: | 1.5 |
Average number of cars or other vehicles available in apartments:
| Here: | |
| city: |
Percentage of units with a mortgage:
| Middle East: | 57.9% |
| Baltimore: | 64.3% |
Average estimated value of townhouses or other attached units in 2022 (59.8% of all units):
| This neighborhood: | $230,600 |
| city: | $206,258 |

- Year house built in Middle East
- 1512020 or later
- 6252010 to 2019
- 4332000 to 2009
- 1791990 to 1999
- 3431980 to 1989
- 3011970 to 1979
- 1671960 to 1969
- 2201950 to 1959
- 4241940 to 1949
- 9821939 or earlier

Travel time to work (commute)
![Travel time to work (commute)]()
- 36Less than 5 minutes
- 2405 to 9 minutes
- 20110 to 14 minutes
- 33615 to 19 minutes
- 27020 to 24 minutes
- 11125 to 29 minutes
- 26030 to 34 minutes
- 6835 to 39 minutes
- 5740 to 44 minutes
- 28945 to 59 minutes
- 21360 to 89 minutes
- 10790 or more minutes

Means of transportation to work
![Means of transportation to work]()
- 36.2%1,041Drove a car alone
- 13.5%389Carpooled
- 12.5%359Bus
- 15.8%454Subway or elevated rail
- 1.1%32Long-distance train or commuter rail
- 1.8%53Light rail, streetcar or trolley
- 1.0%30Bicycle
- 18.8%541Walked
- 3.6%104Other means
- 18.4%529Worked at home

Time leaving home to go to work
![Time leaving home to go to work]()
- 10512:00 a.m. to 4:59 a.m.
- 1525:00 a.m. to 5:29 a.m.
- 1735:30 a.m. to 5:59 a.m.
- 1556:00 a.m. to 6:29 a.m.
- 1346:30 a.m. to 6:59 a.m.
- 1837:00 a.m. to 7:29 a.m.
- 1737:30 a.m. to 7:59 a.m.
- 2108:00 a.m. to 8:29 a.m.
- 1628:30 a.m. to 8:59 a.m.
- 1649:00 a.m. to 9:59 a.m.
- 5310:00 a.m. to 10:59 a.m.
- 8211:00 a.m. to 11:59 a.m.
- 15812:00 p.m. to 3:59 p.m.
- 2314:00 p.m. to 11:59 p.m.

Occupations of males:
- Percentage of males in management occupations (except farmers):
Here: 12.8% city: 10.7%
- Percentage of males in computer and mathematical occupations:
Here: 11.8% city: 6.1%
- Percentage of males in architecture and engineering occupations:
Here: 1.6% city: 2.9%
- Percentage of males in life, physical, and social science occupations:
Here: 2.8% city: 2.3%
- Percentage of males in community and social services occupations:
Here: 2.3% city: 1.6%
- Percentage of males in education, training, and library occupations:
Here: 3.3% city: 5.4%
- Percentage of males in arts, design, entertainment, sports, and media occupations:
Here: 2.7% city: 2.8%
- Percentage of males in healthcare practitioners and technical occupations:
Here: 9.9% city: 4.0%
- Percentage of males in service occupations:
Here: 22.2% city: 14.7%
- Percentage of males in sales and office occupations:
Here: 11.8% city: 14.2%
- Percentage of males in production occupations:
Here: 1.8% city: 4.2%
- Percentage of males in transportation occupations:
Here: 4.5% city: 6.8%
- Percentage of males in material moving occupations:
Here: 7.3% city: 7.0%
Occupations of females:
- Percentage of females in management occupations (except farmers):
Here: 9.5% city: 10.1%
- Percentage of females in business and financial operations occupations:
Here: 8.0% city: 6.6%
- Percentage of females in architecture and engineering occupations:
Here: 1.1% city: 0.9%
- Percentage of females in life, physical, and social science occupations:
Here: 5.1% city: 2.5%
- Percentage of females in community and social services occupations:
Here: 6.0% city: 3.6%
- Percentage of females in legal occupations:
Here: 2.7% city: 1.8%
- Percentage of females in education, training, and library occupations:
Here: 6.1% city: 10.7%
- Percentage of females in arts, design, entertainment, sports, and media occupations:
Here: 2.0% city: 2.4%
- Percentage of females in healthcare practitioners and technical occupations:
Here: 19.7% city: 9.8%
- Percentage of females in service occupations:
Here: 19.0% city: 20.4%
- Percentage of females in sales and office occupations:
Here: 18.4% city: 22.3%
Percentage of people 16-64 in Armed Forces:
| Middle East: | 0.2% |
| Baltimore: | 0.4% |
Education in this neighborhood (subdivision or community):
- Percentage of people 3 years and older in K-12 schools:
Middle East: 35.6% Baltimore: 14.7%
- Percentage of people 3 years and older in undergraduate colleges:
Middle East: 4.7% Baltimore: 6.0%
- Percentage of people 3 years and older in grad. or professional schools:
Middle East: 9.5% Baltimore: 2.8%
- Percentage of students K-12 enrolled in private schools:
Middle East: 50.6% Baltimore: 12.7%
Percentage of population below poverty level:
| Middle East: | 24.6% |
| Baltimore: | 18.5% |
Median year renter moved in (as recorded in 2022):
| Middle East: | 2017 |
| Baltimore: | 2019 |
Percentage of married-couple families with both working:
| Middle East: | 120.5% |
| Baltimore: | 79.2% |

- 45.5%Utility gas
- 43.6%Electricity
- 3.6%Fuel oil, kerosene, etc.
- 3.4%Bottled, tank, or LP gas
- 2.2%No fuel used
- 1.7%Solar energy
Highways in this neighborhood:
US Hwy 40 (Orleans St)
Length: 0.35 miles
Direction: E-W
Address range: 1921 to 2299
Direction: E-W
Address range: 1921 to 2299
Roads and streets:
N Patterson Park Ave
Length: 0.71 miles
Direction: N-S
Address range: 200 to 1199
Direction: N-S
Address range: 200 to 1199
N Collington Ave
Length: 0.71 miles
Direction: N-S
Address range: 200 to 1199
Direction: N-S
Address range: 200 to 1199
N Castle St
Length: 0.64 miles
Direction: N-S
Address range: 200 to 1099
Direction: N-S
Address range: 200 to 1099
N Chester St
Length: 0.64 miles
Direction: N-S
Address range: 200 to 1099
Direction: N-S
Address range: 200 to 1099
Ashland Ave
Length: 0.56 miles
Direction: E-W
Address range: 1716 to 2299
Direction: E-W
Address range: 1716 to 2299
E Chase St
Length: 0.56 miles
Direction: E-W
Address range: 1714 to 2299
Direction: E-W
Address range: 1714 to 2299
E Madison St
Length: 0.56 miles
Direction: E-W
Address range: 1712 to 2299
Direction: E-W
Address range: 1712 to 2299
N Duncan St
Length: 0.55 miles
Direction: N-S
Address range: 200 to 999
Direction: N-S
Address range: 200 to 999
E Eager St
Length: 0.54 miles
Direction: E-W
Address range: 1712 to 2299
Direction: E-W
Address range: 1712 to 2299
N Madeira St
Length: 0.52 miles
Direction: N-S
Address range: 200 to 999
Direction: N-S
Address range: 200 to 999
N Washington St
Length: 0.44 miles
Direction: N-S
Address range: 200 to 1099
Direction: N-S
Address range: 200 to 1099
N Chapel St
Length: 0.37 miles
Direction: N-S
Address range: 200 to 1099
Direction: N-S
Address range: 200 to 1099
Mc Donogh St
Length: 0.33 miles
Direction: N-S
Address range: 800 to 1199
Direction: N-S
Address range: 800 to 1199
E Monument St
Length: 0.31 miles
Direction: E-W
Address range: 2000 to 2305
Direction: E-W
Address range: 2000 to 2305
E Fayette St
Length: 0.29 miles
Direction: E-W
Address range: 1914 to 2299
Direction: E-W
Address range: 1914 to 2299
N Wolfe St
Length: 0.29 miles
Direction: N-S
Address range: 800 to 1109
Direction: N-S
Address range: 800 to 1109
Rutland Ave
Length: 0.29 miles
Direction: N-S
Address range: 800 to 1109
Direction: N-S
Address range: 800 to 1109
Jefferson St
Length: 0.28 miles
Direction: E-W
Address range: 2008 to 2299
Direction: E-W
Address range: 2008 to 2299
Mc Elderry St
Length: 0.27 miles
Direction: E-W
Address range: 2011 to 2299
Direction: E-W
Address range: 2011 to 2299
N Durham St
Length: 0.26 miles
Direction: N-S
Address range: 800 to 1099
Direction: N-S
Address range: 800 to 1099
Henneman Ave
Length: 0.19 miles
Direction: E-W
Address range: 1800 to 2299
Direction: E-W
Address range: 1800 to 2299
E Biddle St
Length: 0.14 miles
Direction: E-W
Address range: 1700 to 2299
Direction: E-W
Address range: 1700 to 2299
Mullikin St
Length: 0.10 miles
Direction: E-W
Address range: 2200 to 2299
Direction: E-W
Address range: 2200 to 2299
Prentiss Pl
Length: 0.10 miles
Direction: E-W
Address range: 2200 to 2299
Direction: E-W
Address range: 2200 to 2299
Shuter St
Length: 0.09 miles
Direction: N-S
Address range: 800 to 999
Direction: N-S
Address range: 800 to 999
Barnes St
Length: 0.07 miles
Direction: E-W
Address range: 1701 to 1799
Direction: E-W
Address range: 1701 to 1799
Railroad features:
Penn Central RR
Length: 0.24 miles
Directions: E-W, SE-NW
Directions: E-W, SE-NW