North Del Ave Club District neighborhood in Philadelphia, Pennsylvania (PA), 19106, 19123 detailed profile
Settings
X


Business Search - 14 Million verified businesses
Area: 0.054 square miles
Population: 33
Population density:
| North Del Ave Club District: | 616 people per square mile |
| Philadelphia: | 11,602 people per square mile |

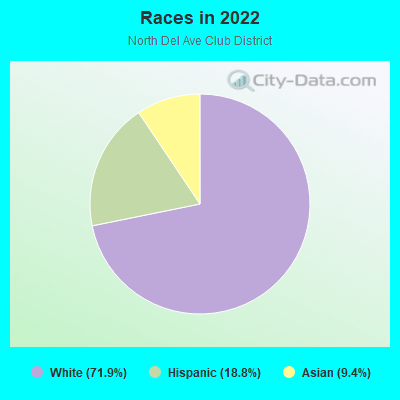
- 2371.9%White
- 618.8%Hispanic or Latino
- 39.4%Asian
Median household income in 2022:
| North Del Ave Club District: | $217,938 |
| Philadelphia: | $56,517 |
Distribution of median household income
![Distribution of median household income]()
- 2Less than $10,000
- 2$10,000 to $19,999
- 1$20,000 to $29,999
- 4$30,000 to $39,999
- 1$40,000 to $49,999
- 1$60,000 to $74,999
- 2$75,000 to $99,999
- 1$100,000 to $124,999
- 4$125,000 to $149,999
- 4$150,000 to $199,999
- 6$200,000 or more

Distribution of owner-occupied house/condo value
![Distribution of owner-occupied house/condo value]()
- 1$150,000 to $199,999
- 2$200,000 to $249,999
- 1$300,000 to $399,999
- 6$400,000 to $499,999
- 3$500,000 to $749,999
- 4$750,000 to $999,999
- 2$1,000,000 or more

Distribution of rent paid by renters
![Distribution of rent paid by renters]()
- 1$800 to $899
- 9$1,000 to $1,249
- 1$1,250 to $1,499
- 2$1,500 to $1,999
- 10$2,000 or more

Median rent in 2022:
| North Del Ave Club District: | $3,125 |
| Philadelphia: | $1,073 |
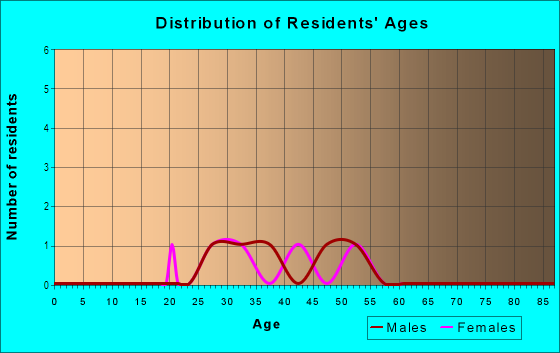
| Males: | 18 |
| Females: | 15 |
Males:
| This neighborhood: | 31.8 years |
| Whole city: | 34.1 years |
| This neighborhood: | 30.8 years |
| Whole city: | 36.3 years |
Average household size:
| North Del Ave Club District: | 3.0 people |
| Philadelphia: | 2.2 people |
Percentage of family households:
| North Del Ave Club District: | 50.3% |
| Philadelphia: | 36.5% |
| Here: | 57.4% |
| Philadelphia: | 28.0% |
Percentage of married-couple families with children (among all households):
| North Del Ave Club District: | 34.2% |
| Philadelphia: | 23.5% |
Percentage of single-mother households (among all households):
| North Del Ave Club District: | 0.0% |
| Philadelphia: | 17.6% |
Percentage of never married males 15 years old and over:
Percentage of never married females 15 years old and over:
| North Del Ave Club District: | 30.5% |
| Philadelphia: | 23.9% |
Percentage of never married females 15 years old and over:
| North Del Ave Club District: | 11.5% |
| city: | 26.0% |
Percentage of people that speak English not well or not at all:
| North Del Ave Club District: | 0.0% |
| Philadelphia: | 7.0% |
Percentage of people born in this state:
Percentage of people born in another U.S. state:
Percentage of native residents but born outside the U.S.:
Percentage of foreign born residents:
| Here: | 46.2% |
| Philadelphia: | 61.6% |
Percentage of people born in another U.S. state:
| North Del Ave Club District: | 28.9% |
| Philadelphia: | 18.9% |
Percentage of native residents but born outside the U.S.:
| Here: | 6.5% |
| city: | 3.7% |
Percentage of foreign born residents:
| Here: | 18.4% |
| Philadelphia: | 15.7% |
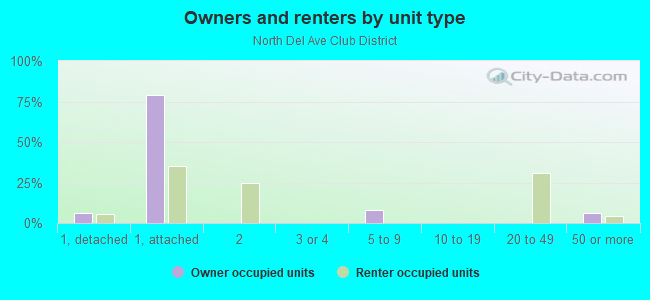
Owner-occupied
Renter-occupied

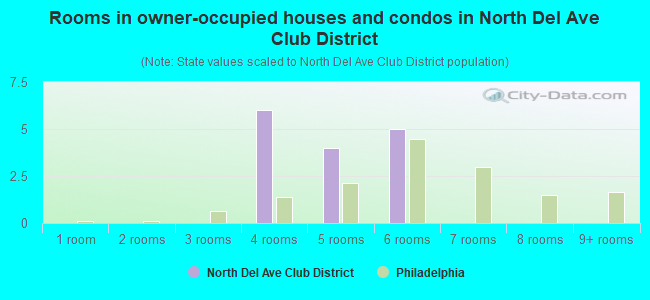
- Rooms in owner-occupied houses and condos in North Del Ave Club District
- 01 room
- 02 rooms
- 03 rooms
- 64 rooms
- 45 rooms
- 56 rooms
- 07 rooms
- 08 rooms
- 09+ rooms
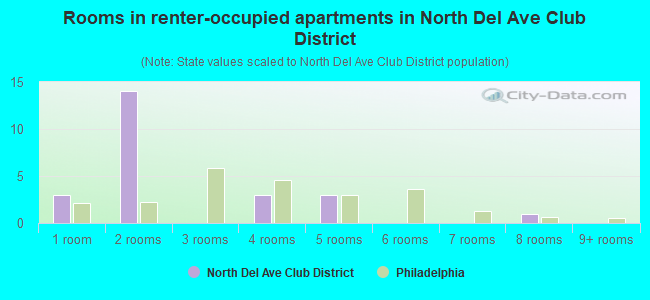
- Rooms in renter-occupied apartments in North Del Ave Club District
- 31 room
- 142 rooms
- 03 rooms
- 34 rooms
- 35 rooms
- 06 rooms
- 07 rooms
- 18 rooms
- 09+ rooms
Owner-occupied
Renter-occupied
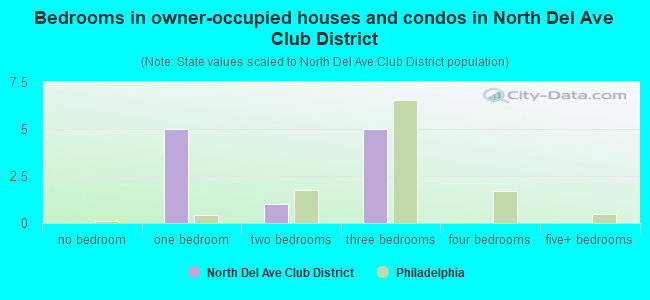
- Bedrooms in owner-occupied houses and condos in North Del Ave Club District
- 0no bedroom
- 51 bedroom
- 12 bedrooms
- 53 bedrooms
- 04 bedrooms
- 05+ bedrooms
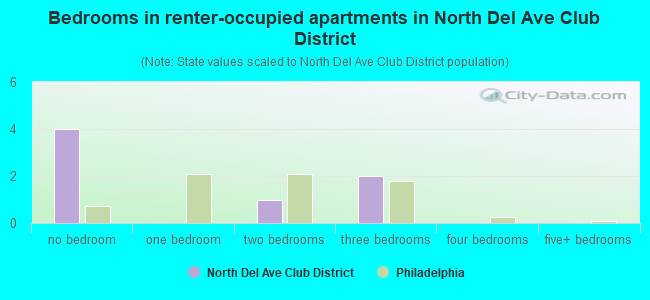
- Bedrooms in renter-occupied apartments in North Del Ave Club District
- 4no bedroom
- 01 bedroom
- 12 bedrooms
- 23 bedrooms
- 04 bedrooms
- 05+ bedrooms
Average number of cars or other vehicles available in houses/condos:
Average number of cars or other vehicles available in apartments:
| This neighborhood: | 1.5 |
| Philadelphia: | 1.3 |
Average number of cars or other vehicles available in apartments:
| Here: | 1.7 |
| city: | 0.8 |
Percentage of units with a mortgage:
| North Del Ave Club District: | 70.9% |
| Philadelphia: | 58.9% |

- Year house built in North Del Ave Club District
- 02020 or later
- 42010 to 2019
- 22000 to 2009
- 41990 to 1999
- 11980 to 1989
- 91970 to 1979
- 01960 to 1969
- 01950 to 1959
- 21940 to 1949
- 21939 or earlier
City-data.com crime index for city in 2020 (higher means more crime):
| City: | 169.8 |
| U.S. average: | 219.5 |
Travel time to work (commute)
![Travel time to work (commute)]()
- 610 to 14 minutes
- 1815 to 19 minutes
- 1020 to 24 minutes
- 325 to 29 minutes
- 1530 to 34 minutes
- 540 to 44 minutes
- 245 to 59 minutes
- 260 to 89 minutes
- 190 or more minutes

Means of transportation to work
![Means of transportation to work]()
- 38.0%8Drove a car alone
- 4.7%1Bus
- 14.2%3Subway or elevated rail
- 23.7%5Taxi
- 14.2%3Walked
- 4.7%1Other means
- 23.7%5Worked at home

Time leaving home to go to work
![Time leaving home to go to work]()
- 412:00 a.m. to 4:59 a.m.
- 15:30 a.m. to 5:59 a.m.
- 36:00 a.m. to 6:29 a.m.
- 36:30 a.m. to 6:59 a.m.
- 97:00 a.m. to 7:29 a.m.
- 117:30 a.m. to 7:59 a.m.
- 198:00 a.m. to 8:29 a.m.
- 38:30 a.m. to 8:59 a.m.
- 89:00 a.m. to 9:59 a.m.
- 512:00 p.m. to 3:59 p.m.
- 14:00 p.m. to 11:59 p.m.

Occupations of males:
- Percentage of males in management occupations (except farmers):
Here: 8.5% city: 9.1%
- Percentage of males in business and financial operations occupations:
Here: 14.1% city: 6.0%
- Percentage of males in computer and mathematical occupations:
Here: 4.7% city: 4.6%
- Percentage of males in architecture and engineering occupations:
Here: 12.8% city: 2.4%
- Percentage of males in life, physical, and social science occupations:
Here: 3.4% city: 1.7%
- Percentage of males in legal occupations:
Here: 20.9% city: 1.8%
- Percentage of males in education, training, and library occupations:
Here: 1.7% city: 4.0%
- Percentage of males in arts, design, entertainment, sports, and media occupations:
Here: 8.6% city: 2.5%
- Percentage of males in healthcare practitioners and technical occupations:
Here: 14.5% city: 4.3%
- Percentage of males in service occupations:
Here: 14.1% city: 19.3%
- Percentage of males in sales and office occupations:
Here: 38.0% city: 14.1%
- Percentage of males in production occupations:
Here: 2.1% city: 5.0%
- Percentage of males in transportation occupations:
Here: 27.7% city: 6.9%
- Percentage of males in material moving occupations:
Here: 7.3% city: 6.2%
Occupations of females:
- Percentage of females in management occupations (except farmers):
Here: 26.2% city: 9.1%
- Percentage of females in business and financial operations occupations:
Here: 8.7% city: 6.6%
- Percentage of females in computer and mathematical occupations:
Here: 6.8% city: 1.7%
- Percentage of females in architecture and engineering occupations:
Here: 7.6% city: 0.7%
- Percentage of females in education, training, and library occupations:
Here: 15.9% city: 8.5%
- Percentage of females in arts, design, entertainment, sports, and media occupations:
Here: 19.4% city: 2.4%
- Percentage of females in healthcare practitioners and technical occupations:
Here: 39.7% city: 10.3%
- Percentage of females in service occupations:
Here: 64.1% city: 24.4%
- Percentage of females in sales and office occupations:
Here: 4.0% city: 23.4%
- Percentage of females in transportation occupations:
Here: 5.6% city: 1.1%
Percentage of people 16-64 in Armed Forces:
| North Del Ave Club District: | 0.3% |
| Philadelphia: | 0.1% |
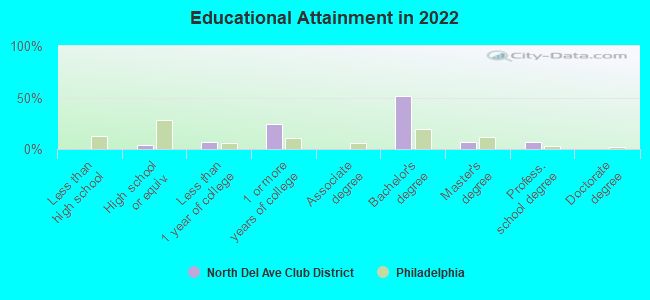
Education in this neighborhood (subdivision or community):
- Percentage of people 3 years and older in K-12 schools:
North Del Ave Club District: 0.0% Philadelphia: 15.6%
- Percentage of people 3 years and older in undergraduate colleges:
North Del Ave Club District: 27.6% Philadelphia: 6.0%
- Percentage of people 3 years and older in grad. or professional schools:
North Del Ave Club District: 0.0% Philadelphia: 2.8%
Percentage of population below poverty level:
| North Del Ave Club District: | 3.0% |
| Philadelphia: | 21.7% |
Median year owner moved in (as recorded in 2022):
Median year renter moved in (as recorded in 2022):
| North Del Ave Club District: | 2015 |
| Philadelphia: | 2007 |
Median year renter moved in (as recorded in 2022):
| North Del Ave Club District: | 2022 |
| Philadelphia: | 2019 |
Percentage of married-couple families with both working:
| North Del Ave Club District: | 100.0% |
| Philadelphia: | 71.4% |
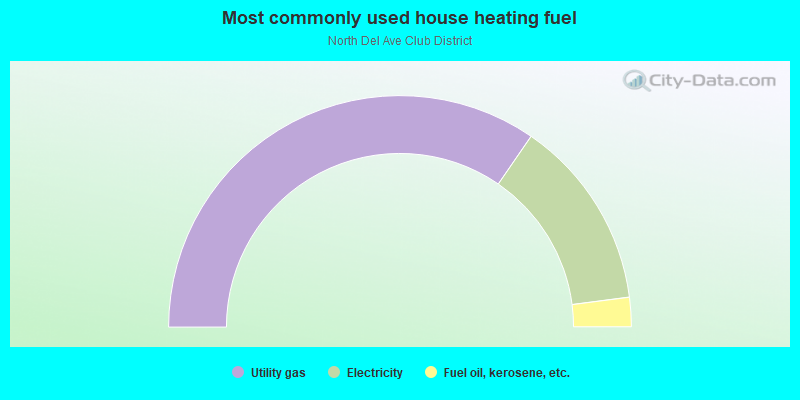
- 69.2%Utility gas
- 26.7%Electricity
- 4.1%Fuel oil, kerosene, etc.
Limited-access highways (interstate or state) in this neighborhood:
Benjamin Franklin Brg (US Hwy 30, I- 676)
Length: 0.04 miles
Direction: E-W
Direction: E-W
Highways in this neighborhood:
Delaware Ave (N Columbus Blvd)
Length: 0.60 miles
Directions: N-S, SW-NE
Address range: 3 to 714
Directions: N-S, SW-NE
Address range: 3 to 714
Spring Garden St
Length: 0.12 miles
Direction: E-W
Address range: 2 to 48
Direction: E-W
Address range: 2 to 48
Roads and streets:
N Beach St
Length: 0.16 miles
Direction: N-S
Address range: 500 to 799
Direction: N-S
Address range: 500 to 799
N Piers
Length: 0.06 miles
Direction: N-S
Address range: 1 to 99
Direction: N-S
Address range: 1 to 99
Fairmount Ave
Length: 0.06 miles
Direction: E-W
Address range: 1 to 49
Direction: E-W
Address range: 1 to 49
Noble St
Length: 0.06 miles
Direction: E-W
Direction: E-W
N Water St
Length: 0.06 miles
Directions: N-S, SW-NE
Directions: N-S, SW-NE
Race St
Length: 0.05 miles
Direction: E-W
Address range: 1 to 77
Direction: E-W
Address range: 1 to 77
Vine St
Length: 0.04 miles
Direction: E-W
Address range: 1 to 49
Direction: E-W
Address range: 1 to 49
Railroad features:
Penn Central RR (Norfolk Southern Rlwy)
Length: 0.08 miles
Direction: N-S
Direction: N-S