Ten Hills neighborhood in Baltimore, Maryland (MD), 21229 detailed profile
Settings
X


Business Search - 14 Million verified businesses
Area: 0.319 square miles
Population: 2,081
Population density:
| Ten Hills: | 6,524 people per square mile |
| Baltimore: | 7,053 people per square mile |

- 1,31443.5%Hispanic or Latino
- 1,26441.8%Black
- 30810.2%White
- 1043.4%Two or more races
- 210.7%Asian
- 110.4%American Indian

Distribution of median household income
![Distribution of median household income]()
- 24Less than $10,000
- 83$10,000 to $19,999
- 133$20,000 to $29,999
- 362$30,000 to $39,999
- 261$40,000 to $49,999
- 64$50,000 to $59,999
- 177$60,000 to $74,999
- 132$75,000 to $99,999
- 23$100,000 to $124,999
- 82$125,000 to $149,999
- 101$150,000 to $199,999
- 55$200,000 or more

Distribution of owner-occupied house/condo value
![Distribution of owner-occupied house/condo value]()
- 79Less than $50,000
- 42$50,000 to $99,999
- 92$100,000 to $149,999
- 113$150,000 to $199,999
- 151$200,000 to $249,999
- 89$250,000 to $299,999
- 138$300,000 to $399,999
- 45$400,000 to $499,999
- 18$500,000 to $749,999
- 7$750,000 to $999,999
- 3$1,000,000 or more

Distribution of rent paid by renters
![Distribution of rent paid by renters]()
- 100Less than $100
- 154$100 to $199
- 20$200 to $299
- 6$500 to $599
- 28$600 to $699
- 176$700 to $799
- 79$800 to $899
- 54$900 to $999
- 408$1,000 to $1,249
- 69$1,250 to $1,499
- 42$1,500 to $1,999
- 10$2,000 or more

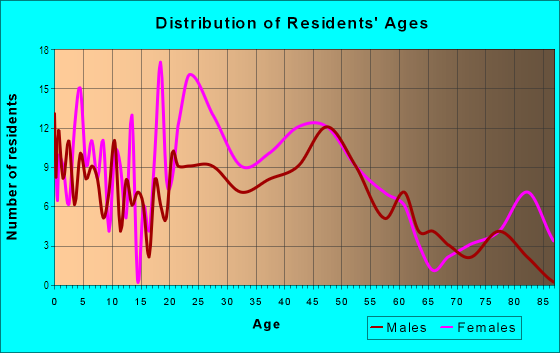
| Males: | 1,177 |
| Females: | 904 |
Males:
| This neighborhood: | 39.7 years |
| Whole city: | 35.0 years |
| This neighborhood: | 50.3 years |
| Whole city: | 38.2 years |
Average household size:
| Ten Hills: | 9.6 people |
| Baltimore: | 2.2 people |
Percentage of family households:
| Ten Hills: | 26.9% |
| Baltimore: | 34.2% |
| Here: | 25.8% |
| Baltimore: | 23.3% |
Percentage of married-couple families with children (among all households):
| Ten Hills: | 43.5% |
| Baltimore: | 22.4% |
Percentage of single-mother households (among all households):
| Ten Hills: | 4.0% |
| Baltimore: | 18.7% |
Percentage of never married males 15 years old and over:
Percentage of never married females 15 years old and over:
| Ten Hills: | 23.9% |
| Baltimore: | 25.1% |
Percentage of never married females 15 years old and over:
| Ten Hills: | 7.3% |
| city: | 27.5% |
Percentage of people that speak English not well or not at all:
| Ten Hills: | 1.4% |
| Baltimore: | 2.3% |
Percentage of people born in this state:
Percentage of people born in another U.S. state:
Percentage of native residents but born outside the U.S.:
Percentage of foreign born residents:
| Here: | 68.7% |
| Baltimore: | 64.4% |
Percentage of people born in another U.S. state:
| Ten Hills: | 25.9% |
| Baltimore: | 25.0% |
Percentage of native residents but born outside the U.S.:
| Here: | 2.2% |
| city: | 0.9% |
Percentage of foreign born residents:
| Here: | 3.2% |
| Baltimore: | 9.7% |

Owner-occupied
Renter-occupied


- Rooms in owner-occupied houses and condos in Ten Hills
- 01 room
- 02 rooms
- 433 rooms
- 364 rooms
- 265 rooms
- 1706 rooms
- 1847 rooms
- 1218 rooms
- 659+ rooms

- Rooms in renter-occupied apartments in Ten Hills
- 3361 room
- 192 rooms
- 1643 rooms
- 2984 rooms
- 1385 rooms
- 1776 rooms
- 77 rooms
- 38 rooms
- 419+ rooms
Owner-occupied
Renter-occupied

- Bedrooms in owner-occupied houses and condos in Ten Hills
- 0no bedroom
- 141 bedroom
- 342 bedrooms
- 2933 bedrooms
- 394 bedrooms
- 485+ bedrooms

- Bedrooms in renter-occupied apartments in Ten Hills
- 336no bedroom
- 2351 bedroom
- 2712 bedrooms
- 1153 bedrooms
- 334 bedrooms
- 05+ bedrooms
Average number of cars or other vehicles available in houses/condos:
Average number of cars or other vehicles available in apartments:
| This neighborhood: | 1.8 |
| Baltimore: | 1.5 |
Average number of cars or other vehicles available in apartments:
| Here: | |
| city: |
Percentage of units with a mortgage:
| Ten Hills: | 73.1% |
| Baltimore: | 64.3% |
Housing prices:
- Average estimated value of detached houses in 2022 (28.2% of all units):
Ten Hills: $328,425 Baltimore: $350,815
- Average estimated value of townhouses or other attached units in 2022 (17.7% of all units):
This neighborhood: $217,901 city: $206,258

- Year house built in Ten Hills
- 02020 or later
- 4332010 to 2019
- 992000 to 2009
- 1141990 to 1999
- 471980 to 1989
- 1161970 to 1979
- 1191960 to 1969
- 2471950 to 1959
- 2801940 to 1949
- 3691939 or earlier

Travel time to work (commute)
![Travel time to work (commute)]()
- 175 to 9 minutes
- 1710 to 14 minutes
- 4315 to 19 minutes
- 11320 to 24 minutes
- 1525 to 29 minutes
- 13230 to 34 minutes
- 5835 to 39 minutes
- 1840 to 44 minutes
- 4945 to 59 minutes
- 2060 to 89 minutes
- 790 or more minutes

Means of transportation to work
![Means of transportation to work]()
- 65.6%637Drove a car alone
- 3.6%35Carpooled
- 9.4%91Bus
- 3.6%35Subway or elevated rail
- 3.7%36Long-distance train or commuter rail
- 6.2%60Taxi
- 2.3%22Bicycle
- 22.8%221Other means
- 24.0%233Worked at home

Time leaving home to go to work
![Time leaving home to go to work]()
- 2212:00 a.m. to 4:59 a.m.
- 25:00 a.m. to 5:29 a.m.
- 295:30 a.m. to 5:59 a.m.
- 926:00 a.m. to 6:29 a.m.
- 686:30 a.m. to 6:59 a.m.
- 597:00 a.m. to 7:29 a.m.
- 467:30 a.m. to 7:59 a.m.
- 128:00 a.m. to 8:29 a.m.
- 98:30 a.m. to 8:59 a.m.
- 189:00 a.m. to 9:59 a.m.
- 710:00 a.m. to 10:59 a.m.
- 3211:00 a.m. to 11:59 a.m.
- 2412:00 p.m. to 3:59 p.m.
- 804:00 p.m. to 11:59 p.m.

Occupations of males:
- Percentage of males in management occupations (except farmers):
Here: 4.8% city: 10.7%
- Percentage of males in business and financial operations occupations:
Here: 13.4% city: 5.9%
- Percentage of males in computer and mathematical occupations:
Here: 12.5% city: 6.1%
- Percentage of males in architecture and engineering occupations:
Here: 1.4% city: 2.9%
- Percentage of males in life, physical, and social science occupations:
Here: 1.1% city: 2.3%
- Percentage of males in community and social services occupations:
Here: 1.6% city: 1.6%
- Percentage of males in education, training, and library occupations:
Here: 2.4% city: 5.4%
- Percentage of males in service occupations:
Here: 4.2% city: 14.7%
- Percentage of males in sales and office occupations:
Here: 21.4% city: 14.2%
- Percentage of males in production occupations:
Here: 8.4% city: 4.2%
- Percentage of males in transportation occupations:
Here: 3.6% city: 6.8%
- Percentage of males in material moving occupations:
Here: 8.3% city: 7.0%
Occupations of females:
- Percentage of females in management occupations (except farmers):
Here: 10.2% city: 10.1%
- Percentage of females in business and financial operations occupations:
Here: 5.7% city: 6.6%
- Percentage of females in computer and mathematical occupations:
Here: 3.6% city: 2.4%
- Percentage of females in legal occupations:
Here: 26.6% city: 1.8%
- Percentage of females in education, training, and library occupations:
Here: 11.2% city: 10.7%
- Percentage of females in healthcare practitioners and technical occupations:
Here: 4.9% city: 9.8%
- Percentage of females in service occupations:
Here: 9.6% city: 20.4%
- Percentage of females in sales and office occupations:
Here: 18.2% city: 22.3%
- Percentage of females in production occupations:
Here: 9.2% city: 2.3%
Percentage of people 16-64 in Armed Forces:
| Ten Hills: | 0.0% |
| Baltimore: | 0.4% |
Education in this neighborhood (subdivision or community):
- Percentage of people 3 years and older in K-12 schools:
Ten Hills: 40.4% Baltimore: 14.7%
- Percentage of people 3 years and older in undergraduate colleges:
Ten Hills: 4.3% Baltimore: 6.0%
- Percentage of people 3 years and older in grad. or professional schools:
Ten Hills: 3.5% Baltimore: 2.8%
- Percentage of students K-12 enrolled in private schools:
Ten Hills: 59.2% Baltimore: 12.7%
Percentage of population below poverty level:
| Ten Hills: | 15.7% |
| Baltimore: | 18.5% |
Median year owner moved in (as recorded in 2022):
| Ten Hills: | 2008 |
| Baltimore: | 2009 |
Percentage of married-couple families with both working:
| Ten Hills: | 171.6% |
| Baltimore: | 79.2% |

- 63.4%Utility gas
- 20.6%Electricity
- 11.6%Fuel oil, kerosene, etc.
- 2.2%Bottled, tank, or LP gas
- 2.2%No fuel used
Roads and streets:
Edmondson Ave
Length: 0.84 miles
Directions: E-W, SW-NE
Address range: 4711 to 4931
Directions: E-W, SW-NE
Address range: 4711 to 4931
Woodside Rd
Length: 0.60 miles
Directions: E-W, SE-NW
Address range: 4805 to 5199
Directions: E-W, SE-NW
Address range: 4805 to 5199
Nottingham Rd
Length: 0.58 miles
Directions: E-W, N-S, SE-NW, SW-NE
Address range: 300 to 593
Directions: E-W, N-S, SE-NW, SW-NE
Address range: 300 to 593
N Chapel Gate Ln
Length: 0.47 miles
Directions: N-S, SE-NW
Address range: 366 to 589
Directions: N-S, SE-NW
Address range: 366 to 589
Old Orchard Rd
Length: 0.43 miles
Directions: E-W, N-S, SE-NW, SW-NE
Address range: 400 to 593
Directions: E-W, N-S, SE-NW, SW-NE
Address range: 400 to 593
Drury Ln
Length: 0.35 miles
Directions: N-S, SE-NW
Address range: 400 to 587
Directions: N-S, SE-NW
Address range: 400 to 587
Stamford Rd
Length: 0.25 miles
Directions: E-W, SE-NW
Address range: 502 to 589
Directions: E-W, SE-NW
Address range: 502 to 589
Kensington Rd
Length: 0.24 miles
Directions: E-W, N-S, SE-NW, SW-NE
Address range: 401 to 439
Directions: E-W, N-S, SE-NW, SW-NE
Address range: 401 to 439
Westgate Rd
Length: 0.17 miles
Direction: SE-NW
Address range: 400 to 499
Direction: SE-NW
Address range: 400 to 499
Brock Green Rd
Length: 0.12 miles
Directions: E-W, SW-NE
Directions: E-W, SW-NE
S Wickham Rd
Length: 0.12 miles
Direction: N-S
Address range: 78 to 255
Direction: N-S
Address range: 78 to 255
Overdale Rd
Length: 0.11 miles
Directions: N-S, SE-NW
Address range: 500 to 599
Directions: N-S, SE-NW
Address range: 500 to 599