Races in Glen Burnie, Maryland (MD) Detailed Stats
Data:
Races - White alone (%)
Races - White alone (% change since 2000)
Races - Black alone (%)
Races - Black alone (% change since 2000)
Races - American Indian alone (%)
Races - American Indian alone (% change since 2000)
Races - Asian alone (%)
Races - Asian alone (% change since 2000)
Races - Hispanic (%)
Races - Hispanic (% change since 2000)
Races - Native Hawaiian and Other Pacific Islander alone (%)
Races - Native Hawaiian and Other Pacific Islander alone (% change since 2000)
Races - Two or more races(%)
Races - Two or more races(% change since 2000)
Races - Other race alone (%)
Races - Other race alone (% change since 2000)
Racial diversity
Place of birth - Born in state of residence (%)
Place of birth - Born in state of residence (%) - White
Place of birth - Born in state of residence (%) - Black or African American
Place of birth - Born in state of residence (%) - Asian
Place of birth - Born in state of residence (%) - Hispanic or Latino
Place of birth - Born in state of residence (%) - American Indian and Alaska Native
Place of birth - Born in state of residence (%) - Multirace
Place of birth - Born in state of residence (%) - Other Race
Place of birth - Born in other state (%)
Place of birth - Born in other state (%) - White
Place of birth - Born in other state (%) - Black or African American
Place of birth - Born in other state (%) - Asian
Place of birth - Born in other state (%) - Hispanic or Latino
Place of birth - Born in other state (%) - American Indian and Alaska Native
Place of birth - Born in other state (%) - Multirace
Place of birth - Born in other state (%) - Other Race
Place of birth - Native, outside of US (%)
Place of birth - Native, outside of US (%) - White
Place of birth - Native, outside of US (%) - Black or African American
Place of birth - Native, outside of US (%) - Asian
Place of birth - Native, outside of US (%) - Hispanic or Latino
Place of birth - Native, outside of US (%) - American Indian and Alaska Native
Place of birth - Native, outside of US (%) - Multirace
Place of birth - Native, outside of US (%) - Other Race
Place of birth - Foreign born (%)
Place of birth - Foreign born (%) - White
Place of birth - Foreign born (%) - Black or African American
Place of birth - Foreign born (%) - Asian
Place of birth - Foreign born (%) - Hispanic or Latino
Place of birth - Foreign born (%) - American Indian and Alaska Native
Place of birth - Foreign born (%) - Multirace
Place of birth - Foreign born (%) - Other Race
Residents speaking English at home (%)
Residents speaking English at home - Born in the United States (%)
Residents speaking English at home - Native, born elsewhere (%)
Residents speaking English at home - Foreign born (%)
Residents speaking Spanish at home (%)
Residents speaking Spanish at home - Born in the United States (%)
Residents speaking Spanish at home - Native, born elsewhere (%)
Residents speaking Spanish at home - Foreign born (%)
Residents speaking other language at home (%)
Residents speaking other language at home - Born in the United States (%)
Residents speaking other language at home - Native, born elsewhere (%)
Residents speaking other language at home - Foreign born (%)
Marital status - Never married (%)
Marital status - Now married (%)
Marital status - Separated (%)
Marital status - Widowed (%)
Marital status - Divorced (%)
Ancestries Reported - Arab (%)
Ancestries Reported - Czech (%)
Ancestries Reported - Danish (%)
Ancestries Reported - Dutch (%)
Ancestries Reported - English (%)
Ancestries Reported - French (%)
Ancestries Reported - French Canadian (%)
Ancestries Reported - German (%)
Ancestries Reported - Greek (%)
Ancestries Reported - Hungarian (%)
Ancestries Reported - Irish (%)
Ancestries Reported - Italian (%)
Ancestries Reported - Lithuanian (%)
Ancestries Reported - Norwegian (%)
Ancestries Reported - Polish (%)
Ancestries Reported - Portuguese (%)
Ancestries Reported - Russian (%)
Ancestries Reported - Scotch-Irish (%)
Ancestries Reported - Scottish (%)
Ancestries Reported - Slovak (%)
Ancestries Reported - Subsaharan African (%)
Ancestries Reported - Swedish (%)
Ancestries Reported - Swiss (%)
Ancestries Reported - Ukrainian (%)
Ancestries Reported - United States (%)
Ancestries Reported - Welsh (%)
Ancestries Reported - West Indian (%)
Ancestries Reported - Other (%)
Geographical mobility - Same house 1 year ago (%)
Geographical mobility - Same house 1 year ago (%) - White
Geographical mobility - Same house 1 year ago (%) - Black or African American
Geographical mobility - Same house 1 year ago (%) - Asian
Geographical mobility - Same house 1 year ago (%) - Hispanic or Latino
Geographical mobility - Same house 1 year ago (%) - American Indian and Alaska Native
Geographical mobility - Same house 1 year ago (%) - Multirace
Geographical mobility - Same house 1 year ago (%) - Other Race
Geographical mobility - Moved within same county (%)
Geographical mobility - Moved within same county (%) - White
Geographical mobility - Moved within same county (%) - Black or African American
Geographical mobility - Moved within same county (%) - Asian
Geographical mobility - Moved within same county (%) - Hispanic or Latino
Geographical mobility - Moved within same county (%) - American Indian and Alaska Native
Geographical mobility - Moved within same county (%) - Multirace
Geographical mobility - Moved within same county (%) - Other Race
Geographical mobility - Moved from different county within same state (%)
Geographical mobility - Moved from different county within same state (%) - White
Geographical mobility - Moved from different county within same state (%) - Black or African American
Geographical mobility - Moved from different county within same state (%) - Asian
Geographical mobility - Moved from different county within same state (%) - Hispanic or Latino
Geographical mobility - Moved from different county within same state (%) - American Indian and Alaska Native
Geographical mobility - Moved from different county within same state (%) - Multirace
Geographical mobility - Moved from different county within same state (%) - Other Race
Geographical mobility - Moved from different state (%)
Geographical mobility - Moved from different state (%) - White
Geographical mobility - Moved from different state (%) - Black or African American
Geographical mobility - Moved from different state (%) - Asian
Geographical mobility - Moved from different state (%) - Hispanic or Latino
Geographical mobility - Moved from different state (%) - American Indian and Alaska Native
Geographical mobility - Moved from different state (%) - Multirace
Geographical mobility - Moved from different state (%) - Other Race
Geographical mobility - Moved from abroad (%)
Geographical mobility - Moved from abroad (%) - White
Geographical mobility - Moved from abroad (%) - Black or African American
Geographical mobility - Moved from abroad (%) - Asian
Geographical mobility - Moved from abroad (%) - Hispanic or Latino
Geographical mobility - Moved from abroad (%) - American Indian and Alaska Native
Geographical mobility - Moved from abroad (%) - Multirace
Geographical mobility - Moved from abroad (%) - Other Race
Place of birth for the foreign-born population - Ireland (%)
Place of birth for the foreign-born population - Denmark (%)
Place of birth for the foreign-born population - Norway (%)
Place of birth for the foreign-born population - Sweden (%)
Place of birth for the foreign-born population - United Kingdom (%)
Place of birth for the foreign-born population - England (%)
Place of birth for the foreign-born population - Scotland (%)
Place of birth for the foreign-born population - Other Northern Europe (%)
Place of birth for the foreign-born population - Austria (%)
Place of birth for the foreign-born population - Belgium (%)
Place of birth for the foreign-born population - France (%)
Place of birth for the foreign-born population - Germany (%)
Place of birth for the foreign-born population - Netherlands (%)
Place of birth for the foreign-born population - Switzerland (%)
Place of birth for the foreign-born population - Other Western Europe (%)
Place of birth for the foreign-born population - Greece (%)
Place of birth for the foreign-born population - Italy (%)
Place of birth for the foreign-born population - Portugal (%)
Place of birth for the foreign-born population - Spain (%)
Place of birth for the foreign-born population - Other Southern Europe (%)
Place of birth for the foreign-born population - Albania (%)
Place of birth for the foreign-born population - Belarus (%)
Place of birth for the foreign-born population - Bosnia and Herzegovina (%)
Place of birth for the foreign-born population - Bulgaria (%)
Place of birth for the foreign-born population - Croatia (%)
Place of birth for the foreign-born population - Czechoslovakia (%)
Place of birth for the foreign-born population - Hungary (%)
Place of birth for the foreign-born population - Latvia (%)
Place of birth for the foreign-born population - Lithuania (%)
Place of birth for the foreign-born population - North Macedonia (Macedonia) (%)
Place of birth for the foreign-born population - Moldova (%)
Place of birth for the foreign-born population - Poland (%)
Place of birth for the foreign-born population - Romania (%)
Place of birth for the foreign-born population - Russia (%)
Place of birth for the foreign-born population - Serbia (%)
Place of birth for the foreign-born population - Ukraine (%)
Place of birth for the foreign-born population - Other Eastern Europe (%)
Place of birth for the foreign-born population - China (%)
Place of birth for the foreign-born population - Hong Kong (%)
Place of birth for the foreign-born population - Taiwan (%)
Place of birth for the foreign-born population - Japan (%)
Place of birth for the foreign-born population - Korea (%)
Place of birth for the foreign-born population - Other Eastern Asia (%)
Place of birth for the foreign-born population - Afghanistan (%)
Place of birth for the foreign-born population - Bangladesh (%)
Place of birth for the foreign-born population - India (%)
Place of birth for the foreign-born population - Iran (%)
Place of birth for the foreign-born population - Kazakhstan (%)
Place of birth for the foreign-born population - Nepal (%)
Place of birth for the foreign-born population - Pakistan (%)
Place of birth for the foreign-born population - Sri Lanka (%)
Place of birth for the foreign-born population - Uzbekistan (%)
Place of birth for the foreign-born population - Other South Central Asia (%)
Place of birth for the foreign-born population - Burma (%)
Place of birth for the foreign-born population - Cambodia (%)
Place of birth for the foreign-born population - Indonesia (%)
Place of birth for the foreign-born population - Laos (%)
Place of birth for the foreign-born population - Malaysia (%)
Place of birth for the foreign-born population - Philippines (%)
Place of birth for the foreign-born population - Singapore (%)
Place of birth for the foreign-born population - Thailand (%)
Place of birth for the foreign-born population - Vietnam (%)
Place of birth for the foreign-born population - Other South Eastern Asia (%)
Place of birth for the foreign-born population - Armenia (%)
Place of birth for the foreign-born population - Iraq (%)
Place of birth for the foreign-born population - Israel (%)
Place of birth for the foreign-born population - Jordan (%)
Place of birth for the foreign-born population - Kuwait (%)
Place of birth for the foreign-born population - Lebanon (%)
Place of birth for the foreign-born population - Saudi Arabia (%)
Place of birth for the foreign-born population - Syria (%)
Place of birth for the foreign-born population - Turkey (%)
Place of birth for the foreign-born population - Yemen (%)
Place of birth for the foreign-born population - Other Western Asia (%)
Place of birth for the foreign-born population - Eritrea (%)
Place of birth for the foreign-born population - Ethiopia (%)
Place of birth for the foreign-born population - Kenya (%)
Place of birth for the foreign-born population - Somalia (%)
Place of birth for the foreign-born population - Uganda (%)
Place of birth for the foreign-born population - Zimbabwe (%)
Place of birth for the foreign-born population - Other Eastern Africa (%)
Place of birth for the foreign-born population - Cameroon (%)
Place of birth for the foreign-born population - Congo (%)
Place of birth for the foreign-born population - Democratic Republic of Congo (Zaire) (%)
Place of birth for the foreign-born population - Other Middle Africa (%)
Place of birth for the foreign-born population - Egypt (%)
Place of birth for the foreign-born population - Morocco (%)
Place of birth for the foreign-born population - Sudan (%)
Place of birth for the foreign-born population - Other Northern Africa (%)
Place of birth for the foreign-born population - South Africa (%)
Place of birth for the foreign-born population - Other Southern Africa (%)
Place of birth for the foreign-born population - Cabo Verde (%)
Place of birth for the foreign-born population - Ghana (%)
Place of birth for the foreign-born population - Liberia (%)
Place of birth for the foreign-born population - Nigeria (%)
Place of birth for the foreign-born population - Senegal (%)
Place of birth for the foreign-born population - Sierra Leone (%)
Place of birth for the foreign-born population - Other Western Africa (%)
Place of birth for the foreign-born population - Australia (%)
Place of birth for the foreign-born population - New Zealand (%)
Place of birth for the foreign-born population - Fiji (%)
Place of birth for the foreign-born population - Micronesia (%)
Place of birth for the foreign-born population - Bahamas (%)
Place of birth for the foreign-born population - Barbados (%)
Place of birth for the foreign-born population - Cuba (%)
Place of birth for the foreign-born population - Dominica (%)
Place of birth for the foreign-born population - Dominican Republic (%)
Place of birth for the foreign-born population - Grenada (%)
Place of birth for the foreign-born population - Haiti (%)
Place of birth for the foreign-born population - Jamaica (%)
Place of birth for the foreign-born population - St. Vincent and the Grenadines (%)
Place of birth for the foreign-born population - Trinidad and Tobago (%)
Place of birth for the foreign-born population - West Indies (%)
Place of birth for the foreign-born population - Other Caribbean (%)
Place of birth for the foreign-born population - Belize (%)
Place of birth for the foreign-born population - Costa Rica (%)
Place of birth for the foreign-born population - El Salvador (%)
Place of birth for the foreign-born population - Guatemala (%)
Place of birth for the foreign-born population - Honduras (%)
Place of birth for the foreign-born population - Mexico (%)
Place of birth for the foreign-born population - Nicaragua (%)
Place of birth for the foreign-born population - Panama (%)
Place of birth for the foreign-born population - Other Central America (%)
Place of birth for the foreign-born population - Argentina (%)
Place of birth for the foreign-born population - Bolivia (%)
Place of birth for the foreign-born population - Brazil (%)
Place of birth for the foreign-born population - Chile (%)
Place of birth for the foreign-born population - Colombia (%)
Place of birth for the foreign-born population - Ecuador (%)
Place of birth for the foreign-born population - Guyana (%)
Place of birth for the foreign-born population - Peru (%)
Place of birth for the foreign-born population - Uruguay (%)
Place of birth for the foreign-born population - Venezuela (%)
Place of birth for the foreign-born population - Other South America (%)
Place of birth for the foreign-born population - Canada (%)
Place of birth for the foreign-born population - Other Northern America (%)
Place of birth for the foreign-born population - Other (%)
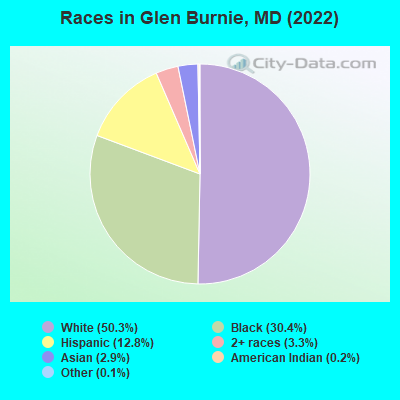
According to 2022 data, the most numerous races in Glen Burnie, MD are White alone (35,812 residents), Black alone (21,632 residents), and Hispanic (9,126 residents). 85.6% of Glen Burnie residents speak English at home. 11.8% of Glen Burnie, MD residents are foreign-born (4.2% born in Latin America, 4.0% born in Asia, 2.1% born in Africa), which is 35.7% less than the foreign-born rate of 16.0% across the entire state of Maryland.
Race distribution in Glen Burnie
2000 2022
3,286,547 62.1% White alone 1,464,735 27.7% Black alone 227,916 4.3% Hispanic 209,738 4.0% Asian alone 82,946 1.6% Two or more races 13,312 0.3% American Indian alone 9,379 0.2% Other race alone 1,913 0.04% Native Hawaiian and Other
2,906,492 47.1% White alone 1,800,914 29.2% Black alone 705,842 11.4% Hispanic 401,818 6.5% Asian alone 291,317 4.7% Two or more races 46,930 0.8% Other race alone 8,930 0.1% American Indian alone 2,417 0.04% Native Hawaiian and Other
Income and house value in Glen Burnie Median household income in 2022 $82,215 White non-Hispanic householders$64,745 Black householders$99,775 American Indian and Alaska Native householders$83,378 Asian householders$43,420 Some other race householders$75,263 Two or more races householders$54,222 Hispanic or Latino race householdersMedian 2022 house value $355,782 White Non-Hispanic householders$355,782 Black or African American householders$347,417 American Indian or Alaska Native householders $429,567 Asian householders$336,066 Native Hawaiian and other Pacific Islander householders$336,066 Some other race householders$405,968 Two or more races householders$428,969 Hispanic or Latino householders
Median age by race in Glen Burnie
38.3 Median age for White residents38.6 38.0 34.6 Median age for Black or African American residents32.1 36.9 66.3 Median age for American Indian / Alaska Native residents54.4 68.5 36.9 Median age for Asian residents36.4 46.8 -666,666,666.0 Median age for Native Hawaiian / Pacific Islander residents-666,666,666.0 -666,666,666.0 25.8 Median age for Other race residents25.6 25.9 28.5 Median age for Two or more races residents28.6 28.2 39.0 Median age for White alone residents38.9 39.3 25.1 Median age for Hispanic or Latino residents25.2 25.1
Owner/renter occupied households by race in Glen Burnie
House owners and renters - White residents 12,118 74.7% Owner occupied4,098 25.3% Renter occupiedHouse owners and renters - Black or African American residents 3,046 34.6% Owner occupied5,758 65.4% Renter occupiedHouse owners and renters - American Indian / Alaska Native residents 97 51.4% Owner occupied92 48.6% Renter occupiedHouse owners and renters - Asian residents 702 92.6% Owner occupied56 7.4% Renter occupiedHouse owners and renters - Native Hawaiian / Pacific Islander residents 15 100.0% Renter occupiedHouse owners and renters - Other race residents 432 38.7% Owner occupied683 61.3% Renter occupiedHouse owners and renters - Two or more races residents 1,113 71.3% Owner occupied449 28.7% Renter occupiedHouse owners and renters - White alone residents 12,073 75.0% Owner occupied4,022 25.0% Renter occupiedHouse owners and renters - Hispanic or Latino residents 1,036 51.4% Owner occupied981 48.6% Renter occupied
Language usage in Glen Burnie
English speakers - Total 85.6% of residents of Glen Burnie speak English at home.
6.8% of residents speak Spanish at home 2,369 50.7% Speak English very well2,303 49.3% Speak English less than very well7.8% of residents speak other language at home 3,908 73.0% Speak English very well1,447 27.0% Speak English less than very well
English speakers - Born in the United States 94.1% of residents of Glen Burnie speak English at home.
3.6% of residents speak Spanish at home 563 83.0% Speak English very well115 17.0% Speak English less than very well2.0% of residents speak other language at home 367 98.1% Speak English very well7 1.9% Speak English less than very well
English speakers - Native, born elsewhere 68.4% of residents of Glen Burnie speak English at home.
15.0% of residents speak Spanish at home 176 85.0% Speak English very well31 15.0% Speak English less than very well13.2% of residents speak other language at home 152 83.5% Speak English very well30 16.5% Speak English less than very well
English speakers - Foreign-born 17.6% of residents of Glen Burnie speak English at home.
33.0% of residents speak Spanish at home 636 23.5% Speak English very well2,074 76.5% Speak English less than very well51.9% of residents speak other language at home 2,980 70.0% Speak English very well1,280 30.0% Speak English less than very well
White (Caucasian) - Speak only English Native:
98.4% (34,032)Foreign-born:
54.2% (275)
White (Caucasian) - Speak another language Native:
1.6% (547)Foreign-born:
45.8% (232)
Black or African American - Speak only English Native:
99.4% (18,050)Foreign-born:
56.7% (1,136)
Black or African American - Speak another language Native:
0.6% (113)Foreign-born:
43.3% (867)
American Indian / Alaska Native - Speak another language Native:
63.0% (104)Foreign-born:
100.0% (398)
Asian - Speak only English Native:
23.1% (95)Foreign-born:
18.1% (276)
Asian - Speak another language Native:
76.9% (316)Foreign-born:
81.9% (1,251)
Native Hawaiian / Pacific Islander - Speak only English Native:
73.2% (44)Foreign-born:
84.6% (54)
Other race - Speak only English Native:
38.5% (574)Foreign-born:
4.6% (103)
Other race - Speak another language Native:
61.7% (920)Foreign-born:
99.1% (2,224)
Two or more races - Speak only English Native:
84.3% (4,345)Foreign-born:
7.6% (60)
Two or more races - Speak another language Native:
13.5% (697)Foreign-born:
84.4% (669)
White alone - Speak only English Native:
98.0% (35,782)Foreign-born:
24.5% (190)
White alone - Speak another language Native:
2.0% (721)Foreign-born:
75.5% (586)
Hispanic or Latino - Speak another language Native:
49.3% (2,055)Foreign-born:
100.0% (3,535)
Foreign-born residents in Glen Burnie 8,498 residents are foreign born (4.2% Latin America , 4.0% Asia , 2.1% Africa ).
This city:
11.8%Maryland:
15.7%
Marital status for residents in Glen Burnie Marital status - White (Caucasian) population 15 years and over
Males 36.6% Never married44.7% Now married0.3% Separated4.0% Widowed14.4% DivorcedFemales 36.5% Never married36.8% Now married1.1% Separated11.5% Widowed14.0% DivorcedWomen who gave birth in the past 12 months Now married:
63.1% (169)Unmarried:
36.9% (99)
Women who did not give birth in the past 12 months Now married:
32.4% (3,051)Unmarried:
67.6% (6,379)
Marital status - Black or African American population 15 years and over
Males 43.3% Never married48.8% Now married0.0% Separated1.8% Widowed6.1% DivorcedFemales 49.8% Never married26.2% Now married2.6% Separated8.3% Widowed13.1% DivorcedWomen who gave birth in the past 12 months Now married:
58.4% (181)Unmarried:
41.6% (129)
Women who did not give birth in the past 12 months Now married:
25.7% (1,644)Unmarried:
74.3% (4,759)
Marital status - American Indian / Alaska Native population 15 years and over
Males 31.7% Never married52.4% Now married0.0% Separated0.0% Widowed15.9% DivorcedFemales 19.3% Never married34.3% Now married13.8% Separated32.6% Widowed0.0% DivorcedWomen who gave birth in the past 12 months Now married:
0.0% (0)Unmarried:
100.0% (37)
Women who did not give birth in the past 12 months Now married:
41.0% (37)Unmarried:
59.0% (54)
Marital status - Asian population 15 years and over
Males 30.0% Never married60.1% Now married0.0% Separated5.7% Widowed4.2% DivorcedFemales 20.9% Never married59.2% Now married1.9% Separated5.6% Widowed12.4% DivorcedWomen who gave birth in the past 12 months Now married:
100.0% (41)Unmarried:
0.0% (0)
Women who did not give birth in the past 12 months Now married:
65.4% (579)Unmarried:
34.6% (307)
Marital status - Native Hawaiian / Pacific Islander population 15 years and over
Males 0.0% Never married100.0% Now married0.0% Separated0.0% Widowed0.0% DivorcedFemales 0.0% Never married100.0% Now married0.0% Separated0.0% Widowed0.0% DivorcedWomen who did not give birth in the past 12 months Now married:
100.0% (14)Unmarried:
0.0% (0)
Marital status - Other race population 15 years and over
Males 50.3% Never married39.6% Now married6.6% Separated0.0% Widowed3.5% DivorcedFemales 32.8% Never married45.4% Now married11.6% Separated2.4% Widowed7.8% DivorcedWomen who gave birth in the past 12 months Now married:
100.0% (25)Unmarried:
0.0% (0)
Women who did not give birth in the past 12 months Now married:
53.4% (477)Unmarried:
46.6% (416)
Marital status - Two or more races population 15 years and over
Males 45.4% Never married39.2% Now married4.3% Separated0.0% Widowed11.2% DivorcedFemales 36.9% Never married42.7% Now married0.0% Separated0.0% Widowed20.3% DivorcedWomen who gave birth in the past 12 months Now married:
100.0% (69)Unmarried:
0.0% (0)
Women who did not give birth in the past 12 months Now married:
37.9% (713)Unmarried:
62.1% (1,168)
Marital status - White alone, not Hispanic / Latino population 15 years and over
Males 35.8% Never married45.5% Now married0.0% Separated4.1% Widowed14.6% DivorcedFemales 35.4% Never married37.2% Now married1.1% Separated11.9% Widowed14.4% DivorcedWomen who gave birth in the past 12 months Now married:
63.1% (169)Unmarried:
36.9% (99)
Women who did not give birth in the past 12 months Now married:
32.7% (2,937)Unmarried:
67.3% (6,037)
Marital status - Hispanic or Latino population 15 years and over
Males 49.6% Never married37.1% Now married6.7% Separated0.0% Widowed6.7% DivorcedFemales 36.2% Never married36.1% Now married8.6% Separated5.1% Widowed14.1% DivorcedWomen who gave birth in the past 12 months Now married:
45.7% (23)Unmarried:
54.3% (28)
Women who did not give birth in the past 12 months Now married:
42.4% (758)Unmarried:
57.6% (1,030)
Ancestries in Glen Burnie
2,417 7.1% English2,298 6.8% German2,258 6.7% Irish1,937 5.7% American1,492 4.4% Italian734 2.2% Polish632 1.9% Nigerian451 1.3% Jamaican395 1.2% African276 0.8% European263 0.8% Turkish182 0.5% Eastern European173 0.5% Egyptian116 0.3% Greek116 0.3% British106 0.3% Welsh105 0.3% Scotch-Irish91 0.3% Scottish89 0.3% West Indian88 0.3% Ukrainian88 0.3% French82 0.2% Norwegian78 0.2% Haitian72 0.2% Danish65 0.2% Portuguese53 0.2% Russian50 0.1% Swedish46 0.1% Hungarian42 0.1% Lithuanian41 0.1% Armenian33 0.10% Ethiopian29 0.09% Sierra Leonean29 0.09% Northern European25 0.07% Pennsylvania German24 0.07% Belgian22 0.07% Iranian21 0.06% Lebanese21 0.06% Czech21 0.06% Trinidadian and Tobagonian19 0.06% Ghanaian17 0.05% Celtic14 0.04% Austrian14 0.04% Slavic13 0.04% Moroccan13 0.04% Barbadian12 0.04% Liberian12 0.04% French Canadian11 0.03% Dutch10 0.03% Zimbabwean6 0.02% Israeli4 0.01% Brazilian4 0.01% Czechoslovakian
Geographical mobility in Glen Burnie Same house 1 year ago 32,090 87.8% White (Caucasian)17,570 81.2% Black or African American502 97.0% American Indian / Alaska Native2,738 80.2% Asian116 88.0% Native Hawaiian / Pacific Islander2,855 73.2% Other race5,819 87.8% Two or more races31,418 88.3% White alone, not Hispanic / Latino6,342 69.8% Hispanic or LatinoMoved within same county 3,379 9.2% White / Caucasian2,634 12.2% Black or African American147 4.3% Asian583 15.0% Other race604 9.1% Two or more races3,249 9.1% White alone, not Hispanic / Latino890 9.8% Hispanic or LatinoMoved within same state 363 1.0% White / Caucasian1,322 6.1% Black or African American14 2.7% American Indian / Alaska Native32 0.9% Asian516 13.2% Other race120 1.8% Two or more races363 1.0% White alone, not Hispanic / Latino1,198 13.2% Hispanic or LatinoMoved from different state 710 1.9% White / Caucasian89 0.4% Black or African American108 3.2% Asian25 0.6% Other race64 1.0% Two or more races557 1.6% White alone, not Hispanic / Latino375 4.1% Hispanic or LatinoMoved from abroad 31 0.1% Black or African American79 2.3% Asian12 9.1% Native Hawaiian / Pacific Islander33 0.9% Other race284 3.1% Hispanic or Latino
Children Nativity (place of birth) in Glen Burnie
Children under 6 years - Living with two parents Both parents native 2,199 100.0% NativeBoth parents foreign-born 322 90.7% Native33 9.3% Foreign-bornOne native, one foreign-born parent 210 100.0% NativeChildren under 6 years - Living with one parent Native parent 1,107 100.0% NativeForeign-born parent 153 100.0% NativeChildren 6 to 17 years - Living with two parents Both parents native 3,791 100.0% NativeBoth parents foreign-born 421 30.8% Native946 69.2% Foreign-bornOne native, one foreign-born parent 358 100.0% NativeChildren 6 to 17 years - Living with one parent Native parent 3,824 100.0% NativeForeign-born parent 512 58.2% Native368 41.8% Foreign-born
Grandparents responsible for own grandchildren in Glen Burnie
Grandparents (30 to 59 years) White / Caucasian 114 29.4% Responsible for grandchildren272 70.6% Not responsible for grandchildrenBlack or African American 57 25.6% Responsible for grandchildren166 74.4% Not responsible for grandchildrenAmerican Indian / Alaska Native 33 100.0% Not responsible for grandchildrenAsian 41 100.0% Not responsible for grandchildrenNative Hawaiian / Pacific Islander 15 100.0% Not responsible for grandchildrenWhite alone, not Hispanic / Latino 114 31.1% Responsible for grandchildren251 68.9% Not responsible for grandchildrenHispanic or Latino 56 100.0% Not responsible for grandchildrenGrandparents (60 years and over) White / Caucasian 195 33.0% Responsible for grandchildren395 67.0% Not responsible for grandchildrenBlack or African American 64 19.8% Responsible for grandchildren260 80.2% Not responsible for grandchildrenAsian 34 56.9% Responsible for grandchildren26 43.1% Not responsible for grandchildrenWhite alone, not Hispanic / Latino 202 33.2% Responsible for grandchildren406 66.8% Not responsible for grandchildren