Estimated zip code population in 2022: 8,189 Zip code population in 2010: 7,164 Zip code population in 2000: 7,628
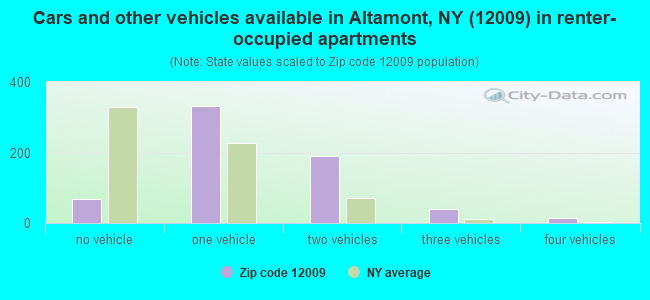
Houses and condos: 3,291 Renter-occupied apartments: 642
% of renters here:
20%
State:
46%
March 2022 cost of living index in zip code 12009: 96.1 (near average, U.S. average is 100)
Land area: 52.2 sq. mi. Water area: 0.8 sq. mi.
Population density: 157 people per square mile
(very low).
OSM Map
General Map
Google Map
MSN Map
OSM Map
General Map
Google Map
MSN Map
OSM Map
General Map
Google Map
MSN Map
OSM Map
General Map
Google Map
MSN Map
Please wait while loading the map...
Real estate property taxes paid for housing units in 2022:
This zip code:
1.7% ($5,449)
New York:
1.5% ($6,180)
Median real estate property taxes paid for housing units with mortgages in 2022: $5,894 (1.7%) Median real estate property taxes paid for housing units with no mortgage in 2022: $4,553 (1.6%)
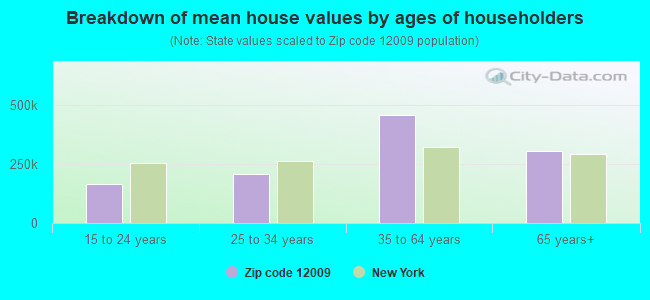
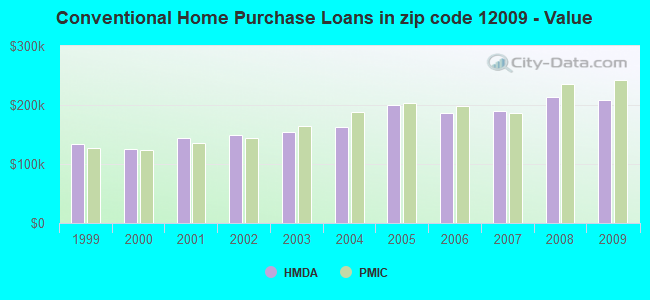
Estimated median house/condo value in 2022: $318,881
12009:
$318,881
New York:
$400,400
According to our research of New York and other state lists, there were 4 registered sex offenders living in 12009 zip code as of May 15, 2024. The ratio of all residents to sex offenders in zip code 12009 is 2,047 to 1. The ratio of registered sex offenders to all residents in this zip code is lower than the state average.
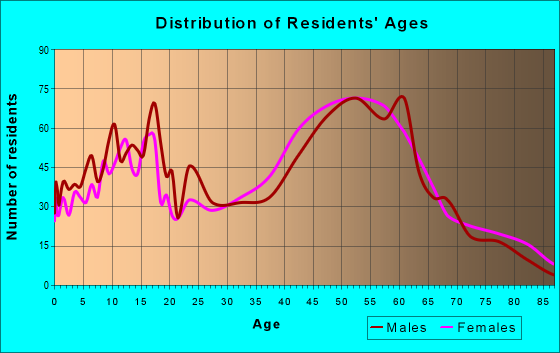
Median resident age:
This zip code:
43.7 years
New York median age:
40.0 years
Average household size:
This zip code:
2.5 people
New York:
2.5 people
Averages for the 2020 tax year for zip code 12009, filed in 2021:
Average Adjusted Gross Income (AGI) in 2020: $96,063 (Individual Income Tax Returns)
Here:
$96,063
State:
$90,930
Salary/wage: $79,844 (reported on 79.5% of returns)
Here:
$79,844
State:
$72,104
(% of AGI for various income ranges: 1160.4% for AGIs below $25k, 3322.3% for AGIs $25k-50k, 6438.6% for AGIs $50k-75k, 8427.3% for AGIs $75k-100k, 18750.8% for AGIs $100k-200k, 69731.8% for AGIs over 200k)
Taxable interest for individuals: $1,508 (reported on 48.2% of returns)
This zip code:
$1,508
New York:
$3,075
(% of AGI for various income ranges: 19.8% for AGIs below $25k, 34.7% for AGIs $25k-50k, 38.0% for AGIs $50k-75k, 61.0% for AGIs $75k-100k, 129.4% for AGIs $100k-200k, 1430.9% for AGIs over 200k)
Ordinary dividends: $4,751 (reported on 30.0% of returns)
Here:
$4,751
State:
$11,095
(% of AGI for various income ranges: 47.5% for AGIs below $25k, 57.3% for AGIs $25k-50k, 85.9% for AGIs $50k-75k, 160.3% for AGIs $75k-100k, 292.5% for AGIs $100k-200k, 2477.3% for AGIs over 200k)
Net capital gain/loss in AGI: +$13,749 (reported on 26.5% of returns)
Here:
+$13,749
State:
+$44,925
(% of AGI for various income ranges: 19.8% for AGIs below $25k, 77.2% for AGIs $25k-50k, 99.1% for AGIs $50k-75k, 166.7% for AGIs $75k-100k, 520.0% for AGIs $100k-200k, 9423.6% for AGIs over 200k)
Profit/loss from business: +$15,348 (reported on 14.5% of returns)
Here:
+$15,348
State:
+$14,940
(% of AGI for various income ranges: 98.7% for AGIs below $25k, 100.3% for AGIs $25k-50k, 178.2% for AGIs $50k-75k, 301.7% for AGIs $75k-100k, 443.7% for AGIs $100k-200k, 3437.3% for AGIs over 200k)
Taxable individual retirement arrangement distribution: $20,152 (reported on 11.5% of returns)
12009:
$20,152
New York:
$19,609
(% of AGI for various income ranges: 90.4% for AGIs below $25k, 111.2% for AGIs $25k-50k, 223.9% for AGIs $50k-75k, 504.3% for AGIs $75k-100k, 607.1% for AGIs $100k-200k, 2244.5% for AGIs over 200k)
Self-employed (Keogh) retirement plans: $21,080 (reported on 1.2% of returns)
12009:
$21,080
New York:
$32,497
(% of AGI for various income ranges: 958.2% for AGIs over 200k)
Total itemized deductions: $26,437 (reported on 10.2% of returns)
Here:
$26,437
State:
$39,326
(% of AGI for various income ranges: 246.5% for AGIs $25k-50k, 296.1% for AGIs $50k-75k, 479.7% for AGIs $75k-100k, 635.4% for AGIs $100k-200k, 3012.7% for AGIs over 200k)
Charity contributions: $6,386 (reported on 7.2% of returns)
Here:
$6,386
State:
$15,420
(% of AGI for various income ranges: 11.3% for AGIs $25k-50k, 28.0% for AGIs $50k-75k, 61.7% for AGIs $75k-100k, 81.5% for AGIs $100k-200k, 956.4% for AGIs over 200k)
Taxes paid: $8,334 (reported on 10.2% of returns)
12009:
$8,334
State:
$9,183
(% of AGI for various income ranges: 50.2% for AGIs $25k-50k, 105.2% for AGIs $50k-75k, 186.0% for AGIs $75k-100k, 230.0% for AGIs $100k-200k, 817.3% for AGIs over 200k)
Earned income credit: $2,132 (reported on 5.5% of returns)
Here:
$2,132
State:
$2,138
(% of AGI for various income ranges: 48.3% for AGIs below $25k, 35.5% for AGIs $25k-50k)
Percentage of individuals using paid preparers for their 2020 taxes: 94.2%
Here:
94%
State:
95%
(% for various income ranges: 94.1% for AGIs below $25k, 93.6% for AGIs $25k-50k, 93.5% for AGIs $50k-75k, 91.3% for AGIs $75k-100k, 95.8% for AGIs $100k-200k, 97.0% for AGIs over 200k)
Averages for the 2012 tax year for zip code 12009, filed in 2013:
Average Adjusted Gross Income (AGI) in 2012: $73,463 (Individual Income Tax Returns)
Here:
$73,463
State:
$77,088
Salary/wage: $60,750 (reported on 82.8% of returns)
Here:
$60,750
State:
$60,593
(% of AGI for various income ranges: 68.0% for AGIs below $25k, 73.7% for AGIs $25k-50k, 68.4% for AGIs $50k-75k, 72.2% for AGIs $75k-100k, 76.5% for AGIs $100k-200k, 54.8% for AGIs over 200k)
Taxable interest for individuals: $1,087 (reported on 50.8% of returns)
This zip code:
$1,087
New York:
$3,125
(% of AGI for various income ranges: 1.5% for AGIs below $25k, 0.7% for AGIs $25k-50k, 0.7% for AGIs $50k-75k, 0.4% for AGIs $75k-100k, 0.5% for AGIs $100k-200k, 1.1% for AGIs over 200k)
Ordinary dividends: $3,660 (reported on 31.4% of returns)
Here:
$3,660
State:
$10,299
(% of AGI for various income ranges: 3.0% for AGIs below $25k, 1.2% for AGIs $25k-50k, 1.8% for AGIs $50k-75k, 1.5% for AGIs $75k-100k, 1.0% for AGIs $100k-200k, 2.0% for AGIs over 200k)
Net capital gain/loss in AGI: +$5,016 (reported on 22.4% of returns)
Here:
+$5,016
State:
+$42,474
(% of AGI for various income ranges: 0.2% for AGIs $25k-50k, 0.5% for AGIs $50k-75k, 0.4% for AGIs $75k-100k, 0.8% for AGIs $100k-200k, 4.3% for AGIs over 200k)
Profit/loss from business: +$17,802 (reported on 16.1% of returns)
Here:
+$17,802
State:
+$16,168
(% of AGI for various income ranges: 6.7% for AGIs below $25k, 2.8% for AGIs $25k-50k, 2.4% for AGIs $50k-75k, 2.4% for AGIs $75k-100k, 2.7% for AGIs $100k-200k, 6.8% for AGIs over 200k)
Taxable individual retirement arrangement distribution: $11,721 (reported on 11.5% of returns)
12009:
$11,721
New York:
$17,621
(% of AGI for various income ranges: 3.4% for AGIs below $25k, 2.9% for AGIs $25k-50k, 2.8% for AGIs $50k-75k, 2.6% for AGIs $75k-100k, 2.0% for AGIs $100k-200k)
Self-employment retirement plans: $17,600 (reported on 1.6% of returns)
12009:
$17,600
New York:
$27,330
(% of AGI for various income ranges: 0.9% for AGIs $75k-100k, 1.0% for AGIs over 200k)
Total itemized deductions: $25,393 (20% of AGI, reported on 42.6% of returns)
Here:
$25,393
State:
$34,985
Here:
20.0% of AGI
State:
21.3% of AGI
(% of AGI for various income ranges: 10.2% for AGIs below $25k, 8.4% for AGIs $25k-50k, 14.4% for AGIs $50k-75k, 14.9% for AGIs $75k-100k, 16.2% for AGIs $100k-200k, 16.0% for AGIs over 200k)
Charity contributions: $3,012 (reported on 35.0% of returns)
Here:
$3,012
State:
$5,572
(% of AGI for various income ranges: 0.7% for AGIs below $25k, 0.6% for AGIs $25k-50k, 1.1% for AGIs $50k-75k, 1.4% for AGIs $75k-100k, 1.5% for AGIs $100k-200k, 2.0% for AGIs over 200k)
Taxes paid: $14,208 (reported on 42.6% of returns)
12009:
$14,208
State:
$18,656
(% of AGI for various income ranges: 3.4% for AGIs below $25k, 3.3% for AGIs $25k-50k, 6.0% for AGIs $50k-75k, 7.2% for AGIs $75k-100k, 8.8% for AGIs $100k-200k, 11.8% for AGIs over 200k)
Earned income credit: $1,856 (reported on 8.7% of returns)
Here:
$1,856
State:
$2,230
(% of AGI for various income ranges: 3.4% for AGIs below $25k, 0.7% for AGIs $25k-50k)
Percentage of individuals using paid preparers for their 2012 taxes: 51.4%
Here:
51%
State:
66%
(% for various income ranges: 43.5% for AGIs below $25k, 47.8% for AGIs $25k-50k, 56.4% for AGIs $50k-75k, 56.5% for AGIs $75k-100k, 54.7% for AGIs $100k-200k, 76.5% for AGIs over 200k)
Averages for the 2004 tax year for zip code 12009, filed in 2005:
Average Adjusted Gross Income (AGI) in 2004: $60,986 (Individual Income Tax Returns)
Here:
$60,986
State:
$59,519
Salary/wage: $52,514 (reported on 83.0% of returns)
Here:
$52,514
State:
$50,673
(% of AGI for various income ranges: 93.2% for AGIs below $10k, 68.6% for AGIs $10k-25k, 77.5% for AGIs $25k-50k, 75.8% for AGIs $50k-75k, 81.1% for AGIs $75k-100k, 64.8% for AGIs over 100k)
Taxable interest for individuals: $1,056 (reported on 64.4% of returns)
This zip code:
$1,056
New York:
$2,377
(% of AGI for various income ranges: 7.3% for AGIs below $10k, 2.4% for AGIs $10k-25k, 1.5% for AGIs $25k-50k, 1.0% for AGIs $50k-75k, 1.0% for AGIs $75k-100k, 0.8% for AGIs over 100k)
Taxable dividends: $2,328 (reported on 34.6% of returns)
Here:
$2,328
State:
$5,394
(% of AGI for various income ranges: 6.4% for AGIs below $10k, 2.0% for AGIs $10k-25k, 1.1% for AGIs $25k-50k, 1.4% for AGIs $50k-75k, 1.2% for AGIs $75k-100k, 1.2% for AGIs over 100k)
Net capital gain/loss: +$11,337 (reported on 26.7% of returns)
Here:
+$11,337
State:
+$23,581
(% of AGI for various income ranges: -1.8% for AGIs below $10k, 0.7% for AGIs $10k-25k, 0.8% for AGIs $25k-50k, 1.7% for AGIs $50k-75k, 1.8% for AGIs $75k-100k, 8.9% for AGIs over 100k)
Profit/loss from business: +$14,691 (reported on 15.3% of returns)
Here:
+$14,691
State:
+$13,809
(% of AGI for various income ranges: 7.2% for AGIs below $10k, 8.8% for AGIs $10k-25k, 3.6% for AGIs $25k-50k, 2.7% for AGIs $50k-75k, 3.2% for AGIs $75k-100k, 3.6% for AGIs over 100k)
IRA payment deduction: $2,908 (reported on 3.2% of returns)
12009:
$2,908
New York:
$3,115
(% of AGI for various income ranges: 0.3% for AGIs $10k-25k, 0.3% for AGIs $25k-50k, 0.2% for AGIs $50k-75k, 0.3% for AGIs $75k-100k, 0.1% for AGIs over 100k)
Self-employed pension: $10,071 (reported on 1.7% of returns)
Here:
$10,071
New York:
$19,016
Total itemized deductions: $19,691 (18% of AGI, reported on 42.3% of returns)
Here:
$19,691
State:
$25,864
Here:
18.3% of AGI
State:
21.9% of AGI
(% of AGI for various income ranges: 12.9% for AGIs below $10k, 11.4% for AGIs $10k-25k, 9.9% for AGIs $25k-50k, 15.3% for AGIs $50k-75k, 16.7% for AGIs $75k-100k, 13.3% for AGIs over 100k)
Charity contributions deductions: $2,461 (2% of AGI, reported on 38.9% of returns)
Here:
$2,461
State:
$4,439
Here:
2.2% of AGI
State:
3.6% of AGI
(% of AGI for various income ranges: 0.6% for AGIs below $10k, 0.8% for AGIs $10k-25k, 1.0% for AGIs $25k-50k, 1.5% for AGIs $50k-75k, 1.9% for AGIs $75k-100k, 1.7% for AGIs over 100k)
Total tax: $10,346 (reported on 81.1% of returns)
12009:
$10,346
State:
$11,730
(% of AGI for various income ranges: 2.9% for AGIs below $10k, 5.3% for AGIs $10k-25k, 7.9% for AGIs $25k-50k, 9.0% for AGIs $50k-75k, 10.0% for AGIs $75k-100k, 19.4% for AGIs over 100k)
Earned income credit: $1,467 (reported on 7.1% of returns)
Here:
$1,467
State:
$1,757
Percentage of individuals using paid preparers for their 2004 taxes: 52.6%
Here:
53%
State:
67%
(% for various income ranges: 43.3% for AGIs below $10k, 49.4% for AGIs $10k-25k, 52.8% for AGIs $25k-50k, 59.3% for AGIs $50k-75k, 54.9% for AGIs $75k-100k, 58.9% for AGIs over 100k)
Likely homosexual households (counted as self-reported same-sex unmarried-partner households)
Lesbian couples: 0.1% of all households
Gay men: 0.0% of all households
Household received Food Stamps/SNAP in the past 12 months: 219 Household did not receive Food Stamps/SNAP in the past 12 months: 2,984
Women who had a birth in the past 12 months: 37 (37 now married, 0 unmarried) Women who did not have a birth in the past 12 months: 1,745 (717 now married, 1,024 unmarried)
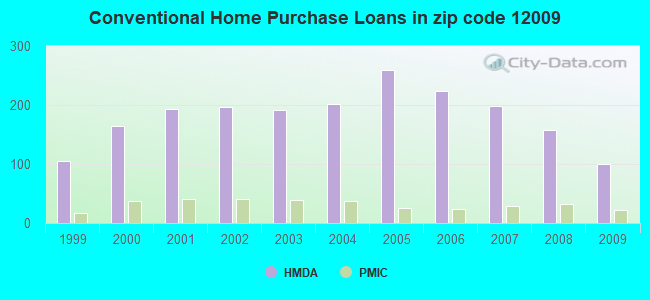
Housing units in zip code 12009 with a mortgage: 1,640 (399 second mortgage, 16 home equity loan, 377 both second mortgage and home equity loan) Houses without a mortgage: 46
Median monthly owner costs for units with a mortgage: $2,193 Median monthly owner costs for units without a mortgage: $728
Residents with income below the poverty level in 2022:
This zip code:
4.2%
Whole state:
14.3%
Residents with income below 50% of the poverty level in 2022:
This zip code:
2.3%
Whole state:
6.8%
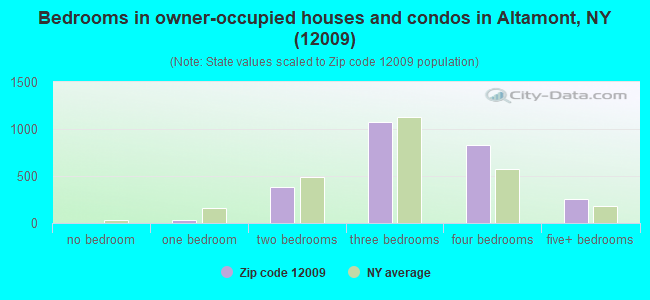
Median number of rooms in houses and condos:
Here:
7.0
State:
6.3
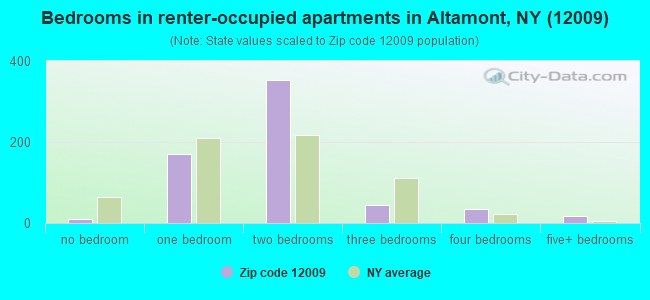
Median number of rooms in apartments:
Here:
4.1
State:
3.8
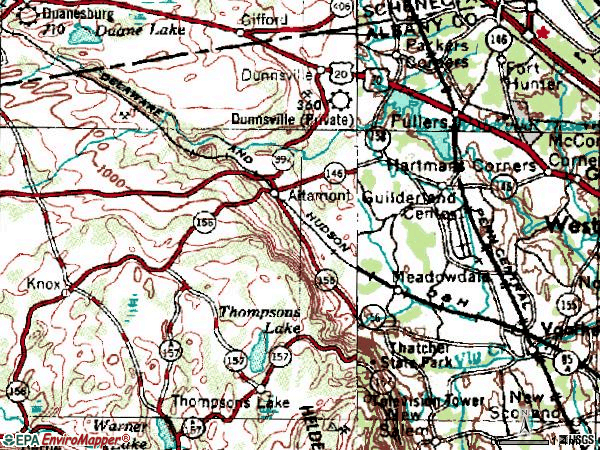
Notable locations in this zip code not listed on our city pages
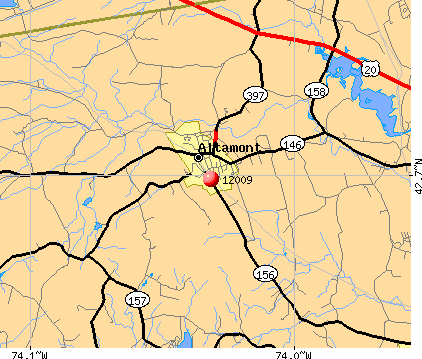
Notable locations in zip code 12009: Camp Altamont (A), Altamont Orchards (B), Indian Ladder Farms (C), Rolling Acres (D), Weathered Willow Tree Farm (E), Guilderland Center Fire Department (F). Display/hide their locations on the map
Cemeteries: Severson Cemetery (1), Fairview Cemetery (2), Guilderland Cemetery (3), High Point Cemetery (4), Lainhart Cemetery (5), Vanderpool Cemetery (6). Display/hide their locations on the map
In group quarters: 68 (-1 institutionalized population)
Size of family households: 1,044 2-persons, 374 3-persons, 482 4-persons, 161 5-persons, 35 6-persons, 49 7-or-more-persons
Size of nonfamily households: 837 1-person, 220 2-persons, 32 3-persons
1,133 married couples with children.
383 single-parent households (87 men, 296 women).
93.0% of residents of 12009 zip code speak English at home.
1.5% of residents speak Spanish at home (69% very well, 21% well, 9% not well).
1.0% of residents speak other Indo-European language at home (87% very well, 13% well).
3.6% of residents speak Asian or Pacific Island language at home (48% very well, 51% well, 1% not at all).
1.0% of residents speak other language at home (57% very well, 43% well).
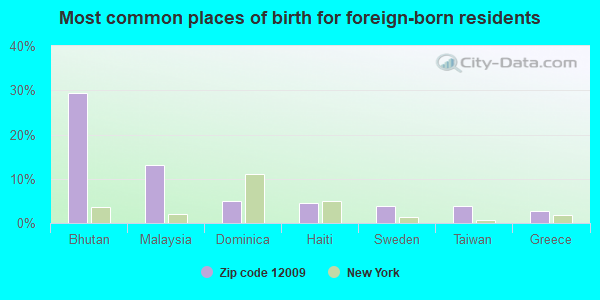
Foreign born population: 568 (6.9%) (43.2% of them are naturalized citizens)
This zip code:
6.9%
Whole state:
22.7%
29%Bhutan
13%Malaysia
5%Dominica
5%Haiti
4%Sweden
4%Taiwan
3%Greece
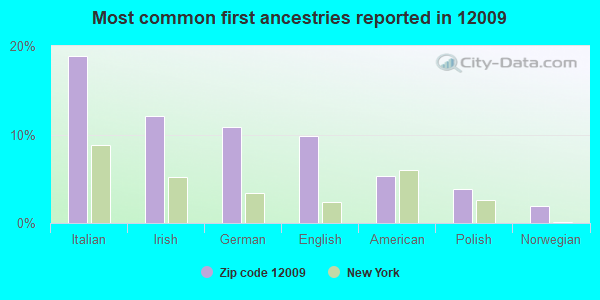
19%Italian
12%Irish
11%German
10%English
5%American
4%Polish
2%Norwegian
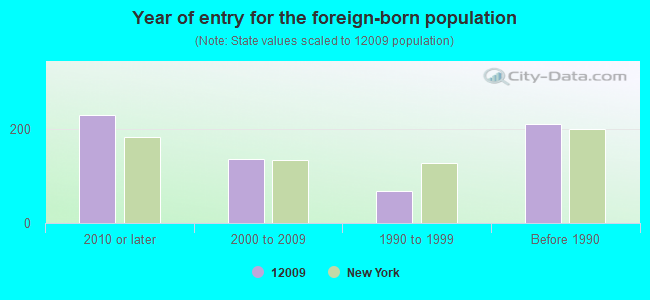
Year of entry for the foreign-born population
2312010 or later
1372000 to 2009
681990 to 1999
212Before 1990
Facilities with environmental interests located in this zip code:
ALTAMONT ES ( in ALTAMONT, NY)
(National Center for Education Statistics) - STATE ID-010802060001 Organizations: GUILDERLAND CSD (SCHOOL DISTRICT)
ALTAMONT (V) STP (VILLAGE HALL in ALTAMONT, NY)
National Pollutant Discharge Elimination System NON-MAJOR (Tracking pollutant discharge elimination systems) - permit Business SIC classification: SEWERAGE SYSTEMS Alternative names: ROBERT GANLEY
ALTAMONT METAL PRODUCTS INC (RTE 158 in ALTAMONT, NY)
(Resource Conservation and Recovery Act (tracking hazardous waste)) Business NAICS classification: OTHER COMMERCIAL AND SERVICE INDUSTRY MACHINERY MANUFACTURING.
GUILDERLAND CENTRAL SCHOOL DIST (117 GRAND ST in ALTAMONT, NY)
(Resource Conservation and Recovery Act (tracking hazardous waste))
ALBANY MANAGEMENT-CARPENTER VILLAGE APTS (2568 WESTERN AVE in ALTAMONT, NY)
COMPLIANCE ACTIVITY (Tracking inspections of insecticide, fungicide, and rodenticide, and toxic substances) Business SIC classification: OPERATORS OF APARTMENT BUILDINGS; REAL ESTATE AGENTS AND MANAGERS
Housing units lacking complete plumbing facilities: 0.4% Housing units lacking complete kitchen facilities: 0.4%
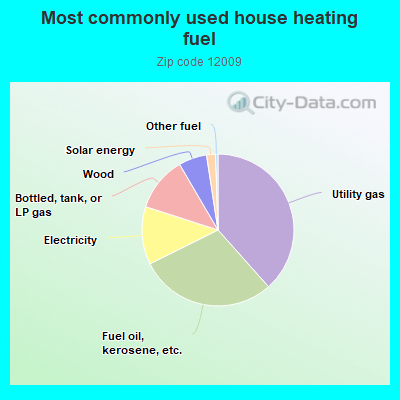
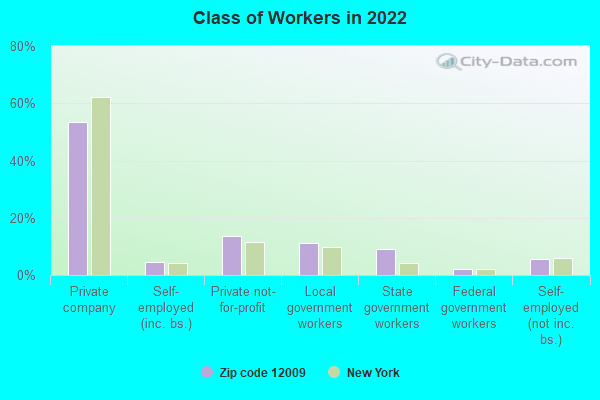
38.4%Utility gas
29.2%Fuel oil, kerosene, etc.
12.3%Electricity
11.6%Bottled, tank, or LP gas
6.0%Wood
1.9%Solar energy
0.5%Other fuel
Population in 1990: 5,683. Population change in the 1990s: +1,945 (+34.2%).
Place of birth for U.S.-born residents:
This state: 6,270
Northeast: 556
Midwest: 219
South: 183
West: 322
69% of the 12009 zip code residents lived in the same house 5 years ago. Out of people who lived in different houses, 65% lived in this county. Out of people who lived in different counties, 50% lived in New York.
92% of the 12009 zip code residents lived in the same house 1 year ago. Out of people who lived in different houses, 66% moved from this county. Out of people who lived in different houses, 22% moved from different county within same state. Out of people who lived in different houses, 6% moved from different state. Out of people who lived in different houses, 3% moved from abroad.
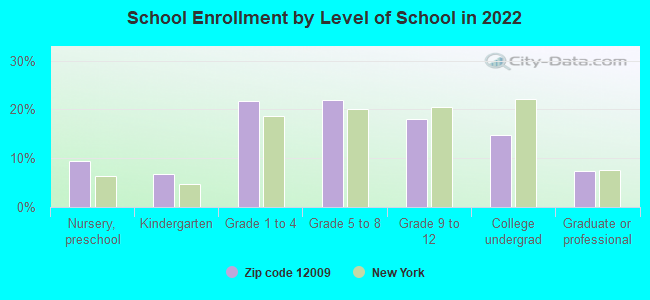
Private vs. public school enrollment:
Students in private schools in grades 1 to 8 (elementary and middle school): 86
Here:
11.0%
New York:
15.6%
Students in private schools in grades 9 to 12 (high school): 20
Here:
6.3%
New York:
15.0%
Students in private undergraduate colleges: 77
Here:
29.5%
New York:
39.2%
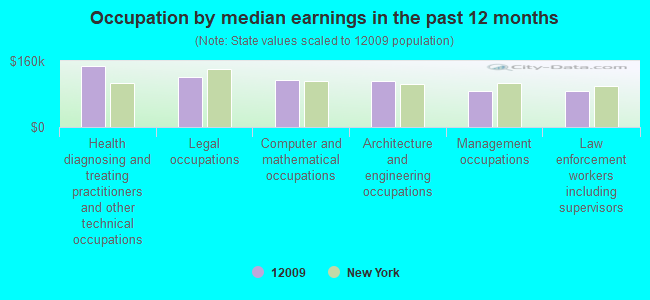
Occupation by median earnings in the past 12 months ($)
147,892Health diagnosing and treating practitioners and other technical occupations
120,957Legal occupations
113,415Computer and mathematical occupations
111,966Architecture and engineering occupations
87,175Management occupations
86,540Law enforcement workers including supervisors
Companies with federal contracts located in this zip code:
PRIME ENERGY (374 WESTERN TURNPIKE in ALTAMONT, NY) : $162,495 in 4 contractsfrom 2002 to 2003
$71,700 with Navy for Lease or Rental of Equipment -- Pumps and Compressors. Signed on 2003-08-12. Completion date: 2004-03-31.
$34,815 with Navy for Lease or Rental of Equipment -- Pumps and Compressors. Taking place in ME. Signed on 2002-03-01. Completion date: 2002-10-24.
$29,700 with Navy for Lease or Rental of Equipment -- Pumps and Compressors. Signed on 2003-09-08. Completion date: 2004-02-10.
$26,280 with Navy for Lease or Rental of Equipment -- Pumps and Compressors. Taking place in ME. Signed on 2002-07-19. Completion date: 2002-09-03.
ELECTRICAL INSTRUMENTATION AND (5560 GARDNER RD in ALTAMONT, NY; small business) : $140,864 in 17 contractsfrom 2003 to 2006
Contracts for Inspection Services (including commercial testing and lab services, except medical/dental) -- Electrical and Electronic Equipment Components, Maintenance, Repair and Rebuilding of Equipment -- Instruments and Laboratory Equipment, Engineering and Technical Services, Maintenance, Repair and Rebuilding of Equipment -- Electrical and Electronic Equipment Components, and moreby Army Signed by year:2000: $0; 2001: $0; 2002: $0; 2003: $27,427; 2004: $33,927; 2005: $54,214; 2006: $25,296.
Biggest contracts:
$31,140 with Army for Inspection Services (including commercial testing and lab services, except medical/dental) -- Electrical and Electronic Equipment Components. Signed on 2006-02-28. Completion date: 2007-04-24.
$27,427 with Army for Maintenance, Repair and Rebuilding of Equipment -- Instruments and Laboratory Equipment. Signed on 2003-03-03. Completion date: 2004-02-29.
$27,340 with Army for Inspection Services (including commercial testing and lab services, except medical/dental) -- Electrical and Electronic Equipment Components. Signed on 2005-03-08. Completion date: 2006-04-24.
$25,427, same as above.Signed on 2004-04-21. Completion date: 2005-04-23.
Top industries in this zip code by the number of employees in 2005:
Health Care and Social Assistance: Residential Mental Health and Substance Abuse Facilities (50-99 employees: 1 establishment)
Utilities: Electric Bulk Power Transmission and Control (50-99: 1)
Construction: Site Preparation Contractors (20-49: 1, 5-9: 1, 1-4: 2)
2002 - 2017 National Fire Incident Reporting System (NFIRS) incidents
Based on the data from the years 2002 - 2017 the average number of fires per year is 14. The highest number of reported fires - 54 took place in 2013, and the least - 0 in 2008. The data has an increasing trend.
When looking into fire subcategories, the most reports belonged to: Structure Fires (45.9%), and Outside Fires (21.6%).
Fire incident types reported to NFIRS in Zip Code 12009


 Nearest zip codes: 12085, 12059, 12186, 12056, 12306, 12303.
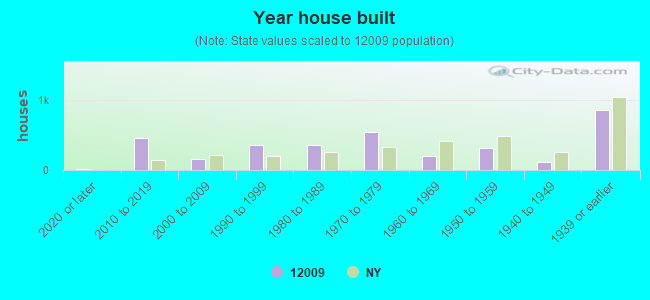


 Based on the data from the years 2002 - 2017 the average number of fires per year is 14. The highest number of reported fires - 54 took place in 2013, and the least - 0 in 2008. The data has an increasing trend.
 When looking into fire subcategories, the most reports belonged to: Structure Fires (45.9%), and Outside Fires (21.6%).