Estimated zip code population in 2022: 17,392 Zip code population in 2010: 14,709 Zip code population in 2000: 11,412
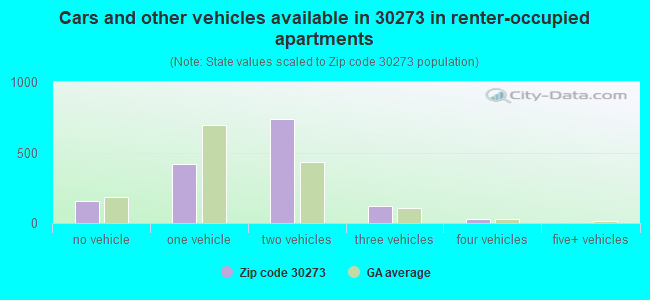
Houses and condos: 6,519 Renter-occupied apartments: 1,449
% of renters here:
23%
State:
34%
March 2022 cost of living index in zip code 30273: 99.8 (near average, U.S. average is 100)
Land area: 6.5 sq. mi. Water area: 0.1 sq. mi.
Population density: 2,666 people per square mile
(average).
OSM Map
General Map
Google Map
MSN Map
OSM Map
General Map
Google Map
MSN Map
OSM Map
General Map
Google Map
MSN Map
OSM Map
General Map
Google Map
MSN Map
Please wait while loading the map...
Real estate property taxes paid for housing units in 2022:
This zip code:
0.9% ($1,731)
Georgia:
0.7% ($2,160)
Median real estate property taxes paid for housing units with mortgages in 2022: $1,795 (0.9%) Median real estate property taxes paid for housing units with no mortgage in 2022: $1,479 (0.8%)
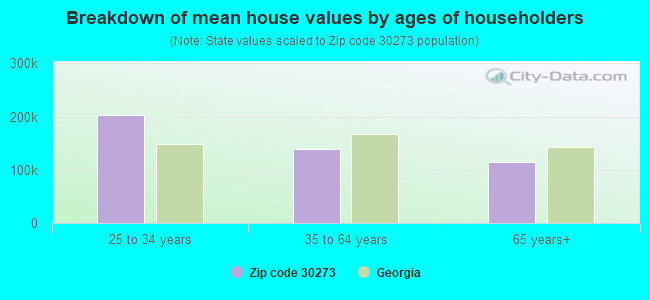
Estimated median house/condo value in 2022: $194,961
30273:
$194,961
Georgia:
$297,400
According to our research of Georgia and other state lists, there were 32 registered sex offenders living in 30273 zip code as of May 15, 2024. The ratio of all residents to sex offenders in zip code 30273 is 454 to 1. The ratio of registered sex offenders to all residents in this zip code is near the state average.
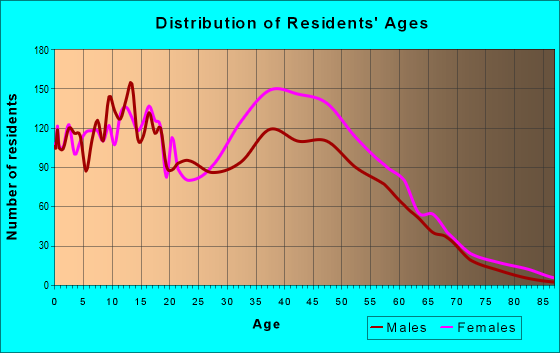
Median resident age:
This zip code:
37.2 years
Georgia median age:
37.6 years
Average household size:
This zip code:
2.8 people
Georgia:
2.6 people
Averages for the 2020 tax year for zip code 30273, filed in 2021:
Average Adjusted Gross Income (AGI) in 2020: $37,977 (Individual Income Tax Returns)
Here:
$37,977
State:
$70,847
Salary/wage: $37,288 (reported on 84.1% of returns)
Here:
$37,288
State:
$59,126
(% of AGI for various income ranges: 1238.6% for AGIs below $25k, 4006.0% for AGIs $25k-50k, 7487.6% for AGIs $50k-75k, 10982.0% for AGIs $75k-100k, 17897.0% for AGIs $100k-200k)
Taxable interest for individuals: $553 (reported on 9.9% of returns)
This zip code:
$553
Georgia:
$2,011
(% of AGI for various income ranges: 2.3% for AGIs below $25k, 2.4% for AGIs $25k-50k, 8.7% for AGIs $50k-75k, 11.7% for AGIs $75k-100k, 110.9% for AGIs $100k-200k)
Ordinary dividends: $1,356 (reported on 4.1% of returns)
Here:
$1,356
State:
$8,996
(% of AGI for various income ranges: 0.9% for AGIs below $25k, 2.4% for AGIs $25k-50k, 7.0% for AGIs $50k-75k, 20.6% for AGIs $75k-100k, 131.3% for AGIs $100k-200k)
Net capital gain/loss in AGI: +$2,508 (reported on 4.1% of returns)
Here:
+$2,508
State:
+$28,402
(% of AGI for various income ranges: 1.5% for AGIs $25k-50k, 7.6% for AGIs $50k-75k, 25.4% for AGIs $75k-100k, 344.3% for AGIs $100k-200k)
Taxable individual retirement arrangement distribution: $11,331 (reported on 3.1% of returns)
30273:
$11,331
Georgia:
$20,525
(% of AGI for various income ranges: 12.8% for AGIs below $25k, 33.4% for AGIs $25k-50k, 69.6% for AGIs $50k-75k, 100.6% for AGIs $75k-100k, 447.8% for AGIs $100k-200k)
Total itemized deductions: $23,441 (reported on 10.0% of returns)
Here:
$23,441
State:
$34,001
(% of AGI for various income ranges: 39.4% for AGIs below $25k, 262.3% for AGIs $25k-50k, 618.9% for AGIs $50k-75k, 1012.3% for AGIs $75k-100k, 2069.1% for AGIs $100k-200k)
Charity contributions: $8,833 (reported on 9.0% of returns)
Here:
$8,833
State:
$14,164
(% of AGI for various income ranges: 7.8% for AGIs below $25k, 75.8% for AGIs $25k-50k, 211.1% for AGIs $50k-75k, 354.3% for AGIs $75k-100k, 910.4% for AGIs $100k-200k)
Taxes paid: $5,617 (reported on 10.0% of returns)
30273:
$5,617
State:
$7,540
(% of AGI for various income ranges: 7.6% for AGIs below $25k, 51.6% for AGIs $25k-50k, 156.0% for AGIs $50k-75k, 288.3% for AGIs $75k-100k, 537.4% for AGIs $100k-200k)
Earned income credit: $2,634 (reported on 30.6% of returns)
Here:
$2,634
State:
$2,530
(% of AGI for various income ranges: 160.6% for AGIs below $25k, 101.8% for AGIs $25k-50k)
Percentage of individuals using paid preparers for their 2020 taxes: 91.2%
Here:
91%
State:
93%
(% for various income ranges: 91.3% for AGIs below $25k, 90.6% for AGIs $25k-50k, 92.2% for AGIs $50k-75k, 90.9% for AGIs $75k-100k, 90.5% for AGIs $100k-200k, 100.0% for AGIs over 200k)
Averages for the 2012 tax year for zip code 30273, filed in 2013:
Average Adjusted Gross Income (AGI) in 2012: $34,239 (Individual Income Tax Returns)
Here:
$34,239
State:
$56,131
Salary/wage: $33,797 (reported on 87.0% of returns)
Here:
$33,797
State:
$47,942
(% of AGI for various income ranges: 82.7% for AGIs below $25k, 93.0% for AGIs $25k-50k, 86.9% for AGIs $50k-75k, 82.2% for AGIs $75k-100k, 73.8% for AGIs $100k-200k)
Taxable interest for individuals: $481 (reported on 12.8% of returns)
This zip code:
$481
Georgia:
$1,706
(% of AGI for various income ranges: 0.3% for AGIs below $25k, 0.2% for AGIs $25k-50k, 0.1% for AGIs $50k-75k, 0.1% for AGIs $75k-100k, 0.1% for AGIs $100k-200k)
Ordinary dividends: $1,342 (reported on 4.7% of returns)
Here:
$1,342
State:
$7,265
(% of AGI for various income ranges: 0.5% for AGIs below $25k, 0.2% for AGIs $50k-75k, 0.2% for AGIs $100k-200k)
Profit/loss from business: +$140 (reported on 25.4% of returns)
Here:
+$140
State:
+$7,583
(% of AGI for various income ranges: 5.6% for AGIs below $25k)
Taxable individual retirement arrangement distribution: $9,867 (reported on 3.9% of returns)
30273:
$9,867
Georgia:
$17,199
(% of AGI for various income ranges: 0.9% for AGIs below $25k, 0.8% for AGIs $25k-50k, 1.1% for AGIs $50k-75k, 1.8% for AGIs $75k-100k, 1.8% for AGIs $100k-200k)
Total itemized deductions: $16,803 (31% of AGI, reported on 36.3% of returns)
Here:
$16,803
State:
$23,886
Here:
31.4% of AGI
State:
21.5% of AGI
(% of AGI for various income ranges: 10.5% for AGIs below $25k, 19.9% for AGIs $25k-50k, 20.1% for AGIs $50k-75k, 18.7% for AGIs $75k-100k, 18.3% for AGIs $100k-200k)
Charity contributions: $4,260 (reported on 32.2% of returns)
Here:
$4,260
State:
$5,507
(% of AGI for various income ranges: 1.9% for AGIs below $25k, 4.3% for AGIs $25k-50k, 4.5% for AGIs $50k-75k, 4.7% for AGIs $75k-100k, 4.7% for AGIs $100k-200k)
Taxes paid: $3,607 (reported on 35.9% of returns)
30273:
$3,607
State:
$7,838
(% of AGI for various income ranges: 1.3% for AGIs below $25k, 3.4% for AGIs $25k-50k, 4.6% for AGIs $50k-75k, 5.0% for AGIs $75k-100k, 5.6% for AGIs $100k-200k)
Earned income credit: $2,696 (reported on 36.2% of returns)
Here:
$2,696
State:
$2,589
(% of AGI for various income ranges: 12.8% for AGIs below $25k, 1.4% for AGIs $25k-50k)
Percentage of individuals using paid preparers for their 2012 taxes: 53.6%
Here:
54%
State:
55%
(% for various income ranges: 53.3% for AGIs below $25k, 53.4% for AGIs $25k-50k, 52.9% for AGIs $50k-75k, 53.8% for AGIs $75k-100k, 60.0% for AGIs $100k-200k)
Averages for the 2004 tax year for zip code 30273, filed in 2005:
Average Adjusted Gross Income (AGI) in 2004: $36,466 (Individual Income Tax Returns)
Here:
$36,466
State:
$47,553
Salary/wage: $35,750 (reported on 92.2% of returns)
Here:
$35,750
State:
$42,178
(% of AGI for various income ranges: 118.4% for AGIs below $10k, 91.3% for AGIs $10k-25k, 94.7% for AGIs $25k-50k, 91.3% for AGIs $50k-75k, 88.6% for AGIs $75k-100k, 71.3% for AGIs over 100k)
Taxable interest for individuals: $652 (reported on 23.4% of returns)
This zip code:
$652
Georgia:
$1,772
(% of AGI for various income ranges: 1.4% for AGIs below $10k, 0.5% for AGIs $10k-25k, 0.2% for AGIs $25k-50k, 0.3% for AGIs $50k-75k, 0.4% for AGIs $75k-100k, 1.2% for AGIs over 100k)
Taxable dividends: $732 (reported on 8.3% of returns)
Here:
$732
State:
$4,283
(% of AGI for various income ranges: 0.3% for AGIs below $10k, 0.3% for AGIs $10k-25k, 0.1% for AGIs $25k-50k, 0.1% for AGIs $50k-75k, 0.1% for AGIs $75k-100k, 0.3% for AGIs over 100k)
Net capital gain/loss: +$5,253 (reported on 5.9% of returns)
Here:
+$5,253
State:
+$16,461
(% of AGI for various income ranges: -0.8% for AGIs below $10k, -0.1% for AGIs $10k-25k, -0.0% for AGIs $25k-50k, 0.2% for AGIs $50k-75k, 0.5% for AGIs $75k-100k, 7.0% for AGIs over 100k)
Profit/loss from business: +$255 (reported on 16.1% of returns)
Here:
+$255
State:
+$8,201
(% of AGI for various income ranges: -3.8% for AGIs below $10k, 1.1% for AGIs $10k-25k, -0.5% for AGIs $25k-50k, 0.5% for AGIs $50k-75k, 1.2% for AGIs $75k-100k, -0.4% for AGIs over 100k)
IRA payment deduction: $2,050 (reported on 1.5% of returns)
30273:
$2,050
Georgia:
$2,969
(% of AGI for various income ranges: 0.5% for AGIs below $10k, 0.1% for AGIs $25k-50k, 0.1% for AGIs $50k-75k, 0.1% for AGIs $75k-100k)
Total itemized deductions: $16,521 (33% of AGI, reported on 52.8% of returns)
Here:
$16,521
State:
$19,944
Here:
32.8% of AGI
State:
22.6% of AGI
(% of AGI for various income ranges: 17.9% for AGIs below $10k, 18.8% for AGIs $10k-25k, 28.2% for AGIs $25k-50k, 24.8% for AGIs $50k-75k, 21.2% for AGIs $75k-100k, 17.4% for AGIs over 100k)
Charity contributions deductions: $3,526 (7% of AGI, reported on 47.9% of returns)
Here:
$3,526
State:
$4,354
Here:
6.9% of AGI
State:
4.7% of AGI
(% of AGI for various income ranges: 1.5% for AGIs below $10k, 3.1% for AGIs $10k-25k, 4.9% for AGIs $25k-50k, 5.5% for AGIs $50k-75k, 4.8% for AGIs $75k-100k, 3.8% for AGIs over 100k)
Total tax: $3,682 (reported on 68.3% of returns)
30273:
$3,682
State:
$8,223
(% of AGI for various income ranges: 3.7% for AGIs below $10k, 3.0% for AGIs $10k-25k, 4.7% for AGIs $25k-50k, 7.6% for AGIs $50k-75k, 9.3% for AGIs $75k-100k, 14.3% for AGIs over 100k)
Earned income credit: $1,916 (reported on 24.2% of returns)
Here:
$1,916
State:
$1,986
Percentage of individuals using paid preparers for their 2004 taxes: 57.3%
Here:
57%
State:
62%
(% for various income ranges: 47.0% for AGIs below $10k, 62.0% for AGIs $10k-25k, 59.0% for AGIs $25k-50k, 56.1% for AGIs $50k-75k, 54.8% for AGIs $75k-100k, 59.6% for AGIs over 100k)
Likely homosexual households (counted as self-reported same-sex unmarried-partner households)
Lesbian couples: 0.5% of all households
Gay men: 0.0% of all households
Household received Food Stamps/SNAP in the past 12 months: 858 Household did not receive Food Stamps/SNAP in the past 12 months: 5,341
Women who had a birth in the past 12 months: 594 (42 now married, 550 unmarried) Women who did not have a birth in the past 12 months: 3,304 (1,563 now married, 1,738 unmarried)
Housing units in zip code 30273 with a mortgage: 3,773 (246 second mortgage, 148 both second mortgage and home equity loan) Houses without a mortgage: 6
Median monthly owner costs for units with a mortgage: $1,231 Median monthly owner costs for units without a mortgage: $431
Residents with income below the poverty level in 2022:
This zip code:
16.8%
Whole state:
12.7%
Residents with income below 50% of the poverty level in 2022:
This zip code:
7.1%
Whole state:
6.3%
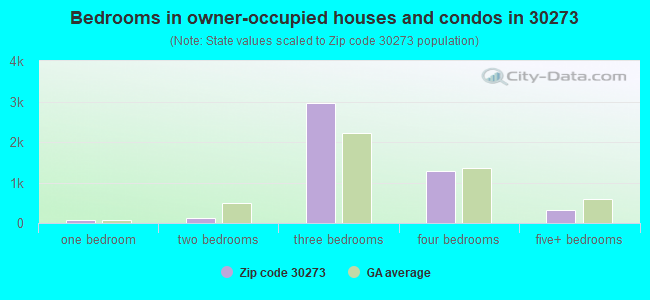
Median number of rooms in houses and condos:
Here:
6.2
State:
6.8
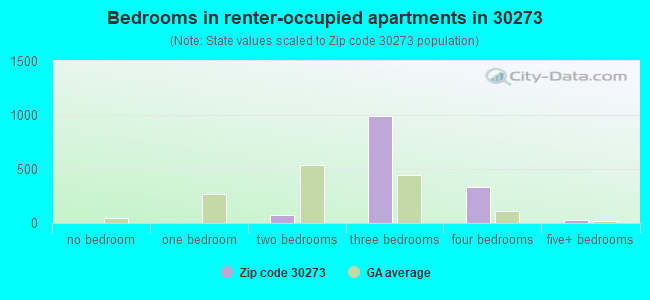
Median number of rooms in apartments:
Here:
6.1
State:
4.6
Notable locations in this zip code not listed on our city pages
In group quarters: 33 (-1 institutionalized population)
Size of family households: 1,533 2-persons, 993 3-persons, 960 4-persons, 350 5-persons, 347 6-persons, 71 7-or-more-persons
Size of nonfamily households: 1,814 1-person, 116 2-persons
1,785 married couples with children.
1,526 single-parent households (437 men, 1,089 women).
84.9% of residents of 30273 zip code speak English at home.
5.9% of residents speak Spanish at home (77% very well, 15% well, 8% not well).
1.6% of residents speak other Indo-European language at home (88% very well, 12% well).
5.0% of residents speak Asian or Pacific Island language at home (5% very well, 34% well, 61% not well).
2.6% of residents speak other language at home (81% very well, 19% well).
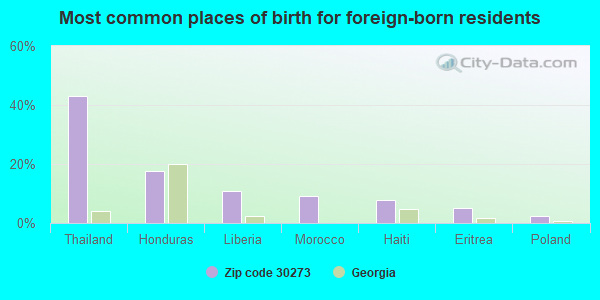
Foreign born population: 1,817 (10.5%) (67.9% of them are naturalized citizens)
This zip code:
10.5%
Whole state:
10.7%
43%Thailand
18%Honduras
11%Liberia
9%Morocco
8%Haiti
5%Eritrea
2%Poland
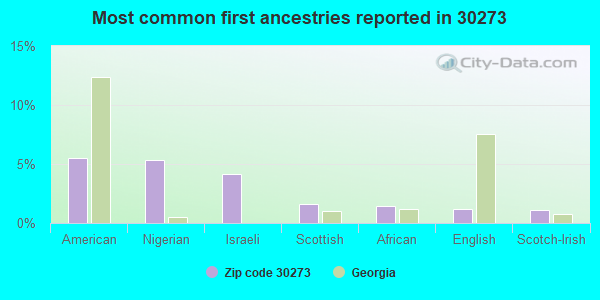
5%American
5%Nigerian
4%Israeli
2%Scottish
1%African
1%English
1%Scotch-Irish
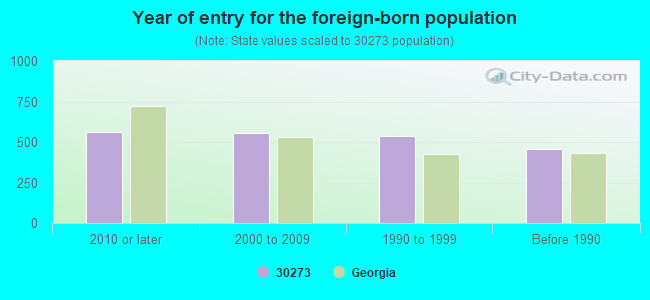
Year of entry for the foreign-born population
5612010 or later
5572000 to 2009
5361990 to 1999
458Before 1990
Public elementary/middle schools in in zip code 30273 not listed on the city page:
Private elementary/middle school in in this zip code not listed on the city page:
CAMELOT CHRISTIAN ACADEMY (Students: 128, Location: 6346 HIGHWAY 42, Grades: PK-2)
Facilities with environmental interests located in this zip code:
ADAMSON JUNIOR HIGH SCHOOL (3187 REX ROAD in REX, GA)
(Geographic Names Information System) (National Center for Education Statistics) - STATE ID-0177 Organizations: CLAYTON COUNTY (SCHOOL DISTRICT)
Alternative names: ADAMSON MIDDLE SCHOOL
REX FURNITURE CO INC (3738 REX ROAD in REX, GA)
AIR MAJOR (AIRS/AFS) CRITERIA AND HAZARDOUS AIR POLLUTANT INVENTORY (Inventory of air pollution sources) (Resource Conservation and Recovery Act (tracking hazardous waste)) Business SIC classification: WOOD HOUSEHOLD FURNITURE, EXCEPT UPHOLSTERED Business NAICS classification: NONUPHOLSTERED WOOD HOUSEHOLD FURNITURE MANUFACTURING. Organizations: OPERNAME (CONTACT/OPERATOR)
, OWNERNAME (CONTACT/OWNER)
CIRCLE K #1822 (6381 HWY 42 in REX, GA)
(Resource Conservation and Recovery Act (tracking hazardous waste)) Organizations: CIRCLE K STORES INC (CONTACT/OWNER)
REX BODY SHOP (3346 REX ROAD in REX, GA)
(Resource Conservation and Recovery Act (tracking hazardous waste)) Organizations: JIMMY GOFORTH (CONTACT/OWNER)
JEFF HAYNIE TRANSPORTER (6227 VALDEZ DR in REX, GA)
(Resource Conservation and Recovery Act (tracking hazardous waste)) Organizations: JEFFERY CHARLES HAYNIE (CONTACT/OWNER)
BALLENGER GROUP INC (EVANS ROAD in REX, GA)
AIR MINOR (AIRS/AFS) Business SIC classification: READY-MIXED CONCRETE
CLAYTON CO. WATER AUTHORITY (6900 OLD MACON HIGHWAY in REX, GA)
National Pollutant Discharge Elimination System MAJOR (Tracking pollutant discharge elimination systems) - permit Business SIC classification: SEWERAGE SYSTEMS Organizations: CLAYTON CNTY WATER AUTHORITY (CONTACT/OWNER)
Alternative names: CLAYTON CO (NORTHESAT WPCP)
CLAYTON COUNTY WATER AUTHORITY-NE WATER (6900 OLD MACON HWY in REX, GA)
AIR SYNTHETIC MINOR (AIRS/AFS) Business SIC classification: AIR AND WATER RESOURCE AND SOLID WASTE MANAGEMENT
Housing units lacking complete kitchen facilities: 0.5%
67.8%Utility gas
30.5%Electricity
0.6%Bottled, tank, or LP gas
0.6%No fuel used
Population in 1990: 7,218. Population change in the 1990s: +4,194 (+58.1%).
Place of birth for U.S.-born residents:
This state: 9,794
Northeast: 853
Midwest: 1,197
South: 3,181
West: 195
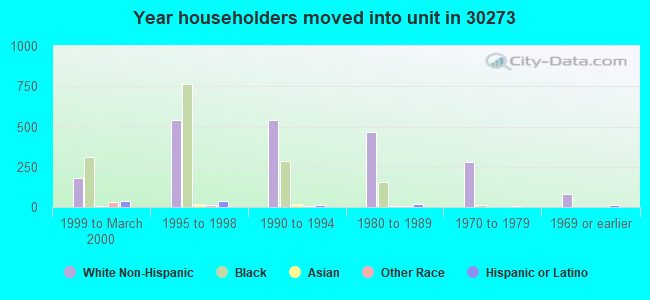
52% of the 30273 zip code residents lived in the same house 5 years ago. Out of people who lived in different houses, 38% lived in this county. Out of people who lived in different counties, 50% lived in Georgia.
90% of the 30273 zip code residents lived in the same house 1 year ago. Out of people who lived in different houses, 54% moved from this county. Out of people who lived in different houses, 34% moved from different county within same state. Out of people who lived in different houses, 3% moved from different state. Out of people who lived in different houses, 5% moved from abroad.
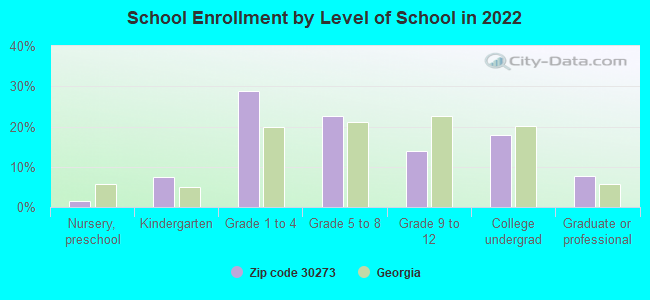
Private vs. public school enrollment:
Students in private schools in grades 1 to 8 (elementary and middle school): 219
Here:
9.7%
Georgia:
12.1%
Students in private schools in grades 9 to 12 (high school):
Here:
0.0%
Georgia:
10.8%
Students in private undergraduate colleges: 246
Here:
31.4%
Georgia:
17.1%
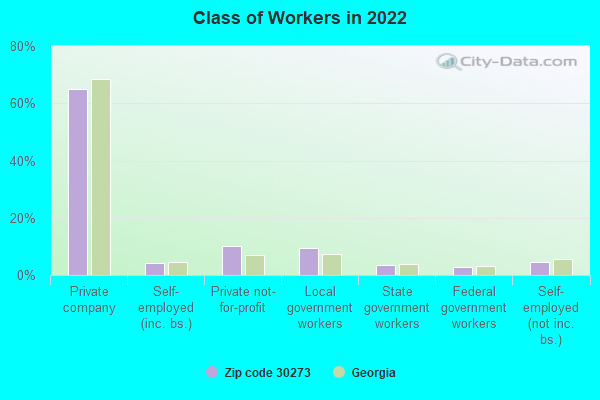
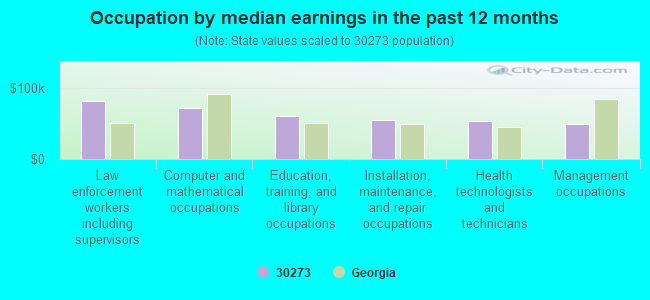
Occupation by median earnings in the past 12 months ($)
80,865Law enforcement workers including supervisors
71,513Computer and mathematical occupations
60,447Education, training, and library occupations
55,409Installation, maintenance, and repair occupations
53,969Health technologists and technicians
49,854Management occupations
Companies with federal contracts located in this zip code:
D-CHECK DEVELOPMENTS INC (5667 STAGECOACH RD in REX, GA; small business) : $574,335 in 13 contractsfrom 2002 to 2005
Contracts for Aircraft Maintenance and Repair Shop Specialized Equipment, Aircraft Ground Servicing Equipment, Miscellaneous Items, Winches, Hoists, Cranes, and Derricks, and moreby Air Force, Defense Logistics Agency, Army Signed by year:2000: $0; 2001: $0; 2002: $77,690; 2003: $241,260; 2004: $213,100; 2005: $42,285; 2006: $0.
Biggest contracts:
$77,690 with Air Force for Aircraft Maintenance and Repair Shop Specialized Equipment. Signed on 2002-06-18. Completion date: 2002-11-30.
$43,635, same as above.Signed on 2004-07-21. Completion date: 2004-11-30.
$43,180, same as above.Signed on 2004-09-30. Completion date: 2004-08-29.
$42,285 with Air Force for Aircraft Ground Servicing Equipment. Signed on 2005-02-16. Completion date: 2005-07-06.
HUNTER ENTERPRISES (6365 ALPINE RD in REX, GA; small business) : $55,060 in 16 contractsfrom 2001 to 2005
Contracts for Maintenance, Repair or Alteration of Real Property -- Miscellaneous Buildings, Construction of Structures and Facilities -- Electronic and Communications Facilities by Army Signed by year:2000: $0; 2001: $5,785; 2002: $12,600; 2003: $4,930; 2004: $16,950; 2005: $14,795; 2006: $0.
Biggest contracts:
$15,500 with Army for Maintenance, Repair or Alteration of Real Property -- Miscellaneous Buildings. Signed on 2004-08-23. Completion date: 2004-08-31.
$14,095 with Army for Construction of Structures and Facilities -- Electronic and Communications Facilities. Signed on 2005-09-29. Completion date: 2005-11-30.
$8,750 with Army for Maintenance, Repair or Alteration of Real Property -- Miscellaneous Buildings. Signed on 2002-05-14. Completion date: 2002-06-14.
$5,785, same as above.Signed on 2001-02-23. Completion date: 2001-04-02.
WRIGHT FITNESS GROUP (3466 MOSSWOOD LN in REX, GA; small business) : $18,220 in 7 contractsfrom 2004 to 2006
Contracts for Other Education and Training Services by Army Signed by year:2000: $0; 2001: $0; 2002: $0; 2003: $0; 2004: $9,120; 2005: $3,900; 2006: $5,200.
Biggest contracts:
$9,120 with Army for Other Education and Training Services. Signed on 2004-12-22. Completion date: 2005-09-30.
$3,900, same as above.Signed on 2006-03-29. Completion date: 2006-09-30.
$1,300, same as above.Signed on 2006-01-04. Completion date: 2006-09-30.
$1,300, same as above.Signed on 2005-11-16. Completion date: 2006-09-30.
Top industries in this zip code by the number of employees in 2005:
Other Services (except Public Administration): Religious Organizations (20-49 employees: 3 establishments, 1-4 employees: 2 establishments)
Health Care and Social Assistance: Child Day Care Services (20-49: 2, 10-19: 1)
Accommodation and Food Services: Full-Service Restaurants (10-19: 3, 1-4: 2)
Administrative and Support and Waste Management and Remediation Services: Exterminating and Pest Control Services (20-49: 1, 1-4: 2)
Accommodation and Food Services: Limited-Service Restaurants (20-49: 1, 1-4: 1)
Construction: All Other Specialty Trade Contractors (10-19: 1, 5-9: 1)
People in group quarters in 2010:
9 people in nursing facilities/skilled-nursing facilities
7 people in group homes intended for adults
4 people in group homes for juveniles (non-correctional)
Fatal accident statistics in 2014:
Fatal accident count: 1
Vehicles involved in fatal accidents: 2
Fatal accidents caused by drunken drivers: 0
Fatalities: 1
Persons involved in fatal accidents: 3
Pedestrians involved in fatal accidents: 0
Fatal accident statistics in 2011:
Fatal accident count: 1
Vehicles involved in fatal accidents: 1
Fatal accidents caused by drunken drivers: 0
Fatalities: 1
Persons involved in fatal accidents: 1
Pedestrians involved in fatal accidents: 0
Home Mortgage Disclosure Act Aggregated Statistics For Year 2009 (Based on 4 partial tracts)
A) FHA, FSA/RHS & VA Home Purchase Loans
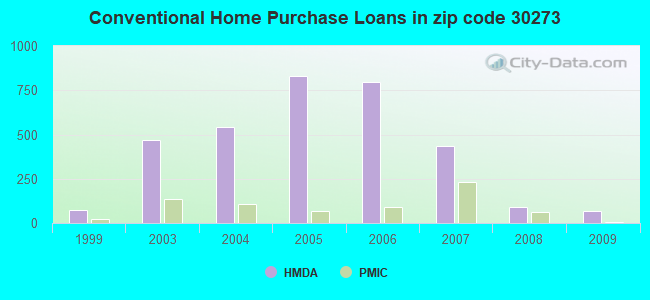
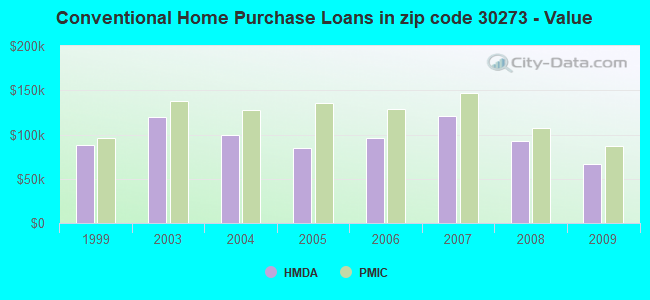
B) Conventional Home Purchase Loans
C) Refinancings
D) Home Improvement Loans
F) Non-occupant Loans on < 5 Family Dwellings (A B C & D)
Number
Average Value
Number
Average Value
Number
Average Value
Number
Average Value
Number
Average Value
LOANS ORIGINATED
159
$97,974
67
$67,165
263
$140,500
9
$15,549
43
$73,087
APPLICATIONS APPROVED, NOT ACCEPTED
7
$123,017
9
$42,228
46
$127,403
2
$16,075
4
$42,975
APPLICATIONS DENIED
42
$100,644
23
$71,859
291
$120,911
31
$25,425
28
$84,998
APPLICATIONS WITHDRAWN
31
$91,818
13
$55,735
171
$134,461
3
$90,833
11
$46,866
FILES CLOSED FOR INCOMPLETENESS
11
$110,820
7
$49,553
45
$136,569
0
$0
5
$41,030
Aggregated Statistics For Year 2008 (Based on 4 partial tracts)
A) FHA, FSA/RHS & VA Home Purchase Loans
B) Conventional Home Purchase Loans
C) Refinancings
D) Home Improvement Loans
F) Non-occupant Loans on < 5 Family Dwellings (A B C & D)
G) Loans On Manufactured Home Dwelling (A B C & D)
Number
Average Value
Number
Average Value
Number
Average Value
Number
Average Value
Number
Average Value
Number
Average Value
LOANS ORIGINATED
214
$128,243
88
$92,214
290
$129,419
26
$24,768
83
$92,233
2
$18,370
APPLICATIONS APPROVED, NOT ACCEPTED
10
$136,515
14
$123,680
74
$126,534
10
$67,473
11
$77,465
0
$0
APPLICATIONS DENIED
64
$120,314
57
$105,177
487
$132,192
86
$59,367
54
$89,690
1
$21,120
APPLICATIONS WITHDRAWN
51
$123,824
28
$112,510
153
$129,907
10
$64,536
15
$88,824
0
$0
FILES CLOSED FOR INCOMPLETENESS
6
$107,393
11
$132,882
44
$130,562
2
$90,305
3
$98,667
0
$0
Aggregated Statistics For Year 2007 (Based on 4 partial tracts)
A) FHA, FSA/RHS & VA Home Purchase Loans
B) Conventional Home Purchase Loans
C) Refinancings
D) Home Improvement Loans
F) Non-occupant Loans on < 5 Family Dwellings (A B C & D)
G) Loans On Manufactured Home Dwelling (A B C & D)
Number
Average Value
Number
Average Value
Number
Average Value
Number
Average Value
Number
Average Value
Number
Average Value
LOANS ORIGINATED
179
$166,245
434
$120,938
411
$122,206
69
$39,387
136
$104,869
2
$54,350
APPLICATIONS APPROVED, NOT ACCEPTED
5
$177,864
81
$108,730
135
$111,862
20
$50,060
26
$90,633
2
$22,965
APPLICATIONS DENIED
39
$143,528
209
$118,860
874
$127,640
155
$49,492
90
$93,809
6
$55,660
APPLICATIONS WITHDRAWN
17
$183,719
69
$135,961
285
$137,255
28
$61,757
24
$93,888
0
$0
FILES CLOSED FOR INCOMPLETENESS
5
$175,856
29
$120,883
79
$129,913
13
$56,825
6
$124,622
0
$0
Aggregated Statistics For Year 2006 (Based on 4 partial tracts)
A) FHA, FSA/RHS & VA Home Purchase Loans
B) Conventional Home Purchase Loans
C) Refinancings
D) Home Improvement Loans
F) Non-occupant Loans on < 5 Family Dwellings (A B C & D)
G) Loans On Manufactured Home Dwelling (A B C & D)
Number
Average Value
Number
Average Value
Number
Average Value
Number
Average Value
Number
Average Value
Number
Average Value
LOANS ORIGINATED
132
$153,515
799
$95,887
541
$108,421
78
$35,903
241
$87,950
2
$38,025
APPLICATIONS APPROVED, NOT ACCEPTED
6
$157,907
115
$98,953
185
$180,775
18
$41,977
47
$76,161
2
$40,665
APPLICATIONS DENIED
23
$129,948
311
$98,618
906
$121,199
183
$45,772
94
$97,719
4
$52,900
APPLICATIONS WITHDRAWN
17
$136,121
138
$91,060
427
$122,583
24
$83,683
44
$81,479
0
$0
FILES CLOSED FOR INCOMPLETENESS
3
$156,317
48
$113,100
110
$123,921
2
$92,945
13
$128,872
0
$0
Aggregated Statistics For Year 2005 (Based on 4 partial tracts)
A) FHA, FSA/RHS & VA Home Purchase Loans
B) Conventional Home Purchase Loans
C) Refinancings
D) Home Improvement Loans
F) Non-occupant Loans on < 5 Family Dwellings (A B C & D)
G) Loans On Manufactured Home Dwelling (A B C & D)
Number
Average Value
Number
Average Value
Number
Average Value
Number
Average Value
Number
Average Value
Number
Average Value
LOANS ORIGINATED
141
$144,828
829
$84,777
700
$110,753
72
$49,972
177
$85,084
0
$0
APPLICATIONS APPROVED, NOT ACCEPTED
1
$167,940
71
$89,865
179
$113,229
18
$26,498
25
$68,648
1
$53,870
APPLICATIONS DENIED
17
$141,914
207
$102,311
847
$121,111
166
$45,798
67
$93,327
6
$71,405
APPLICATIONS WITHDRAWN
22
$145,615
157
$98,509
488
$125,058
57
$107,371
55
$137,123
2
$48,990
FILES CLOSED FOR INCOMPLETENESS
4
$133,368
62
$90,660
94
$117,339
6
$39,215
13
$67,526
0
$0
Aggregated Statistics For Year 2004 (Based on 4 partial tracts)
A) FHA, FSA/RHS & VA Home Purchase Loans
B) Conventional Home Purchase Loans
C) Refinancings
D) Home Improvement Loans
F) Non-occupant Loans on < 5 Family Dwellings (A B C & D)
G) Loans On Manufactured Home Dwelling (A B C & D)
Number
Average Value
Number
Average Value
Number
Average Value
Number
Average Value
Number
Average Value
Number
Average Value
LOANS ORIGINATED
212
$139,283
544
$99,609
795
$113,041
39
$39,046
113
$92,324
5
$34,662
APPLICATIONS APPROVED, NOT ACCEPTED
7
$149,527
71
$111,367
185
$114,906
17
$27,481
25
$93,230
1
$25,350
APPLICATIONS DENIED
37
$133,031
168
$117,354
774
$116,800
115
$26,759
59
$97,717
7
$20,020
APPLICATIONS WITHDRAWN
26
$146,253
75
$112,816
342
$116,928
17
$67,420
11
$104,282
0
$0
FILES CLOSED FOR INCOMPLETENESS
4
$111,362
40
$107,016
120
$114,749
3
$85,130
5
$81,846
0
$0
Aggregated Statistics For Year 2003 (Based on 4 partial tracts)
A) FHA, FSA/RHS & VA Home Purchase Loans
B) Conventional Home Purchase Loans
C) Refinancings
D) Home Improvement Loans
F) Non-occupant Loans on < 5 Family Dwellings (A B C & D)
Number
Average Value
Number
Average Value
Number
Average Value
Number
Average Value
Number
Average Value
LOANS ORIGINATED
381
$139,841
467
$119,342
1,219
$106,230
35
$21,674
123
$90,288
APPLICATIONS APPROVED, NOT ACCEPTED
12
$163,318
57
$115,637
161
$107,250
8
$27,616
14
$88,921
APPLICATIONS DENIED
44
$135,113
101
$116,320
460
$105,846
68
$21,817
34
$100,155
APPLICATIONS WITHDRAWN
30
$150,634
46
$115,419
254
$108,748
7
$31,047
16
$99,128
FILES CLOSED FOR INCOMPLETENESS
7
$163,107
34
$110,171
73
$108,944
5
$18,746
6
$82,088
Aggregated Statistics For Year 1999 (Based on 2 partial tracts)
A) FHA, FSA/RHS & VA Home Purchase Loans
B) Conventional Home Purchase Loans
C) Refinancings
D) Home Improvement Loans
F) Non-occupant Loans on < 5 Family Dwellings (A B C & D)
Detailed PMIC statistics for the following Tracts:0404.11
, 0404.13
2002 - 2018 National Fire Incident Reporting System (NFIRS) incidents
Based on the data from the years 2002 - 2018 the average number of fire incidents per year is 29. The highest number of reported fires - 58 took place in 2012, and the least - 0 in 2003. The data has an increasing trend.
When looking into fire subcategories, the most reports belonged to: Structure Fires (41.2%), and Outside Fires (39.6%).
Fire incident types reported to NFIRS in Zip Code 30273
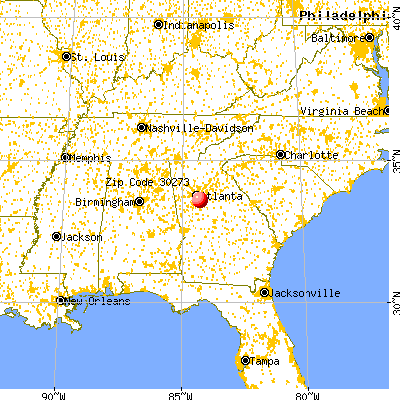


 Nearest zip codes: 30294, 30260, 30281, 30236, 30288, 30297.


 (Students: 967, Location: 6380 EVANS DR, Grades: 6-8)


 Based on the data from the years 2002 - 2018 the average number of fire incidents per year is 29. The highest number of reported fires - 58 took place in 2012, and the least - 0 in 2003. The data has an increasing trend.
 When looking into fire subcategories, the most reports belonged to: Structure Fires (41.2%), and Outside Fires (39.6%).