Billerica: Fire Incidents, Massachusetts (MA)
Where are fire incidents reported in Billerica, MA
Something went wrong! Please refresh the page.
| Fire incidents reported | |
|---|---|
| Sreet name | Count |
| BOSTON RD | 762 |
| RIVER ST | 194 |
| CONCORD RD | 184 |
| TREBLE COVE RD | 106 |
| KENMAR DR | 102 |
| HIGH ST | 94 |
| MIDDLESEX TP | 82 |
| SALEM RD | 74 |
| ANDOVER RD | 70 |
| COOK ST | 64 |
| BILLERICA AV | 56 |
| ALLEN RD | 52 |
| LEXINGTON RD | 52 |
| ROUTE 3 S | 50 |
| ROUTE 3 N | 48 |
| NASHUA RD | 46 |
| RANGEWAY RD | 44 |
| TOWN FARM LN | 42 |
| RIVERHURST RD | 38 |
| CHELMSFORD RD | 36 |
| KIMBROUGH RD | 34 |
| POND ST | 34 |
| BRIDGE ST | 32 |
| MIDDLESEX | 32 |
| ROGERS ST | 32 |
| ALEXANDER RD | 30 |
| BIAGIOTTI WY | 28 |
| BRIDLE RD | 28 |
| BALDWIN RD | 26 |
| CHARME RD | 26 |
| Other | 18 |
2002 - 2018 National Fire Incident Reporting System (NFIRS) incidents
- Incident types reported to NFIRS in Billerica, MA
- 15,42151.5%Rescue & EMS
- 4,55515.2%Hazardous Condition
- 3,38211.3%Service Call
- 3,19010.7%False Alarm
- 2,5168.4%Fire
- 6132.0%Good Intent Call
- 1180.4%Special Incident
- 710.2%Severe Weather
- 570.2%Overpressure Rupture
- Fire incident types reported to NFIRS in Billerica, MA
- 1,00740.0%Outside Fires
- 99539.5%Structure Fires
- 38415.3%Mobile Property/Vehicle Fires
- 1305.2%Other
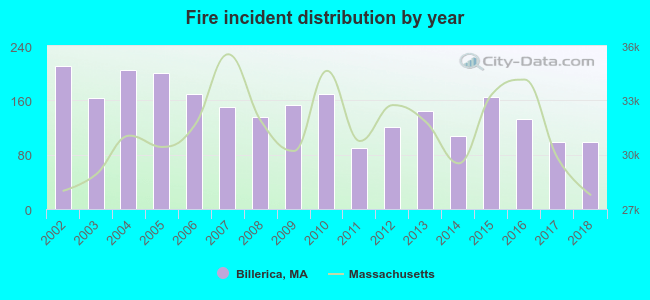 Based on the data from the years 2002 - 2018 the average number of fire incidents per year is 148. The highest number of fires - 211 took place in 2002, and the least - 90 in 2011. The data has a dropping trend.
The average number of yearly fire incidents per 10k residents in Billerica, MA compared to nearest cities:
(Note: Based on data for the last 3 years, including only cities with population 5,000 and above)
| Billerica: | 27.3 |
| Tewksbury: | 29.8 |
| Bedford: | 18.5 |
| Burlington: | 36.5 |
| Wilmington: | 23.6 |
| Chelmsford: | 12.3 |
| Lowell: | 41.4 |
| Woburn: | 52.0 |
| Lexington: | 11.5 |
 The median response time based on all reported fire incidents is 4 minutes. This is similar to the state median value.
The median response time in Billerica, MA compared to nearest cities:
(Note: Based on data for all years, including only cities with at least 500 fire incidents)
| Billerica: | 4 minutes |
| Tewksbury: | 4 minutes |
| Bedford: | 4 minutes |
| Burlington: | 4 minutes |
| Wilmington: | 6 minutes |
| Chelmsford: | 5 minutes |
| Lowell: | 3 minutes |
| Woburn: | 4 minutes |
| Lexington: | 5 minutes |
 Based on the data from the years 2002 - 2018 the average number of fire-related yearly casualties is 2. The highest number of reported injuries - 4 took place in 2002, and the lowest - 0 in 2006. The data has a dropping trend.
The average number of injuries per 1,000 fires is 11. This indicator was the highest - 28 in 2014, and the lowest 0 in 2006. The trend for casualties per 1,000 fire incidents is decreasing. Compared to the state value the number of casualties per 1,000 fire incidents is similar.
Based on the data from the years 2002 - 2018 the average number of fire-related yearly casualties is 2. The highest number of reported injuries - 4 took place in 2002, and the lowest - 0 in 2006. The data has a dropping trend.
The average number of injuries per 1,000 fires is 11. This indicator was the highest - 28 in 2014, and the lowest 0 in 2006. The trend for casualties per 1,000 fire incidents is decreasing. Compared to the state value the number of casualties per 1,000 fire incidents is similar.Casualties per 1,000 incidents in Billerica, MA compared to nearest cities:
(Note: Based on data for all years, including only cities with at least 500 fire incidents)
| Billerica: | 11.1 |
| Tewksbury: | 3.2 |
| Bedford: | 33.1 |
| Burlington: | 7.4 |
| Wilmington: | 10.0 |
| Chelmsford: | 20.9 |
| Lowell: | 5.6 |
| Woburn: | 14.5 |
| Lexington: | 22.2 |
 27.9% incidents where reported in the morning and 72.1% in the evening. The most fires (15.2%) took place on Sunday, and the least (13.2%) on Wednesday.
 Based on the 2,516 reports from years 2002 - 2018 most fires (13.4%) took place during April, and the least (4.6%) in January.
 Out of all 29,923 cases reported during the years 2002 - 2018, the most belonged to the categories: Rescue & EMS (51.5%), Hazardous Condition (15.2%), and Service Call (11.3%).
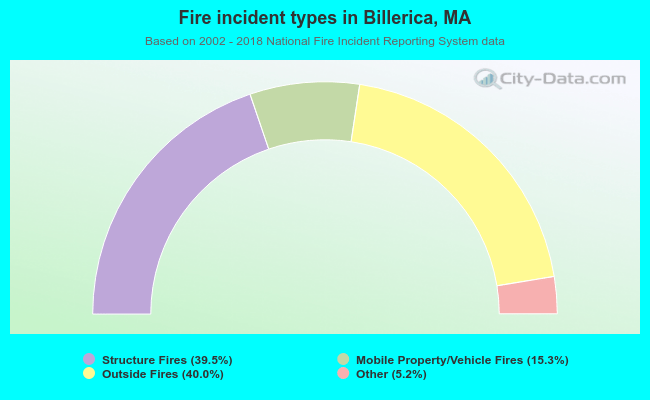 When looking into fire subcategories, the most reports belonged to: Outside Fires (40.0%), and Structure Fires (39.5%).