Lexington: Fire Incidents, Massachusetts (MA)
Where are fire incidents reported in Lexington, MA
Something went wrong! Please refresh the page.
| Fire incidents reported | |
|---|---|
| Sreet name | Count |
| WALTHAM ST | 88 |
| BEDFORD ST | 68 |
| MARRETT RD | 68 |
| MASS AV | 66 |
| RTE 128 HW | 60 |
| LINCOLN ST | 28 |
| WORTHEN RD | 28 |
| CONCORD AV | 26 |
| LOWELL ST | 24 |
| GROVE ST | 22 |
| HARTWELL AV | 20 |
| HAYDEN AV | 20 |
| RTE 128 NORTH HW | 20 |
| PLEASANT ST | 16 |
| RTE 128 SOUTH HW | 16 |
| TURNING MILL RD | 16 |
| EMERSON GARDENS RD | 14 |
| STEDMAN RD | 14 |
| ADAMS ST | 12 |
| HANCOCK ST | 12 |
| NORTH ST | 12 |
| RTE 128 SOUTH | 12 |
| WOBURN ST | 12 |
| CAMDEN ST | 10 |
| HANCOCK AV | 10 |
| LEXINGTON RIDGE DR | 10 |
| MAIN CAMPUS DR | 10 |
| MASS | 10 |
| PERCY RD | 10 |
| REED ST | 10 |
| Other | 158 |
2002 - 2018 National Fire Incident Reporting System (NFIRS) incidents
- Incident types reported to NFIRS in Lexington, MA
- 90247.2%Fire
- 46924.6%Rescue & EMS
- 1759.2%Hazardous Condition
- 1387.2%Good Intent Call
- 1377.2%Service Call
- 864.5%False Alarm
- 20.1%Severe Weather
- Fire incident types reported to NFIRS in Lexington, MA
- 52458.1%Structure Fires
- 18820.8%Mobile Property/Vehicle Fires
- 18120.1%Outside Fires
- 91.0%Other
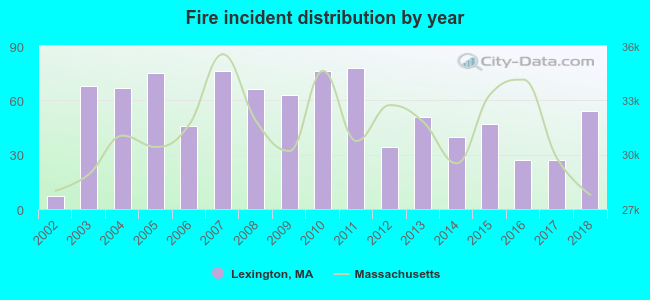 According to the data from the years 2002 - 2018 the average number of fire incidents per year is 53. The highest number of reported fire incidents - 78 took place in 2011, and the least - 7 in 2002. The data has a growing trend.
The average number of yearly fire incidents per 10k residents in Lexington, MA compared to nearest cities:
(Note: Based on data for the last 3 years, including only cities with population 5,000 and above)
| Lexington: | 11.5 |
| Arlington: | 23.8 |
| Lincoln: | 111.1 |
| Winchester: | 12.9 |
| Bedford: | 18.5 |
| Waltham: | 31.2 |
| Burlington: | 36.5 |
| Belmont: | 42.3 |
| Woburn: | 52.0 |
 The median response time based on all reported fire incidents is 5 minutes. This is higher than the state median value.
The median response time in Lexington, MA compared to nearest cities:
(Note: Based on data for all years, including only cities with at least 500 fire incidents)
| Lexington: | 5 minutes |
| Arlington: | 3 minutes |
| Lincoln: | 5 minutes |
| Winchester: | 4 minutes |
| Bedford: | 4 minutes |
| Waltham: | 4 minutes |
| Burlington: | 4 minutes |
| Belmont: | 4 minutes |
| Woburn: | 4 minutes |
 According to the data from the years 2002 - 2018 the average number of fire-related yearly casualties is 1. The highest number of casualties - 5 took place in 2005, and the lowest - 0 in 2002. The data has a constant trend.
The average number of casualties per 1,000 fire incidents is 21. This indicator was the highest - 87 in 2006, and the lowest 0 in 2002. The trend for injuries per 1,000 fire incidents is constant. Compared to the state value the number of injuries per 1,000 fires is much higher.
According to the data from the years 2002 - 2018 the average number of fire-related yearly casualties is 1. The highest number of casualties - 5 took place in 2005, and the lowest - 0 in 2002. The data has a constant trend.
The average number of casualties per 1,000 fire incidents is 21. This indicator was the highest - 87 in 2006, and the lowest 0 in 2002. The trend for injuries per 1,000 fire incidents is constant. Compared to the state value the number of injuries per 1,000 fires is much higher.Casualties per 1,000 incidents in Lexington, MA compared to nearest cities:
(Note: Based on data for all years, including only cities with at least 500 fire incidents)
| Lexington: | 22.2 |
| Arlington: | 8.0 |
| Lincoln: | 0.0 |
| Winchester: | 24.3 |
| Bedford: | 33.1 |
| Waltham: | 18.0 |
| Burlington: | 7.4 |
| Belmont: | 5.9 |
| Woburn: | 14.5 |
 36.4% incidents where reported in the morning and 63.6% in the evening. The most fires (16.5%) took place on Friday, and the least (12.4%) on Thursday.
 Based on the 902 fire incident reports from years 2002 - 2018 most fires (11.9%) took place during April, and the least (6.0%) in September.
 Out of all 1,909 cases reported during the years 2002 - 2018, the most belonged to the categories: Fire (47.2%), Overpressure Rupture (24.6%), and Rescue & EMS (9.2%).
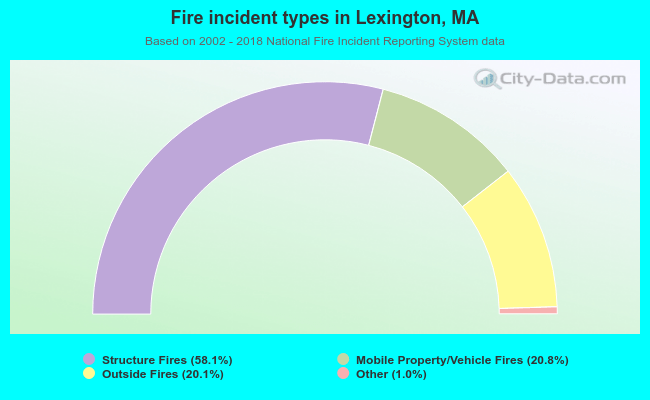 When looking into fire subcategories, the most incidents belonged to: Structure Fires (58.1%), and Mobile Property/Vehicle Fires (20.8%).