Waltham: Fire Incidents, Massachusetts (MA)
Where are fire incidents reported in Waltham, MA
Something went wrong! Please refresh the page.
| Fire incidents reported | |
|---|---|
| Sreet name | Count |
| MAIN ST | 270 |
| LEXINGTON ST | 266 |
| MOODY ST | 236 |
| SOUTH ST | 208 |
| TOTTEN POND RD | 172 |
| BEAVER ST | 130 |
| RTE 128 | 122 |
| TRAPELO RD | 110 |
| RIVER ST | 96 |
| WINTER ST | 86 |
| PROSPECT ST | 78 |
| CHARLES ST | 68 |
| SEYON ST | 66 |
| BACON ST | 64 |
| HIGH ST | 54 |
| MARKET PLACE DR | 54 |
| ADAMS ST | 52 |
| LEXINGTON ST ST | 52 |
| MUTUAL AID-ASSGD OUT OF CITY | 52 |
| LINCOLN ST | 50 |
| STEARNS HILL RD | 50 |
| BROWN ST | 46 |
| FOREST ST | 46 |
| WILLOW ST | 46 |
| CALVARY ST | 44 |
| FELTON ST | 44 |
| MIDDLESEX CIR | 42 |
| PROSPECT HILL RD | 42 |
| NEWTON ST | 40 |
| LINDEN ST | 38 |
| Other | 553 |
2002 - 2018 National Fire Incident Reporting System (NFIRS) incidents
- Incident types reported to NFIRS in Waltham, MA
- 26,81846.7%Rescue & EMS
- 11,04319.2%Hazardous Condition
- 8,57814.9%False Alarm
- 4,8338.4%Service Call
- 3,2775.7%Fire
- 2,5394.4%Good Intent Call
- 3310.6%Special Incident
- Fire incident types reported to NFIRS in Waltham, MA
- 1,34941.2%Structure Fires
- 1,01731.0%Outside Fires
- 50515.4%Other
- 40612.4%Mobile Property/Vehicle Fires
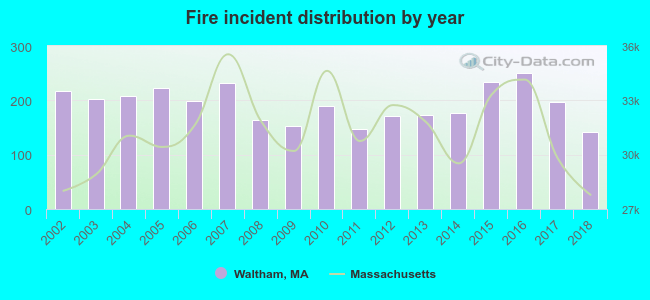 Based on the data from the years 2002 - 2018 the average number of fire incidents per year is 193. The highest number of reported fire incidents - 251 took place in 2016, and the least - 142 in 2018. The data has a declining trend.
The average number of yearly fire incidents per 10k residents in Waltham, MA compared to nearest cities:
(Note: Based on data for the last 3 years, including only cities with population 5,000 and above)
| Waltham: | 31.2 |
| Watertown: | 12.2 |
| Weston: | 34.3 |
| Belmont: | 42.3 |
| Newton: | 29.6 |
| Arlington: | 23.8 |
| Lexington: | 11.5 |
| Lincoln: | 111.1 |
| Wellesley: | 18.2 |
 The median response time based on all reported fire incidents is 4 minutes. This is about the same as the Massachusetts median value.
The median response time in Waltham, MA compared to nearest cities:
(Note: Based on data for all years, including only cities with at least 500 fire incidents)
| Waltham: | 4 minutes |
| Watertown: | 4 minutes |
| Weston: | 4 minutes |
| Belmont: | 4 minutes |
| Newton: | 5 minutes |
| Arlington: | 3 minutes |
| Lexington: | 5 minutes |
| Lincoln: | 5 minutes |
| Wellesley: | 4 minutes |
 Based on the data from the years 2002 - 2018 the average number of fire-related fatalities per year is 1. The highest number of deaths - 2 took place in 2009, and the lowest - 0 in 2003. The data has a constant trend.
The average number of deaths per 1,000 fire incidents is 3. This indicator was the highest - 13 in 2009, and the lowest 0 in 2003. The trend for fatalities per 1,000 fire incidents is growing. Compared to the state value the number of fatalities per 1,000 fire incidents is higher.
Based on the data from the years 2002 - 2018 the average number of fire-related fatalities per year is 1. The highest number of deaths - 2 took place in 2009, and the lowest - 0 in 2003. The data has a constant trend.
The average number of deaths per 1,000 fire incidents is 3. This indicator was the highest - 13 in 2009, and the lowest 0 in 2003. The trend for fatalities per 1,000 fire incidents is growing. Compared to the state value the number of fatalities per 1,000 fire incidents is higher.
 Based on the data from the years 2002 - 2018 the average number of fire-related casualties per year is 3. The highest number of injuries - 9 took place in 2014, and the lowest - 1 in 2006. The data has a decreasing trend.
The average number of injuries per 1,000 fire incidents is 19. This indicator was the highest - 51 in 2014, and the lowest 5 in 2006. The trend for casualties per 1,000 incidents is dropping. Compared to the state value the number of casualties per 1,000 fires is higher.
Based on the data from the years 2002 - 2018 the average number of fire-related casualties per year is 3. The highest number of injuries - 9 took place in 2014, and the lowest - 1 in 2006. The data has a decreasing trend.
The average number of injuries per 1,000 fire incidents is 19. This indicator was the highest - 51 in 2014, and the lowest 5 in 2006. The trend for casualties per 1,000 incidents is dropping. Compared to the state value the number of casualties per 1,000 fires is higher.
 33.8% incidents where reported in the morning and 66.2% in the evening. The most fires (16.6%) took place on Sunday, and the least (12.4%) on Tuesday.
 Based on the 3,277 fire incidents from years 2002 - 2018 most fires (10.9%) took place during May, and the least (5.2%) in February.
 Out of all 57,467 cases reported during the years 2002 - 2018, the most belonged to the categories: Rescue & EMS (46.7%), Hazardous Condition (19.2%), and False Alarm (14.9%).
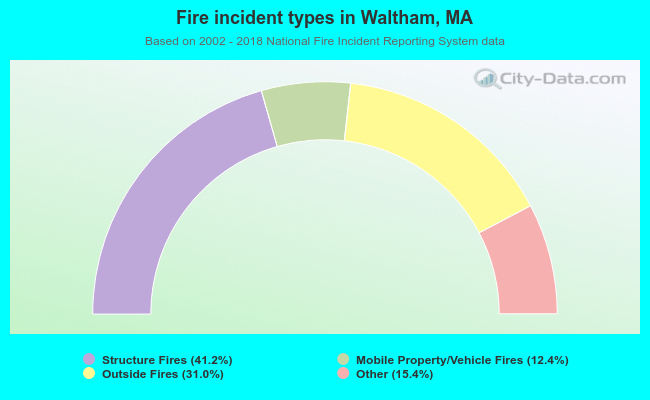 When looking into fire subcategories, the most reports belonged to: Structure Fires (41.2%), and Outside Fires (31.0%).