Carver: Fire Incidents, Massachusetts (MA)
Where are fire incidents reported in Carver, MA
Something went wrong! Please refresh the page.
|
| |||||||||||||||||||||||||||||||||||||||||||||||||||||||||||||||||||||||||||||||||||||||||||||||||||||||||||||
2002 - 2018 National Fire Incident Reporting System (NFIRS) incidents
- Incident types reported to NFIRS in Carver, MA
- 14458.1%Fire
- 6927.8%Rescue & EMS
- 166.5%Service Call
- 145.6%Good Intent Call
- 31.2%Hazardous Condition
- 10.4%Overpressure Rupture
- 10.4%False Alarm
- Fire incident types reported to NFIRS in Carver, MA
- 8458.3%Structure Fires
- 5538.2%Mobile Property/Vehicle Fires
- 42.8%Outside Fires
- 10.7%Other
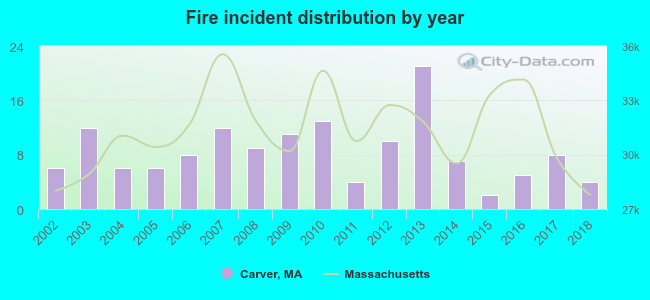 According to the data from the years 2002 - 2018 the average number of fires per year is 8. The highest number of reported fires - 21 took place in 2013, and the least - 2 in 2015. The data has a decreasing trend.
The average number of yearly fire incidents per 10k residents in Carver, MA compared to nearest cities:
(Note: Based on data for the last 3 years, including only cities with population 5,000 and above)
| Carver: | 4.9 |
| Middleborough: | 34.8 |
| Plymouth: | 294.0 |
| Rochester: | 13.4 |
| Wareham: | 46.6 |
| Kingston: | 82.3 |
| Halifax: | 35.5 |
| Lakeville: | 26.4 |
| Pembroke: | 3.6 |

 34.7% incidents where reported in the morning and 65.3% in the evening. The most fires (20.8%) took place on Monday, and the least (6.9%) on Sunday.
 Based on the 144 fire incidents from years 2002 - 2018 most fires (16.0%) took place during February, and the least (4.2%) in August.
 Out of all 248 cases reported during the years 2002 - 2018, the most belonged to the categories: Fire (58.1%), Rescue & EMS (27.8%), and Service Call (6.5%).
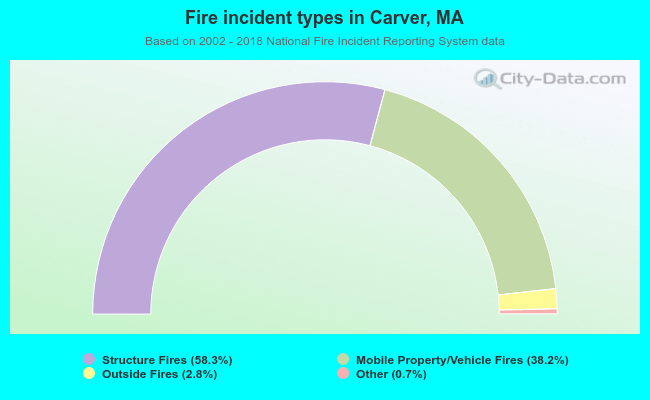 When looking into fire subcategories, the most reports belonged to: Structure Fires (58.3%), and Mobile Property/Vehicle Fires (38.2%).